Citation:
Li Xiang, Juan Nie, Li Wang, Yu Wang, Jingchun Shi, Juntong Wei, Chi-Wai Lau, Zongwei Cai, Yu Huang. Integrated metabolomics analysis of the effect of PPARδ agonist GW501516 on catabolism of BCAAs and carboxylic acids in diabetic mice[J]. Chinese Chemical Letters,
2021, 32(7): 2197-2202.
doi:
10.1016/j.cclet.2020.12.042
Integrated metabolomics analysis of the effect of PPARδ agonist GW501516 on catabolism of BCAAs and carboxylic acids in diabetic mice
English
Integrated metabolomics analysis of the effect of PPARδ agonist GW501516 on catabolism of BCAAs and carboxylic acids in diabetic mice
yu-huang@cuhk.edu.hk (Y. Huang). 1 The authors contribute equally to this study.
Received Date:
09 October 2020 Accepted Date:
23 December 2020 Revised Date:
15 November 2020 Available Online:
15 July 2021
Abstract:
The peroxisome proliferator-activated receptor (PPARδ) agonists are reported to improve insulin sensitivity, reduce glucose levels, and alleviate dysfunctional lipid metabolism in animal models of type 2 diabetes mellitus. However, the underlying mechanisms remain incompletely understood. Metabolism plays an essential role in the biological system. Monitoring of metabolic changes in response to disease conditions or drug treatment is critical for better understanding of the pathophysiological mechanisms. In this study, metabolic profiling analysis by gas chromatography-mass spectrometry integrated with targeted analysis by liquid chromatography-mass spectrometry was carried out in plasma samples of db/db diabetic mice after six-week treatment of PPARδ agonist GW501516. GW501516 treatment significantly altered levels of metabolites, such as branched-chain amino acids (BCAAs), BCAA metabolites (3-hydroxyisobutyric acid and 3-hydroxyisovaleric acid), long-chain fatty acids, uric acid and ketone bodies (3-hydroxybutyric acid and 2-hydroxybutyric acid) which are all associated with the impaired systemic insulin sensitivity. The present results indicate the beneficial effect of PPARδ agonist in alleviating insulin resistance of diabetic mice by favorably modulating metabolic profile, thus providing valuable information in understanding the therapeutic potential of PPARδ agonists in correcting metabolic dysfunction in diabetes.
Type 2 diabetes mellitus (T2DM), a chronic metabolic disorder is closely associated with increased risk for the development of cardiovascular diseases [1]. T2DM is characterized by hyperglycemia, hyperlipidemia and insulin resistance [1]. The causal factors for the development of T2DM include obesity, physical inactivity and high carbohydrate intake [2]. On the other hand, genetic factors such as insufficient expression/activity of peroxisome proliferator-activated receptors (PPARs) also contribute to the development of T2DM [3, 4]. PPARs belong to a nuclear receptor superfamily, they function as the ligand-activated transcription factors that control the expression of genes involved in lipid metabolism [5], organogenesis [6], cell proliferation and differentiation [7], inflammation [8], and carbohydrate metabolism [9]. PPARs are usually divided into three subtypes, PPARα, PPARδ and PPARγ [4]. PPARα is principally expressed in the liver, heart, kidney and muscle, and PPARγ is mainly expressed in the adipose tissue, while PPARδ is ubiquitously expressed with its abundance in the brain and adipose tissue. Selective activation of PPARδ by agonists has been reported to correct dyslipidemia [10], improve glucose tolerance [11], and ameliorate insulin resistance [12]. However, the underlying mechanisms are still not fully clear.
Metabolomics is an effective tool to monitor the whole metabolic changes in diseases or in response to drug treatment [13, 14]. It is one of the systematic approaches that generates biological information more directly than transcriptome or proteomics [15]. Gas chromatography coupled with mass spectrometry (GC-MS) is one of the most commonly utilized technique for metabolomics analysis because it provides appropriate chromatographic resolution and good reproducible retention times [16-18]. In the present study, we used GC–MS for metabolic profiling analysis to investigate the mechanisms in response to PPARδ activation against diabetes. GW501516 is a PPARδ agonist which was reported to alleviate insulin resistance and glucose tolerance [19, 20]. The profiling analysis shows that the increased levels of a number of metabolites related to insulin resistance in diabetic mice were reduced or reversed by GW501516. In addition, the targeted metabolomics analysis of branched-chain amino acids (BCAAs) and their metabolites by liquid chromatography coupled with mass spectrometry (LC–MS) provides useful information for better understanding of the effect of GW501516 on BCAA metabolism indb/db diabetic mice.
For the animal experiments, both C57BL/KsJ db/db diabetic and C57BL/KsJ db/m+ non-diabetic male mice at age of 7–8 weeks were used. The mice were obtained from the Animal Facility of the Chinese University of Hong Kong (CUHK). Animal experimental procedures were approved by the Hong Kong government Department of Health and the CUHK Animal Research Ethics Committee. All mice were kept in a humidity- and temperature-controlled environment and under a 12 h light/dark cycle condition and fed with a standard laboratory chow and free access to water. Mice were randomly assigned into four groups, e.g., db/m+ control (CC, n=9), db/m+ treated with GW501516 (CP, n=9), db/db control (OC, n=9), db/db treated with GW501516 (OP, n=9). The mice were orally administered with GW501516 (10 mg kg−1 day−1, suspended in 0.5% carboxymethyl cellulose), six days a week.
After six weeks of oral treatment, the fasting blood glucose level, insulin tolerance test (ITT) and oral glucose tolerance test (OGTT) were performed by a glucose meter (Roche Diagnostics, Meylan, France). All mice were sacrificed by CO2 anesthesia. The blood sample was immediately collected with heparin sodium moistened micro-centrifuge tubes, centrifuged at 3000 rpm (4 ℃) for 10 min. Supernatants were collected. Plasma samples were kept under −80 ℃ until later analysis.
For sample preparation for GC–MS analysis, 120 μL of ice-cold MeOH was added to 30 μL of plasma, vortexed for 1 min, and then followed by 10-min centrifugation at 14, 200 rpm (4 ℃). The supernatants were collected and dried with internal standard (adonitol) in a vacuum concentrator. The dried residue was firstly derivatized with 30 μL of methoxyamine (methoxyamine hydrochloride prepared in pyridine, 20 mg/mL) at 55 ℃ for 30 min followed by trimethylsilylation with 60 μL of BSTFA (plus 1% of TMCS), and incubated for one hour at 70 ℃. After cooling down, the derivatized samples were diluted in an equal volume (90 μL) of hexane, mixed and then centrifuged for 10 min at 14, 200 rpm at room temperature. The supernatants were transferred to autosampler vials for GC–MS analysis. The quality control (QC) sample was prepared by pooling 30 μL of each derivatized sample to monitor the stability of the GC–MS system.
For targeted detection of BCAA metabolites, 20 μL of each plasma sample was used, and the deproteinization process was the same as for GC–MS analysis. The supernatants were collected, and dried with internal standard (13C-butyric acid) gently with nitrogen gas at 30 ℃. The derivatization procedure was performed as described [21]. Briefly, the working solution A for derivatization of BCAA metabolites was prepared by mixing N, N-dimethyl-6, 7-dihydro-5H-pyrrolo [3, 4-d] pyrimidine-2-amine (DHPP, 1.2 mg/mL) and N-(3-dimethylaminopropyl)-N'-ethylcarbodiimide (EDC)·HCl (1.2 mg/mL) in methanol. One hundred μL of working solution A was added to dried plasma samples and mixed for 1 min, then dried again with nitrogen gas (30 ℃). The residues were reconstituted in 100 μL of 20% methanol (methanol/H2O, v/v=20/80) immediately before LC–MS detection. For targeted measurement of long-chain fatty acids (LCFA), plasma samples (20 μL) were derivatized with 3-nitrophenylhydrazine hydrochloride (3-NPH) as described [22]. Briefly, deproteinized plasma samples (with appropriate concentration of internal standard U-13C-palmitic acid) were derivatized with 40 μL of 3-NPH solution [200 mmol/L of 3-NPH in 70% of MeOH (methanol/H2O, v/v=70/30)] and 40 μL of EDC solution [120 mmol/L of EDC with 6% of pyridine in 70% of MeOH (methanol/H2O, v/v=70/30)] at 40 ℃ for 30 min. Then the derivatized samples were directly analyzed.
The GC–MS analysis was carried out on an Agilent 7890B gas chromatography coupled with a 5977A mass spectrometric system. DB-5MS capillary column (coated with 5% diphenyl cross-linked 95% dimethylpolysiloxane, 0.25-μm film thickness, 30 m×250 μm i.d., Agilent J & W Scientific, Folsom, CA, U.S.A.) was used. Non-targeted analysis was performed under EI source. The detailed parameters included: scan range, m/z 50–650; solvent delay, 6 min; collision energy, 70 eV; column inlet pressure, 70 kPa; helium carrier gas flow, 1.0 mL/min. Interface and injection temperatures were set at 250 ℃ while injection volume was 1 μL with a splitless mode. Temperature gradient was the same as described before [16]. Briefly, the initial oven temperature was 70 ℃, held for 2 min, then raised at a rate of 6 ℃/min to 200 ℃. Thereafter, the temperature was raised to 300 ℃ in a rate of 10 ℃/min. The total running duration was 45 min.
The targeted detection of BCAA metabolites was carried out as reported [21] on UltiMate 3000 liquid chromatography combined with Q ExactiveTM Focus Orbitrap mass spectrometry (LC-Orbitrap-MS) (Thermo Fisher Scientific, MA, U. S. A.). Briefly, the separation was performed on a Phenomenex polar C18 column (1.6 μm, 2.1×150 mm). Mobile phase A was Milli-Q water with 0.1% FA, and phase B was ACN. The elution gradient was started with 15% of phase B and held for 2 min, gradually increased to 40% of phase B at 8 min, then increased to 100% of phased B at 9 min, held for 2 min, finally equilibrated for 3 min with 15% of phase B. Injection volume was 10 μL. For the MS, the resolution was set at 35000. Capillary temperature was 320 ℃. Aux gas heater temperature was 300 ℃. Spray voltage was 3.5 kV. Sheath gas was 30 psi. Aux gas was 10 psi, and the collision energy was 35 eV. The detection was operated in a parallel reaction monitoring (PRM) mode. Targeted detection of free fatty acids was carried out on UltiMate 3000 liquid chromatography combined with triple quadrupole mass spectrometry (LC-QqQ-MS) (Thermo Fisher Scientific, MA, U.S.A.). Phenomenex polar C18 column (1.6 μm, 2.1×150 mm) was selected. The mobile phase A was water with 0.01% FA. Mobile phase B was ACN with 0.01% FA. The gradient was set as follows: 30% of B was set as initial gradient and held for 0.5 min, then increased to 100% of B within 11.5 min, held for 3 min. The mobile phase B was set back to 30% of B within 0.1 min, and held for 2.9 min. The flow rate was 0.25 mL/min, and the injection volume was 10 μL. The parameters of the MS part were set as follows: the spray voltage was 2.5 kV; capillary temperature was 320 ℃; aux gas heater temperature was 300 ℃; aux gas and sheath gas flow rate were 10 psi and 40 psi, respectively. Measurement was performed in selected reaction monitoring (SRM) mode. The transitions and collision energies were listed in Table S1 (Supporting information).
GC–MS output files were operated by XCMS software on an open-source R statistical language (version 3.3.2). Discriminated metabolites from GC–MS were firstly searched with NIST library based on similarity indices (R. Match and Match > 800), then verified with standards. Targeted data extraction of BCAA metabolites and LCFA were performed by Thermo Xcalibur (version 4.0) software; each peak was manually checked.
The extracted ions were put into MetaboAnalyst 4.0 (https://www.metaboanalyst.ca/) [23] for multivariate statistical analysis. Partial least squares discriminant analysis (PLS-DA) was performed. Kyoto Encyclopedia of Genes and Genomes (KEGG, genome.jp/kegg) and Human Metabolome Database (HMDB, http://www.hmdb.ca) were applied for pathway analysis. Statistical analysis was performed on Prism-GraphPad by using analysis of variance (ANOVA) method, followed by Tukey's multiple comparison test. The results represent means±SEM. Significance was considered when P-value less than 0.05.
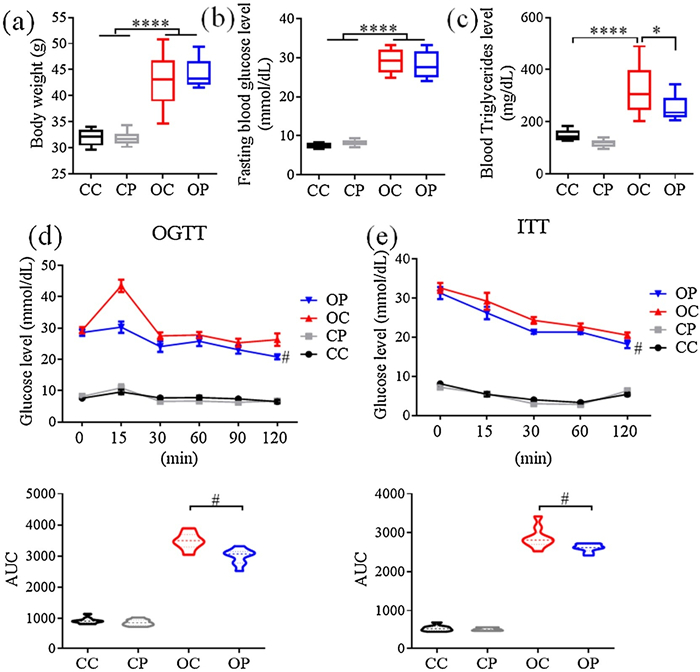
Dramatic increases in body weight, circulating blood glucose and triglyceride concentrations are the phenotypic features of T2DM. The present study shows that the levels of these three parameters were all markedly elevated in db/db mice compared to db/m+ control mice. Six-week treatment of GW501516 reduced total blood triglyceride level without affecting body weight or blood glucose concentration (Figs. 1a–c). The impaired glucose tolerance [24] and insulin resistance [25] were commonly used as diagnostic parameters for T2DM. The results of both glucose tolerance test (OGTT) and insulin tolerance test (ITT) show that chronic GW501516 treatment improved both glucose tolerance and insulin sensitivity in db/db mice (Figs. 1d and e), indicating that pharmacological activation of PPARδ benefits diabetic mice through correcting dyslipidemia, improving glucose tolerance and enhancing insulin sensitivity.
Figure 1
Figure 1.
The effects of chronic treatment of db/db mice with PPARδ agonist GW501516 on (a) body weight, (b) fasting blood glucose level, (c) total blood triglyceride level, (d) oral glucose tolerance test (OGTT) and (e) insulin tolerance test (ITT). *P < 0.05. ****P < 0.0001.#P < 0.01. CC, db/m+ control; CP, db/m+ treated with GW501516; OC, db/db control; OP, db/db treated with GW501516. AUC, area under curve. Results are means±SEM, n =9.
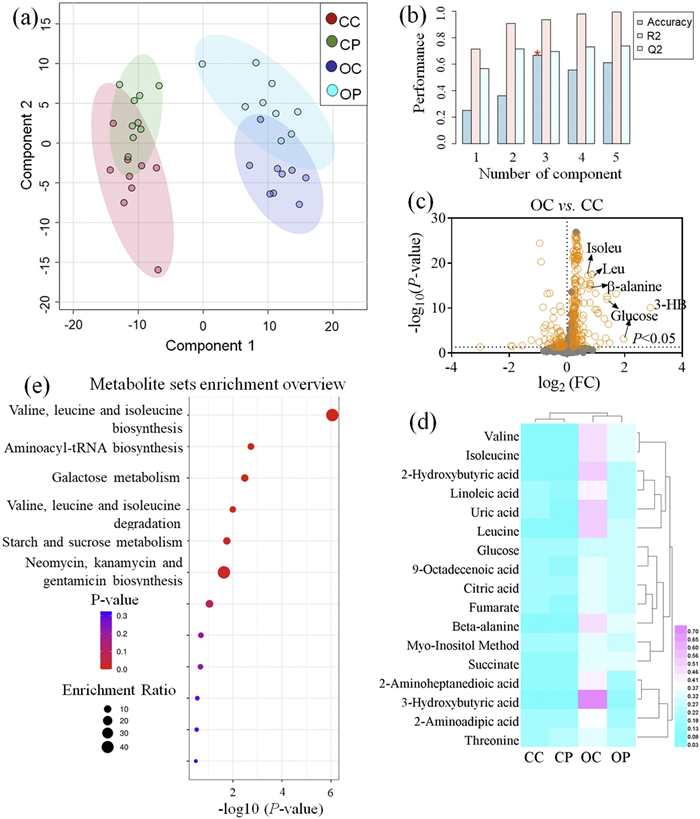
Non-targeted metabolomics analysis by GC-MS was carried out in plasma samples after GW501516 treatment in diabetic mice. PLS-DA multivariate statistical analysis was performed (Fig. 2a) with the cross validation analysis to evaluate the performance of the PLS-DA model (Fig. 2b). The high R2 and Q2 values reflect the high robustness of the PLS-DA model. The PLS-DA score plot shows that db/db mice (OC and OP groups) were clustered clearly away from db/m+ mice (CC and CP groups), indicating a huge metabolic difference between the two strains of mice. Although there was a slight overlap between OP and OC, the clustering of the OP group was evidently distant from the OC group. These results indicate that PPARδ agonist could substantially alleviate diabetic metabolic dysfunction. The Volcano plot (Fig. 2c), heatmap (Fig. 2d), and pathway analysis (Fig. 2e) between OC and OP show that the mostly changed metabolites involve metabolism of BCAA, glucose, and SCFA.
Figure 2
Figure 2.
GC-MS analysis of plasma samples. (a) PLS-DA score plot with red dots representing db/m+ non-diabetic mice (CC), green dots representing db/m+ mice treated with GW501516 (CP), dark blue dots representing db/db mice (OC), and light blue dots representing db/db mice treated with GW501516 (OP). (b) Cross validation of (a). (c) Volcano plot between OC and CC. (d) Heatmap of differentiated metabolites in CC, CP, OC and OP groups. (e) Pathway enrichment analysis of discriminated metabolites between OC and CC groups (generated from MetaboAnalyst 4.0). FC, fold change. Isoleu, isoleucine, Leu, leucine, 3-HB, 3-hydroxybutyric acid.
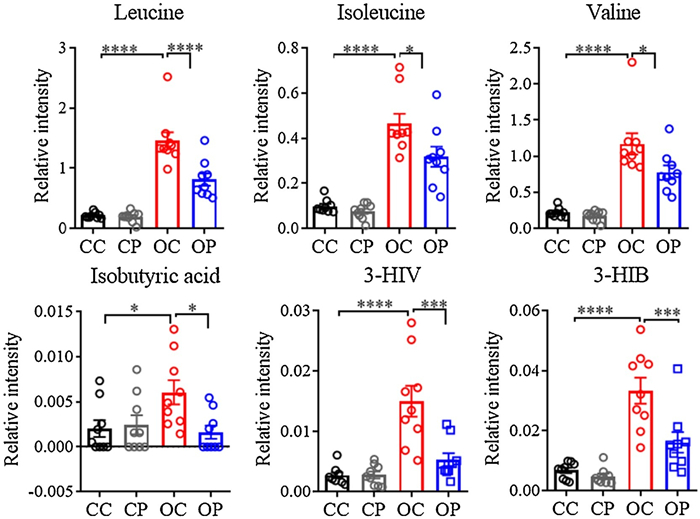
Many metabolites were found to contribute to the discrimination between db/db and db/m+ mice. Plasma levels of 2-hydroxybutyric acid (2-HB), 3-hydroxybutyric acid (3-HB), glucose, BCAAs, TCA cycle metabolites, etc. were dramatically altered in diabetic mice. Chronic GW501516 treatment reduced or normalized the elevated levels of BCAA, 2-HB, 3-HB and uric acid in the plasma of db/db mice (Fig. 3 and 4). The targeted analysis of metabolites in BCAA oxidation/catabolism pathways shows that the plasma levels of BCAA metabolites, including isobutyric acid, 3-hydroxyisobutyric acid (3-HIB) and 3-hydroxyisovaleric acid (3-HIV), profoundly reduced by GW501516 administration to db/db mice.
Figure 3
Figure 3.
The effect of chronic GW501516 treatment on BCAAs catabolism in db/db mice. *P < 0.05. ***P < 0.001. ****P < 0.0001. 3-HIV, 3-hydroxyisovaleric acid. 3-HIB, 3-hydroxyisobutyric acid. CC, db/m+ control; CP, db/m+ treated with GW501516; OC, db/db control; OP, db/db treated with GW501516. Results are means±SEM, n=9.
The association of BCAAs with metabolic diseases is still controversial. A wealth of interventional studies reported that increasing dietary levels of BCAAs are beneficial in modulating factors associated with obesity or diabetes, such as glycemic index, body composition and food intake [26-30]. However, many observational studies suggest that elevated circulating BCAAs were associated with poor metabolic health and the blood levels of BCAAs were increased significantly in patients with diabetes or obesity [31, 32], and also in rodent models of metabolic diseases [33, 34]. Several clinical studies revealed an association between the increased blood BCAAs levels and insulin resistance [35], as well as levels of HbA [36] and HOMA index [37]. The present study shows elevated plasma levels of all three BCAAs in db/db mice. There are two possible explanations for the increased circulating BCAAs under diabetic conditions, (1) an elevated accumulation of BCAAs due to increased food intake and tissue protein degradation and (2) incomplete BCAAs oxidation which is partly characterized by increased levels of BCAA metabolites. A valine metabolite 3-HIB, which is secreted from skeletal muscle, was reported to cause insulin resistance through increasing fatty acid uptake and promoting lipid accumulation in muscle [38]. In addition, 3-HIV, a metabolite of leucine, is related to diabetic ketoacidosis [39]. In the present study, in addition to BCAAs, the increased levels of 3-HIB, 3-HIV and isobutyric acid were all markedly reduced by GW501516 treatment in db/db mice (Fig. 3). These results indicate that pharmacological activation of PPARδ exerts a clear beneficial effect in correcting incomplete BCAAs oxidation and this effect is likely to contribute to the improved insulin sensitivity in db/db mice.
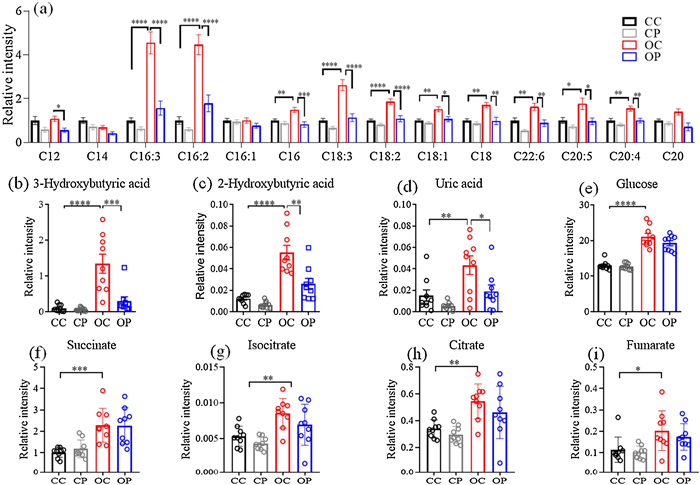
The accumulation of free fatty acids (FFAs) has been widely reported in patients with obesity and diabetes [40, 41]. FFAs play important physiological roles in functions of the liver, heart, skeletal and pancreas. The elevated blood FFAs may directly participate in pathophysiology of diabetes, especially during the development of insulin resistance [42]. The present study shows that the plasma levels of most LCFA, such as hexadecadienoic acid (C16:2), α-linolenic acid (C18:3) and linoleic acid (C18:2), were increased significantly in db/db mice (Fig. 4a), which can be reversed by GW501516 treatment in db/db mice, suggesting that GW501516 alleviates insulin resistance probably in part through lowering the circulating FFA levels.
3-HB is one of the ketone bodies contributing to diabetic ketoacidosis. The lack of sufficient insulin leads to impaired utilization of glucose. Under such situations, fatty acids oxidation (FAO) increases in order to compensate for the diminished glucose-dependent energy supply. Ketone bodies such as 3-HB, is also generated during this process. 3-HB can serve as an energy source in response to cell starvation. However, the low pKa of 3-HB and other ketone bodies turns blood acidic, commonly characterized as ketoacidosis. In addition, 3-HB can also be generated from ketogenic amino acids, such as leucine and isoleucine [43]. The elevation of 3-HB might be resulted from insufficient insulin, inefficient FAO, or ketogenic amino acid catabolism. Metabolomic profiling analysis revealed that 3-HB was one of the mostly altered metabolites in the plasma of diabetic mice (Fig. 2c), which can be reversed by GW501516 treatment (Fig. 4b). The reduced circulating 3-HB level is likely to account for GW501516-induced improvement of insulin sensitivity. Another contributing factor may be related to GW501516-improved efficiency of FAO.
α-Hydroxybutyric acid (2-HB) is an organic acid generated as a byproduct from the formation of α-ketobutyric acid catalyzed by lactate dehydrogenase (LDH) or α-hydroxybutyrate dehydrogenase (αHBDH). 2-HB is primarily produced in the liver as a byproduct from threonine, methionine, homoserine, α-aminobutyric acid [44] and glutathione synthesis. 2-HB is reportedly associated with cardio-metabolic diseases. Increased 2-HB level serves as an early indicator of insulin resistance and impaired glucose regulation [45]. The present study shows that the markedly increased plasma 2-HB level in db/db mice was reduced following GW501516 treatment (Fig. 4c), indicating that GW501516 improves insulin sensitivity in diabetic mice at least partly through lowering the circulating 2-HB level.
Uric acid is an end product of purine metabolism. Elevated plasma uric acid concentration is related to insulin resistance [11], and recognized as a predictor of the development of diabetic nephropathy [12]. The present study shows that plasma uric acid was increased in db/db mice and this increase was normalized after GW501516 treatment (Fig. 4d). The results indicate that PPARδ activation exerts a positive role in alleviating insulin resistance and diabetic complications.
As shown in Figs. 4e–i, the levels of glucose and the downstream metabolites such as succinic acid, isocitric acid, fumaric acid and citric acid in TCA cycle were all elevated in db/db mice, which were however not affected by GW501516 treatment. This result is consistent with the lack of effect of GW501516 on fasting blood glucose level in db/db mice (Fig. 1b). The present results indicate that GW501516 treatment alleviates insulin resistance independent of glucose metabolism.
In summary, both integrated non-targeted and targeted metabolomics studies of the metabolic effect of PPARδ agonist GW501516 in db/db diabetic mice reveal that in vivo GW501516 treatment in diabetic mice lowers the increased plasma levels of a number of metabolites that are reportedly associated with the development of insulin resistance in diabetes and they include BCAAs, BCAA metabolites, uric acid, fatty acids and ketone bodies (3-HB and 2-HB) (Fig. S1 in Supporting information). However, GW501516 does not affect the plasma glucose level in diabetic mice. The beneficial metabolic effect of GW501516 accounts in part for PPARδ agonist-induced improvement of insulin sensitivity in db/db mice. However, due to the limitation of single profiling analysis by GC–MS, a limited number of metabolites were analyzed in this study. Further metabolic profiling analysis using other analytical methods will be carried out in the future study to present a more comprehensive picture of metabolic changes in response to GW501516 treatment in diabetic mice. Nevertheless, the present results provide new evidence of additional mechanisms that participate in the beneficial metabolic effect of GW501516 to improve insulin sensitivity in diabetes and also highlight the potential of using PPARδ agonists for the treatment of diabetic metabolic dysfunction.
Declaration of competing interest
The authors report no declarations of completing interest.
Acknowledgments
This work was supported by Hong Kong Research Grants Council (No. C4024-16W), National Natural Science Foundation of China (No. 91939302), and Health and Medical Research Fund, Hong Kong Government (No. 05161746).
Figure 1
The effects of chronic treatment of db/db mice with PPARδ agonist GW501516 on (a) body weight, (b) fasting blood glucose level, (c) total blood triglyceride level, (d) oral glucose tolerance test (OGTT) and (e) insulin tolerance test (ITT). *P < 0.05. ****P < 0.0001.#P < 0.01. CC, db/m+ control; CP, db/m+ treated with GW501516; OC, db/db control; OP, db/db treated with GW501516. AUC, area under curve. Results are means±SEM, n =9.
Figure 2
GC-MS analysis of plasma samples. (a) PLS-DA score plot with red dots representing db/m+ non-diabetic mice (CC), green dots representing db/m+ mice treated with GW501516 (CP), dark blue dots representing db/db mice (OC), and light blue dots representing db/db mice treated with GW501516 (OP). (b) Cross validation of (a). (c) Volcano plot between OC and CC. (d) Heatmap of differentiated metabolites in CC, CP, OC and OP groups. (e) Pathway enrichment analysis of discriminated metabolites between OC and CC groups (generated from MetaboAnalyst 4.0). FC, fold change. Isoleu, isoleucine, Leu, leucine, 3-HB, 3-hydroxybutyric acid.

 DownLoad:

 下载:
下载:


