Figure 1.
N2 adsorption-desorption results of the samples
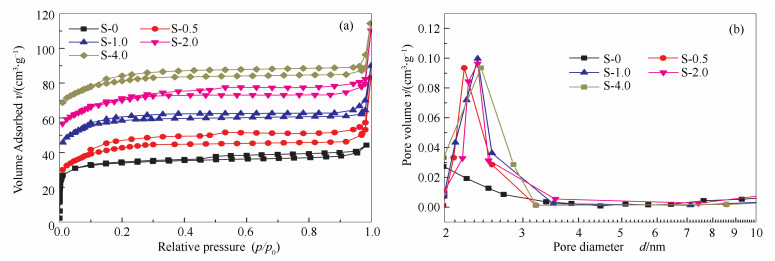
(a): isotherm curves at 77 K; (b): pore distribution of the samples
Enhanced activity and stability over hierarchical porous mordenite (MOR) for carbonylation of dimethyl ether: Influence of mesopores
Xiao-sheng WANG , Ran-jia LI , Chang-chun YU , Yu-xiang LIU , Chun-ming XU , Chun-xi LU

With the increasing pressure of energy demand, many countries are looking for clean alternative energy sources. The successful application of fuel ethanol in the United States and Brazil has shown that it can partially or completely replace gasoline[1, 2].To date, fuel ethanol production is still mainly based on fermentation of crops, which is not favorable in some countries whose crop yields are not high[3]. In addition to fermentation method, ethanol production via methanol or DME carbonylation has also been industrially used. In these processes, homogeneous catalysts are employed[4, 5]. To enhance the catalytic stability, iodine-containing additives are usually adopted, leading to corrosion of devices. Therefore, many researchers are looking for new methods for ethanol production.
In 2002, Volkova et al[6] found that the synthesis of methyl acetate via DME carbonylation reaction could be realized over heteropoly acid catalysts. In 2006, Cheung et al[7-10] realized the DME carbonylation reaction over MOR catalysts under mild conditions for the first time. Afterwards, it had been identified that the Brønsted acid sites located in the T3 position were the active sites for carbonylation reaction. Due to the narrow size of the 8 MR channels, reactants and products had to diffuse through the 12 MR channels to get contact with the active sites[11-14]. Now it had been widely acknowledged that the carbonylation performances of MOR catalysts were influenced both by the acid sites distribution and the mass transfer efficiency[15-18].
To improve the carbonylation performance of MOR catalysts, much effort had been laid on the enhancement of mass transfer efficiency. Xue et al[19] successfully shortened the diffusion path by synthesizing nano-MOR. He found that carbonylation performance over the nano-MOR was largely enhanced and coke deposition was inhibited. Yuan et al[20] improved the carbonylation performance over MOR by creating mesopores into the catalysts. Due to the greatly improved mass transfer efficiency, the carbonylation performance of the catalyst had been improved significantly.
In this manuscript, a series of hierarchical MOR catalysts were synthesized by adding different amount of PEG 1450 molecules as mesopore template. The effect of PEG molecules on the structure, acid sites distribution and mass transfer were characterized. Besides, the influence of mesopores on carbonylation performance and coke deposition were also discussed in detail.
of catalysts The synthesis procedure was the same as described in the reference[21]. During the synthesis process, the compositions of the gel obtained were kept constant as SiO2 :0.05 Al2O3 :0.25 Na2O :0.25 TEAOH :40 H2O for all the samples. To study the influence of t PEG molecules, PEG 1450 (Sinopharm Chemical Reagents, A.R.) was used and added to deionized water together with other reagents at the beginning of the synthesis process. The obtained samples were noted as S-x (x=0, 0.5, 1.0, 2.0, 4.0), where x represents the percentage of PEG in the gel.
XRD patterns were collected from a Bruker D8 Advance powder X-ray diffractometer using Cu-Kα radiation. The 2 θ values were in the range of 5°-40° at a scanning speed of 5(°)/min.
N2 adsorption experiments were performed on a Micromeritics ASAP 2020 system. Before testing, all samples were degassed at 90 ℃ (60 min) and 350 ℃ (6 h) under vacuum conditions.
The bulk phase SiO2/Al2O3 of the samples was determined by a Rigaku ZSX Primus II X-ray fluorescence (XRF) spectrometer using Rh radiation (operated at 150 mA and 60 kV). The morphology of the samples was observed by a SU8010 microscope (Hitachi).
The NH3-TPD (temperature-programmed desorption) profiles were collected from a Micromeritics AutoChem II 2920 instrument. 100 mg sample (particles in the range of 40-60 mesh) was used for each experiment. The samples were first treated by pure He (30 mL/min) at 500 ℃ for 2 h before NH3 adsorption at room temperature. Temperature-programmed desorption was carried out from room temperature to 700 ℃ at a heating speed of 10 K/min in He atmosphere (30 mL/min).
The FT-IR (Fourier transform-infrared) spectra after pyridine (Py) adsorption were performed on a Nicolet 6700 infrared spectrometer. The spectra were collected at 150 and 300 ℃ after evacuation of pyridine adsorption in a self-made in situ cell.
The FT-IR spectra in the-OH stretching vibration region were collected in the range of 3400-3800 cm-1 with a resolution of 1 cm-1 (Perkin Elmer Frontier infrared spectrometer). The FT-IR spectra were collected from self-supported wafers (around 30 mg sample powder used) and were acquired by averaging 64 scans after dehydration in pure Ar atmosphere (500 ℃, 30 min).
DME adsorption was carried out on a Mettler Toledo TGA/DSC 3+ thermogravimetric analyzer. The samples were first dehydrated by pure Ar (50 mL/min) at 500 ℃ for 1 h. After cooling down to 50 ℃, DME (5% diluted in Ar, 50 mL/min) was introduced into the system for adsorption. The weight increase ratio was recorded to determine the time taken for DME to reach saturation adsorption state.
TPO (temperature-programmed oxidation) measurements were performed on the above device as described in DME-TPD. Deactivated samples (100 mg) were installed in the quartz reactor and heated from 100 ℃ to 850 ℃ under 10% O2/He mixture atmosphere (30 mL/min). The heating speed was kept constant at 10 K/min.
The thermogravimetric curves of the deactivated catalysts were recorded on a TGA/DSC 3+ analyzer (Mettler Toledo). C.a. 15 mg sample was placed in the corundum crucible for each experiment, and the temperature was increased from 100 to 850 ℃ under an atmosphere of synthetic air (30 mL/min). The heating speed was kept constant at 10 K/min.
DME carbonylation reactions were performed on a fixed-bed reactor. During the test, 1.0 g H-MOR catalyst particles (20-40 mesh) were packed in the stainless-steel reactor and dehydrated by N2 (500 ℃, 2 h). After cooling down to below 100 ℃, the system was slowly pressurized to 2.0 MPa by feeding gas (2% DME diluted in CO). The temperature was slowly increased to 190 ℃ with a heating ramp of 2 ℃/min. The GHSV was maintained constant at 2000 h-1. An online GC system was used to analyze the effluent gas. When the DME conversion decreased to below 30%, the reaction was stopped and the reaction time was defined as the lifespan of the catalyst.
The structural properties of the samples were first examined by N2 adsorption-desorption at 77 K. The obtained results are given in Figure 1 and Table 1. The N2 adsorption curves all exhibit typical type I isotherms together with a H4-type hysteresis loop[22]. A certain amount of mesopores distributed at approximately 2.0-3.5 nm are formed on samples with PEG addition in the synthesis process, which directly confirms the introduction of mesopores into the catalysts. According to Table 1, the mesopore volumes in the samples are closely related to the PEG addition amount when the percentage of PEG molecules is less than 2% in the gel. However, both the surface area and the pore volume decrease on the S-4.0 sample. This may be ascribed to the partial structural destruction or collapse caused by the presence of excessive PEG molecules.
(a): isotherm curves at 77 K; (b): pore distribution of the samples
 下载:
导出CSV
下载:
导出CSV
| Sample | SiO2/Al2O3a | SBET /(m2·g-1) | vMib /(mL·g-1) | vMec /(mL·g-1) | vTd /(mL·g-1) |
| S-0 | 17.8 | 487.1 | 0.182 | 0.019 | 0.201 |
| S-0.5 | 18.1 | 490.9 | 0.179 | 0.027 | 0.206 |
| S-1.0 | 17.7 | 534.8 | 0.180 | 0.029 | 0.209 |
| S-2.0 | 17.9 | 527.4 | 0.181 | 0.032 | 0.213 |
| S-4.0 | 18.5 | 505.3 | 0.174 | 0.026 | 0.200 |
| a: determined by XRF; b: volume of micropores; c: volume of mesopores; d: total pore volumes | |||||
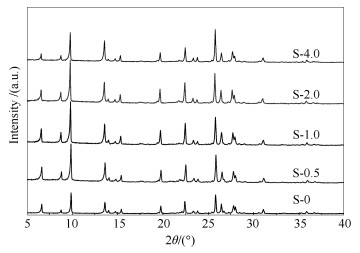
The X-ray diffraction patterns of the H-MOR catalysts are shown in Figure 2 and the SiO2/Al2O3 ratios of the samples are listed in Table 1. All samples exhibit typical MOR diffraction peaks, indicating that the crystal phases of the samples are not greatly influenced by the presence of PEG molecules[23]. The intensities of diffraction peaks show the same variation trend with the mesopore volumes. However, the peak intensities of the S-4.0 sample decrease greatly. This further verifies that excessive PEG molecules are not favorable for the synthesis of hierarchical mordenite. The SiO2/Al2O3 results also indicate that proper addition of PEG molecules can not greatly influence the structure of mordenite. Combining the XRD data with the N2 adsorption-desorption results, it can be concluded that proper amount of PEG molecules can effectively increase the amount of mesopores and increase the crystallinity of the MOR catalyst, while excessive PEG molecules are detrimental.
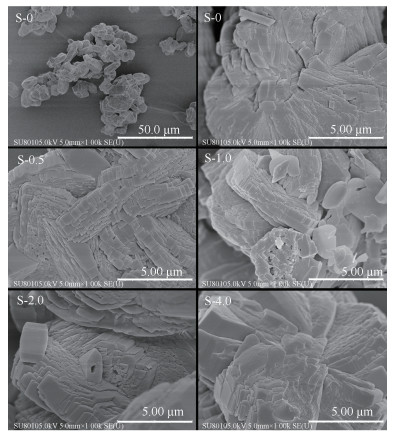
The morphologies of the samples are presented in Figure 3. The S-0 sample exhibits the morphology of discoidal or ellipsoid particles that are packed up by many flat sheets. The flat-sheet assembled morphology is largely maintained after the introduction of mesopores, indicating that the morphology of the MOR catalysts is not substantially influenced by the changes of the pore structure.
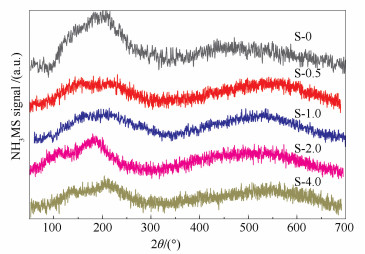
The acid sites distributions over the catalysts were characterized by NH3-TPD.
The obtained profiles are shown in Figure 4 and the corresponding acid site distributions are listed in Table 2[24]. The numbers of strong acid sites increase in S-0.5, S-1.0 and S-2.0 samples, indicating that the formation of strong acid sites is promoted by the mesopore templates. The numbers of weak acid sites only slightly decrease, while nearly half of the medium-strong acid sites lose. In comparison, all kinds of acid sites decrease on S-4.0 sample.
下载:
导出CSV
| Sample | NH3-TPD/(mmol·g-1) | |||
| weaka | medium-strongb | strongc | total | |
| S-0 | 0.16 | 0.46 | 0.38 | 1.01 |
| S-0.5 | 0.16 | 0.24 | 0.49 | 0.89 |
| S-1.0 | 0.15 | 0.28 | 0.52 | 0.95 |
| S-2.0 | 0.15 | 0.25 | 0.48 | 0.88 |
| S-4.0 | 0.07 | 0.20 | 0.35 | 0.62 |
| a: 40-150 ℃; b: 150-270 ℃; c: 270-700 ℃ | ||||
This can be ascribed to the partial destruction or collapse of the structure as depicted above. These results indicate that the PEG molecules can facilitate the incorporation of Al atoms into the strong acid sites and create mesopores during the crystallization process simultaneously.
The acid sites were further characterized by Py-FTIR. The obtained spectra are given in Figure 5 and the calculated results are listed in Table 3. Signals at 1545 and 1455 cm-1 are assigned to Brønsted and Lewis acid sites, respectively. As depicted by Grundner et al[25], pyridine molecules only have access to acid sites located inside the 12 MR channels (including those in the "side pockets" which are close to the 8 MR pore mouth). Therefore, the acid sites for the carbonylation reaction and those located in the mass transfer channels can be calculated by the Py-FTIR results. According to Figure 5(a) and Table 3, the total Brønsted acid sites decrease in samples with addition of PEG molecules (acid sites desorbed under 150 ℃ have little contribution to carbonylation reaction). The total Lewis acid sites decrease in S-0.5, S-1.0 and S-2.0 samples while they slightly increase in S-4.0 sample. This is consistent with results of NH3-TPD. However, the strong acid sites distributions of samples are quite different. According to Figure 5(b) and Table 3, the strong Brønsted acid sites increase in S-0.5, S-1.0 and S-2.0 samples and largely decrease in S-4.0 sample. This indicates that Al atoms are more preferred to enter into the strong acid sites due to the presence of PEG molecules. The increase of Lewis acid sites in S-4.0 sample can be ascribed to the partial structure collapse. This further demonstrates that excessive PEG molecules are detrimental to both the pore system and the acid site distribution.
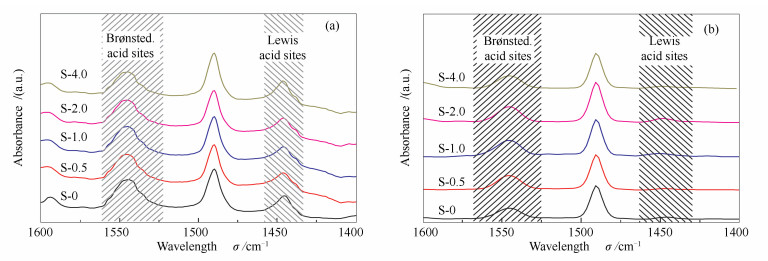
(a): Py desorbed at 150 ℃; (b): Py desorbed at 300 ℃
下载:
导出CSV
| Sample | Py-FTIR at 150 ℃ | Py-FTIR at 300 ℃ | OH-IR | |||||
| B acid sites/ (mmol·g-1) |
L acid sites/ (mmol·g-1) |
B acid sites/ (mmol·g-1) |
L acid sites/ (mmol·g-1) |
B acid in 12 MR1/ (a.u.) |
B acid in 8 MR2/ (a.u.) |
|||
| S-0 | 0.53 | 0.17 | 0.27 | 0.03 | 741 | 1506 | ||
| S-0.5 | 0.44 | 0.15 | 0.31 | 0.02 | 593 | 1215 | ||
| S-1.0 | 0.46 | 0.14 | 0.34 | 0.02 | 637 | 1367 | ||
| S-2.0 | 0.42 | 0.16 | 0.30 | 0.03 | 676 | 1461 | ||
| S-4.0 | 0.35 | 0.19 | 0.19 | 0.03 | 479 | 905 | ||
| 1: calculated from the OH-IR peak at 3610 cm-1; 2: calculated from the OH-IR peak at 3590 cm-1 | ||||||||
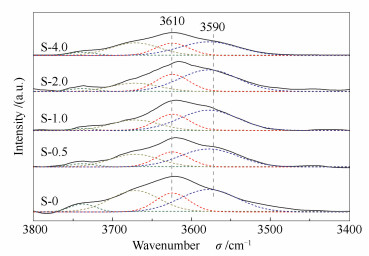
To investigate the distribution of Brønsted acid sites in 8 and 12 MR channels, the samples were subjected to OH-IR characterization. The obtained spectra are given in Figure 6 and the areas of the peaks are given in Table 3. As reported by Li et al[26-29], the FT-IR spectra in the -OH region could be deconvoluted into several bands (as shown in Figure 6) and the bands at 3590 and 3610 cm-1 could be attributed to Brønsted acid sites in 8 and 12 MR channels respectively. According to Figure 6 and Table 3, the amount of Brønsted acid sites in the 8 MR is always twice as large as that in the 12 MR channels. Besides, both the Brønsted acid sites in the 8 and 12 MR channels decrease in the hierarchical samples. Combined with the NH3-TPD and Py-IR results, this is largely attributed to the decrease of medium-strong acid sites.
To investigate the mass transfer efficiency over the samples, a thermogravimetric analyzer was used to record the weight variation by flowing DME into the system. Mass transfer efficiency could be represented by the time it took for adsorption equilibrium. The weight increase ratio curves are given in Figure 7. As mentioned above, DME can only diffuse through the 12 MR and mesopores, and be adsorbed on Brønsted acid sites. In addition, the total weight increase ratio of the samples is closely related to the quantity of Brønsted acid sites. Accordingly, the slope of the weight increase ratio curve is influenced by the mesopores and the acid sites distribution. From Figure 7, it is clear that the weights of the samples all gradually increase during the adsorption process and finally reach plateaus, which represent the state of saturated adsorption.
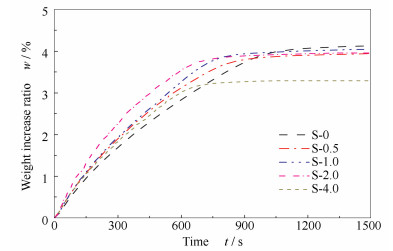
The S-0 sample exhibits a high adsorption amount due to the overall large quantity of acid sites. Unsurprisingly, samples with high quantity of mesopores and few acid sites in the 12 MR channels take less time to reach their plateau and exhibit steep slopes during the weight increase process. This means that the mass transfer efficiency in hierarchical samples is higher than that in S-0 sample. The enhanced mass transfer efficiency is attributed to the introduction of mesopores and the reduction of acid sites on the mass transfer channels.
The synthesized catalysts were subjected to the dimethyl ether carbonylation reaction. The results are given in Figure 8.
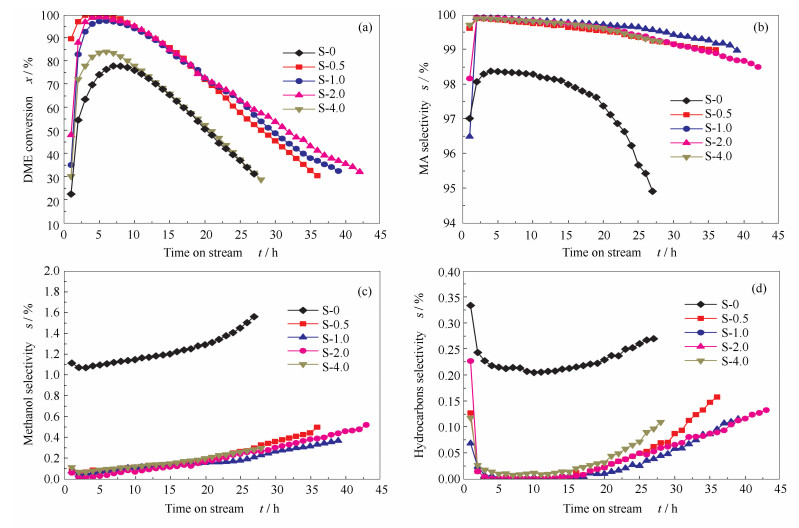
(reaction conditions: 1.5 MPa, 190 ℃, nDME/nCO=2 :98, GHSV=2000 h-1)
The DME conversions of the catalysts are shown in Figure 8(a). For S-0 sample, the DME conversion slowly increases to 75% after 7 h and then gradually declines. The lifespan of S-0 sample is 27 h. However, DME conversions and lifespans are largely increased for S-0.5, S-1.0 and S-2.0 samples. The introduction periods are shortened, and the highest DME conversions are all nearly 100% for these samples. The lifespans of these samples decrease in the following order: S-2.0 (43 h) > S-1.0 (40 h) > S-0.5 (37 h), which is consistent with the variation trend of mesopore volume in the catalyst. For S-4.0 sample, the highest DME conversion is 83%, and the lifespan is only 28 h. Among hierarchical MOR samples, S-4.0 sample has fastest deactivation rate and much shortest lifespan, and the deactivation rate and lifspan of S-4.0 are only slightly better than those of S-0.
It had been widely accepted that the DME carbonylation reaction was influenced by both the acid and structural properties[30-32]. According to the characterization results, both the acid sites and the mass transfer efficiency are affected by the PEG molecules. The mass transfer efficiency in the synthesized MOR catalysts is largely enhanced. The created mesopores can decrease the diffusion time or shorten the overall length of diffusion paths, which decrease the reduction time and enhance the reaction efficiency. In addition, the decrease of acid sites in the 12 MR channels also can reduce the mass transfer resistance to some extent. According to the results, the activities of the hierarchical samples are largely improved due to the enhanced mass transfer efficiency despite the decrease of Brønsted acid sites in the 8 MR channels. This suggests that the improvement of the mass transfer process has greater impact on the carbonylation reaction than the slight decrease of acid sites. However, excessive PEG molecules can destroy the structure of the MOR catalyst, which is not favorable for the improvement of DME conversion.
The MA selectivities of catalysts are shown in Figure 8(b). The MA selectivity of S-0 sample shows a volcano shape during the reaction process. The highest MA selectivity is 98.5%, and it decreases rapidly after 17 h. However, the MA selectivities of hierarchical MOR samples are all at notably higher level. Besides, the MA selectivity descent rates of hierarchical MOR samples are slow, which indicate that the stabilities of hierarchical samples are also improved.
The byproduct selectivities are given in Figure 8(c) and (d). Compared with S-0 sample, the selectivities of methanol and hydrocarbons decrease largely for hierarchical samples. Although their selectivities also slightly increase during the reaction process, the growth rates are very low. This implies that the side reactions over the hierarchical samples are inhibited to some extent.
As mentioned above, the 12 MR channels are the main locations for the side reactions and carbon deposition during the carbonylation process[33]. The side reactions and carbon deposition mainly derive from the reactants and products involved in the diffusion process[9, 34].
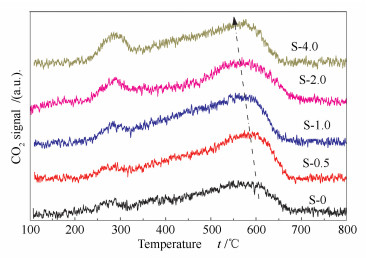
To investigate the coke deposition on the samples, the deactivated catalysts were characterized by the O2-TPO method. The obtained profiles are shown in Figure 9.
The signals can be separated into two parts: the low-temperature peak (100-350 ℃) and the high-temperature peak (higher than 350 ℃). The first peak is ascribed to the oxidation of adsorbed molecules and coke precursors while the second peak is attributed to coke deposition on the catalysts[35]. It can be seen that the areas of the first peak gradually increase along with the addition amount of PEG molecules. This indicates that more molecules are stacked inside the catalysts in samples with more mesopores. As mentioned above, the mass transfer resistance is largely reduced by the introduction of mesopores into the catalysts. In addition, the acid sites in the diffusion paths also decrease. So, the increase of the first peak in the TPO profile can be mainly ascribed to the stack of coke precursors. The high-temperature peaks are also different for these samples. The S-0 sample shows a broad peak in the range of 350-700 ℃ and the summit locates at 600 ℃. This indicates that the coke formed on the deactivated catalysts is polyaromatic or graphite-like hydrocarbons. Obviously, the areas of the second peak largely increase in the hierarchical samples. Despite the increase of peak area, the summits of the second peak also gradually shift towards the low temperature along with the addition amount of PEG molecules. The increase of the coke deposition can be ascribed to the increase of strong acid sites (especially Brønsted acid sites), which serves as the main sites for coke deposition in Mordenite catalysts[36]. As depicted by Xue et al[33, 36], the coke deposition inside the 12 MR channels could gradually condense and transform to polyaromatic or graphene-like hydrocarbons due to the space restriction effect. After the introduction of mesopores, the space restriction effect is weakened and the condensation degree of coke deposition decreases. Overall, it can be concluded that the coke deposition process is greatly influenced by the introduction of mesopores[20, 37, 38]. The condensation reaction of the coke precursors is largely inhibited.
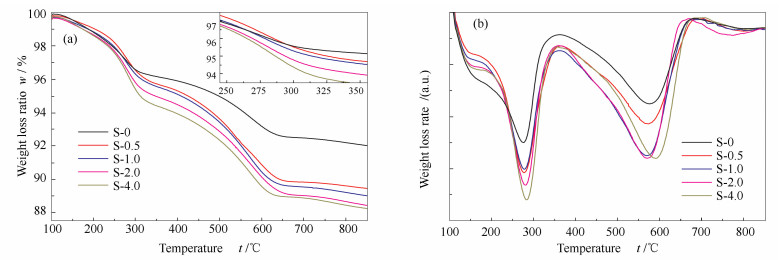
To further study the coke deposition on the samples, the deactivated catalysts were examined by TG-DTG. The obtained curves are shown in Figure 10.
The TG curves of the deactivated samples can be divided into three steps according to the DTG curve. According to the results obtained from O2-TPO, the first step at 100-350 ℃ is attributed to the desorption of molecules and oxidation of coke precursors. The weight loss ratio of the first step also increases with the mesopore volumes, which is consistent with the O2-TPO profiles. The weight loss ratio of the second step decreases sequentially in the following order: S-2.0 (6.1%) > S-1.0 (5.9%) > S-0.5 (5.8%) > S-4.0 (5.6%) > S-0 (3.6%). The above order is also consistent with the variation of the high-temperature CO2 peaks in Figure 9. In addition, the second valley in the DTG curves slightly shifts to the low-temperature direction; which is mutually validated with the O2-TPO characterization results in which the proportion of heavy coke deposition increases while the degree of inert heavy coke deposition decreases. These results further verify that the condensation degree of the coke deposition is limited by the enhanced mass transfer efficiency.
To summarize, hierarchical MOR catalysts were prepared using PEG molecules as mesopore templates. The effect of mesopores on the structure, acidity distribution and carbonylation performance were carefully studied. The crystallinity, specific surface areas and pore volumes are closely related to the mesopore volumes, while the crystal phase and morphology largely remain stable. In addition, the strong acid sites are promoted by the PEG molecules, although the numbers of weak and medium-strong acid sites decrease. The mass transfer efficiency is largely enhanced by the introduction of mesopores and the decrease of acid sites in the diffusion paths. However, the structure is partially destroyed or collapsed when excessive PEG molecules are used, which is detrimental for both the acid site distribution and mass transfer process.
The carbonylation performances and coke deposition are obviously affected. Both the DME conversion and MA selectivity are clearly improved over the hierarchical samples due to the shortened diffusion paths and the increased mass transfer efficiency. The side reactions are also inhibited due to the short residence time of the reactant molecules. The coke deposition capacity largely increases after the introduction of mesopores due to the increase of strong acid sites while the condensation degree of coke deposition over the hierarchical samples decreases. However, the DME conversion largely decreases over the sample in which excessive PEG molecules are used, indicating that there is an optimum dosage of mesopore templates.
MAYER F D, FERIS L A, MARCILIO N R, HOFFMANN R. Why small-scale fuel ethanol production in Brazil does not take off[J]. Renewable Sustainable Energy Rev, 2015, 43: 687-701. doi: 10.1016/j.rser.2014.11.076
BAEYENS J, KANG Q, APPELS L, DEWIL R, LV Y, TAN T. Challenges and opportunities in improving the production of bio-ethanol[J]. Prog Energy Combust Sci, 2015, 47: 60-88. doi: 10.1016/j.pecs.2014.10.003
HOCHMAN G, ZILBERMAN D. Corn ethanol and US biofuel policy 10 years later:A quantitative assessment[J]. Am J Agr Econ, 2018, 100(2): 570-584. doi: 10.1093/ajae/aax105
VARSHAVSKY Y S, CHERKASOVA T G. Remarks on the process of homogeneous carbonylation of rhodium compounds by N, N-dimethylformamide[J]. J Organomet Chem, 2007, 692(4): 887-893. doi: 10.1016/j.jorganchem.2006.10.040
THOMAS C M, MAFUA R, THERRIEN B, RUSANOV E, STOEECKLI-EVANS H, SVSS-FINK G. New diphosphine ligands containing ethyleneglycol and amino alcohol spacers for the rhodium-catalyzed carbonylation of methanol[J]. Chem-A European J, 2002, 8(15): 3343-3352. doi: 10.1002/1521-3765(20020802)8:15<3343::AID-CHEM3343>3.0.CO;2-Z
VOLKOVA G G, PLYASOVA L M, SALANOV A N, KUSTOVA G N, YURIEVA T M, LIKHOLOBOV V A. Heterogeneous catalysts for halide-free carbonylation of dimethyl ether[J]. Catal Lett, 2002, 80(3): 175-179.
CHEUNG P, BHAN A, SUNLEY G J, IGLESIA E. Selective carbonylation of dimethyl ether to methyl acetate catalyzed by acidic zeolites[J]. Angew Chem-Int Ed, 2006, 45(10): 1617-1620. doi: 10.1002/anie.200503898
BHAN A, ALLIAN A D, SUNLEY G J, LAW D J, IGLESIA E. Specificity of sites within eight-membered ring zeolite channels for carbonylation of methyls to acetyls[J]. J Am Chem Soc, 2007, 129(16): 4919-4924. doi: 10.1021/ja070094d
CHEUNG P, BHAN A, SUNLEY G J, LAW D J, IGLESIA E. Site requirements and elementary steps in dimethyl ether carbonylation catalyzed by acidic zeolites[J]. J Catal, 2007, 245(1): 110-123.
BHAN A, IGLESIA E. A link between reactivity and local structure in acid catalysis on zeolites[J]. Acc Chem Res, 2008, 41(4): 559-567. doi: 10.1021/ar700181t
SAN X G, ZHANG Y, SHEN W J, TSUBAKI N. New synthesis method of ethanol from dimethyl ether with a synergic effect between the zeolite catalyst and metallic catalyst[J]. Energy Fuels, 2009, 23: 2843-2844. doi: 10.1021/ef900080g
ZHANG Y, SAN X G, TSUBAKI N, TAN Y S, CHEN J. Novel ethanol synthesis method via C1 chemicals without any agriculture feedstocks[J]. Ind Eng Chem Res, 2010, 49(11): 5485-5488. doi: 10.1021/ie901882s
LI X A, SAN X G, ZHANG Y, ICHII T, MENG M, TAN Y S, TSUBAKI N. Direct synthesis of ethanol from dimethyl ether and syngas over combined H-mordenite and Cu/ZnO catalysts[J]. ChemSusChem, 2010, 3(10): 1192-1199. doi: 10.1002/cssc.201000109
YANG G H, SAN X G, JIANG N, TANAKA Y, LI X G, JIN Q, TAO K, MENG F Z, TSUBAKI N. A new method of ethanol synthesis from dimethyl ether and syngas in a sequential dual bed reactor with the modified zeolite and Cu/ZnO catalysts[J]. Catal Today, 2011, 164(1): 425-428. doi: 10.1016/j.cattod.2010.10.027
XUE H F, HUANG , X , ZHAN E, MA M, SHEN W J. Selective dealumination of mordenite for enhancing its stability in dimethyl ether carbonylation[J]. Catal Commun, 2013, 37: 75-79. doi: 10.1016/j.catcom.2013.03.033
LIU J, XUE H, HUANG X, WU P H, HUANG S J, LIU S B, SHEN W. Stability enhancement of H-mordenite in dimethyl ether carbonylation to methyl acetate by pre-adsorption of pyridine[J]. Chin J Catal, 2010, 31(7): 729-738. doi: 10.1016/S1872-2067(09)60081-4
REULE A A C, PRASAD V, SEMAGINA N. Effect of Cu and Zn ion-exchange locations on mordenite performance in dimethyl ether carbonylation[J]. Microporous Mesoporous Mater, 2018, 263: 220-230. doi: 10.1016/j.micromeso.2017.12.026
JIA X, KHAN W, WU Z, CHOI J, YIP A C K. Modern synthesis strategies for hierarchical zeolites:Bottom-up versus top-down strategies[J]. Adv Powder Technol, 2019, 30(3): 467-484. doi: 10.1016/j.apt.2018.12.014
XUE H F, HUANG X, DITZEL E, ZHAN E S, MA M, SHEN W J. Dimethyl ether carbonylation to methyl acetate over nanosized mordenites[J]. Ind Eng Chem Res, 2013, 52(33): 11510-11515. doi: 10.1021/ie400909u
YU AN, Y Y, WANG L, LIU H, TIAN P, YANG M, XU S T, LIU Z M. Facile preparation of nanocrystal-assembled hierarchical mordenite zeolites with remarkable catalytic performance[J]. Chin J Catal, 2015, 36(11): 1910-1919. doi: 10.1016/S1872-2067(15)60960-3
WANG X S, LI R J, YU C C, LIU Y X, ZHANG L Y, XU C M, ZHOU H. Enhancing the dimethyl ether carbonylation performance over mordenite catalysts by simple alkaline treatment[J]. Fuel, 2019, 239: 794-803. doi: 10.1016/j.fuel.2018.10.147
ALY H M, MOUSTAFA M E, ABDELRAHMAN E A. Synthesis of mordenite zeolite in absence of organic template[J]. Adv Powder Technol, 2012, 23(6): 757-760. doi: 10.1016/j.apt.2011.10.003
IDRIS A, KHALIL U, ABDULAZIZ I, MAKERTIHARTHA I G, SUBAGJO , LANIWATI M, AL-BETAR A R, MUKTI R R, MURAZA O. Fabrication zone of OSDA-free and seed-free mordenite crystals[J]. Powder Technol, 2019, 342: 992-997. doi: 10.1016/j.powtec.2018.09.041
LÓNYI F, VALYON J. On the interpretation of the NH3-TPD patterns of H-ZSM-5 and H-mordenite[J]. Microporous Mesoporous Mater, 2001, 47(2): 293-301.
GRUNDNER S, MARKOVITS M A, LI G, TROMP M, PIDKO E A, HENSEN E J, JENTYS A, SANCHEZ-SANCHEZ M, LERCHER J A. Single-site trinuclear copper oxygen clusters in mordenite for selective conversion of methane to methanol[J]. Nat Commun, 2015, 6: 7546. doi: 10.1038/ncomms8546
CHENG Z Z, HUANG S Y, LI Y, CAI K, YAO D W, LV J, WANG S P, MA X B. Carbonylation of dimethyl ether over MOR and Cu/H-MOR catalysts:Comparative investigation of deactivation behavior[J]. Appl Catal A:Gen, 2019, 576: 1-10. doi: 10.1016/j.apcata.2019.02.032
LI Y, LI Z, HUANG S, CAI K, QU Z, ZHANG J, WANG Y, MA X. Morphology-dependent catalytic performance of mordenite in carbonylation of dimethyl ether:Enhanced activity with high c/b ratio[J]. ACS Appl Mater Interfaces, 2019, 11(27): 24000-24005. doi: 10.1021/acsami.9b03588
ZHAO N, TIAN Y, ZHANG L, CHENG Q, LYU S, DING T, HU Z, MA X, LI X. Spacial hindrance induced recovery of over-poisoned active acid sites in pyridine-modified H-mordenite for dimethyl ether carbonylation[J]. Chin J Catal, 2019, 40(6): 895-904. doi: 10.1016/S1872-2067(19)63335-8
ZHAO N, CHENG Q, LYU S, GUO L, TIAN Y, DING T, XU J, MA X, LI X. Promoting dimethyl ether carbonylation over hot-water pretreated H-mordenite[J]. Catal Today, 2020, 339: 86-92. doi: 10.1016/j.cattod.2019.01.013
GOUNDER R, IGLESIA E. Catalytic consequences of spatial constraints and acid site location for monomolecular alkane activation on zeolites[J]. J Am Chem Soc, 2009, 131(5): 1958-1971. doi: 10.1021/ja808292c
BORONAT M, MARTÍNEZ-SÁNCHEZ C, LAW D, CORMA A. Enzyme-like specificity in zeolites:A unique site position in mordenite for selective carbonylation of methanol and dimethyl ether with CO[J]. J Am Chem Soc, 2008, 130(48): 16316-16323. doi: 10.1021/ja805607m
BORONAT M, MARTINEZ C, CORMA A. Mechanistic differences between methanol and dimethyl ether carbonylation in side pockets and large channels of mordenite[J]. Phys Chem Chem Phys, 2011, 13(7): 2603-2612. doi: 10.1039/c0cp01996h
XUE H, HUANG X, DITZEL E, ZHAN E, MA M, SHEN W. Coking on micrometer-and nanometer-sized mordenite during dimethyl ether carbonylation to methyl acetate[J]. Chin J Catal, 2013, 34(8): 1496-1503. doi: 10.1016/S1872-2067(12)60607-X
ZHOU H, ZHU W, SHI L, LIU H, LIU S, NI Y, LIU Y, HE Y, XU S, LI L, LIU Z. In situ DRIFT study of dimethyl ether carbonylation to methyl acetate on H-mordenite[J]. J Mol Catal A:Chem, 2016, 417: 1-9. doi: 10.1016/j.molcata.2016.02.032
WANG X S, LI R J, YU C C. ZHANG L, XU C M, ZHOU H. Dimethyl ether carbonylation over nanosheet-assembled hierarchical mordenite[J]. Microporous Mesoporous Mater, 2019, 274: 227-235.
CHAOUATI N, SOUALAH A, CHATER M, TARIGHI M, PINARD L. Mechanisms of coke growth on mordenite zeolite[J]. J Catal, 2016, 344: 354-364. doi: 10.1016/j.jcat.2016.10.011
REULE A C, SAWADA J A, SEMAGINA N. Effect of selective 4-membered ring dealumination on mordenite-catalyzed dimethyl ether carbonylation[J]. J Catal, 2017, 349: 98-109. doi: 10.1016/j.jcat.2017.03.010
LI Y, SUN C, FAN W, WANG Y, LAN A, HAN P, LI X, DOU T. One-pot synthesis of hierarchical mordenite and its performance in the benzylation of benzene with benzyl alcohol[J]. J Mater Sci, 2015, 50(14): 5059-5067. doi: 10.1007/s10853-015-9055-4

Figure 1 N2 adsorption-desorption results of the samples
(a): isotherm curves at 77 K; (b): pore distribution of the samples

Figure 5 Py-FTIR spectra of the MOR samples
(a): Py desorbed at 150 ℃; (b): Py desorbed at 300 ℃

Figure 7 Weight increase ratio curves of the samples during the DME adsorption process at 50 ℃

Figure 8 DME conversions of the MOR catalysts
(reaction conditions: 1.5 MPa, 190 ℃, nDME/nCO=2 :98, GHSV=2000 h-1)
Table 1. Structural properties of the hierarchical MOR samples
| Sample | SiO2/Al2O3a | SBET /(m2·g-1) | vMib /(mL·g-1) | vMec /(mL·g-1) | vTd /(mL·g-1) |
| S-0 | 17.8 | 487.1 | 0.182 | 0.019 | 0.201 |
| S-0.5 | 18.1 | 490.9 | 0.179 | 0.027 | 0.206 |
| S-1.0 | 17.7 | 534.8 | 0.180 | 0.029 | 0.209 |
| S-2.0 | 17.9 | 527.4 | 0.181 | 0.032 | 0.213 |
| S-4.0 | 18.5 | 505.3 | 0.174 | 0.026 | 0.200 |
| a: determined by XRF; b: volume of micropores; c: volume of mesopores; d: total pore volumes | |||||
 下载: 导出CSV
Table 2. Distribution of acid sites over the MOR samples
| Sample | NH3-TPD/(mmol·g-1) | |||
| weaka | medium-strongb | strongc | total | |
| S-0 | 0.16 | 0.46 | 0.38 | 1.01 |
| S-0.5 | 0.16 | 0.24 | 0.49 | 0.89 |
| S-1.0 | 0.15 | 0.28 | 0.52 | 0.95 |
| S-2.0 | 0.15 | 0.25 | 0.48 | 0.88 |
| S-4.0 | 0.07 | 0.20 | 0.35 | 0.62 |
| a: 40-150 ℃; b: 150-270 ℃; c: 270-700 ℃ | ||||
下载: 导出CSV
Table 3. Distribution of acid sites over the MOR samples
| Sample | Py-FTIR at 150 ℃ | Py-FTIR at 300 ℃ | OH-IR | |||||
| B acid sites/ (mmol·g-1) |
L acid sites/ (mmol·g-1) |
B acid sites/ (mmol·g-1) |
L acid sites/ (mmol·g-1) |
B acid in 12 MR1/ (a.u.) |
B acid in 8 MR2/ (a.u.) |
|||
| S-0 | 0.53 | 0.17 | 0.27 | 0.03 | 741 | 1506 | ||
| S-0.5 | 0.44 | 0.15 | 0.31 | 0.02 | 593 | 1215 | ||
| S-1.0 | 0.46 | 0.14 | 0.34 | 0.02 | 637 | 1367 | ||
| S-2.0 | 0.42 | 0.16 | 0.30 | 0.03 | 676 | 1461 | ||
| S-4.0 | 0.35 | 0.19 | 0.19 | 0.03 | 479 | 905 | ||
| 1: calculated from the OH-IR peak at 3610 cm-1; 2: calculated from the OH-IR peak at 3590 cm-1 | ||||||||
下载: 导出CSV

 扫一扫看文章

扫一扫关注我们