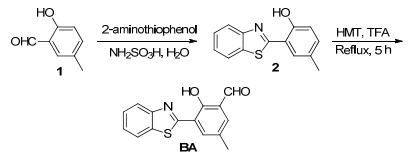
Scheme 1.
Synthesis process of the target BA
A Benzothiazole-Based Ratiometric Fluorescent Probe for Highly Selective Detection of Homocysteine and Its Bioimaging Application
Youming Shen , Biao Gu , Xin Liu , Yucai Tang , Haitao Li

Intracellular biothiols, such as cysteine (Cys), homocysteine (Hcy) and glutathione (GSH), serve crucial roles in biological systems. However, abnormal levels of these biothiols will lead to the occurrence of various diseases.[1] Particularly, elevated Hcy in the blood (> 12 µmol/L) has been regarded as an important index for cardiovascular and Alzheimer's disease, osteoporosis, neutral tube defects, inflammatory bowel disease and pregnancy complica- tions.[2] Thus, developing accurate and reliable technologies for Hcy detection in biological systems is particularly significant and highly desirable.
Over the last decade, several analytical techniques have been reported for the analysis of biothiols, including electrochemical assay, [3] mass spectrometry, [4] colorimetric method, [5] capillary electrophoresis[6] and high-perfor- mance liquid chromatography.[7] However, the mentioned methods are generally time-consuming and require expensive instrumentation. Besides, they rely on ex vivo post-mortem processing and involve tissue disruption and cell lyses, which is unsuitable for the in-situ detection of Hcy in living systems. In comparison, fluorescence probe techniques are more convenient and efficient for sensing and imaging biomolecules because of their unique advantages including convenience, noninvasiveness, high sensitivity, good selectivity, and high spatiotemporal resolution.[8-9] Given this, various fluorescent probes have been constructed for the selective detection of biothiols.[10-16] However, most of the reported fluorescent probes are unable to discriminate Hcy from Cys and GSH owing to the similarity in structures and reactivities, which greatly restricts their practical application. Up till now, only a few fluorescent probes have been described for specific detecting Hcy.[17-20] Nevertheless, these probes respond to Hcy with changes in the absolute intensity of one band, and the accuracy of quantitative detection was easily influenced by environmental effects, probe concentrations and instrument factors. Fortunately, these problems can be solved by the use of ratiometric fluorescent probes, which could provide an inherent reliability resulting from its effective self-calib- ration advantage by monitoring the emission intensities at two different bands. However, to date, Hcyspecific ratiometric fluorescent probes are extremely scarce.[21] Consequently, it is still urgently demanded to engineer ratiometric fluorescent probes for specific detection of Hcy over Cys and GSH, in particular, which can be employed to selectively visualize Hcy in biological samples.
In the present study, we designed and prepared a ratiometric fluorescent probe, 3-(benzo[d]thiazol-2-yl)-2- hydroxy-5-methylbenzal-dehyde (BA), for specific detection of Hcy. The probe consisted of a 2-(2'-hydroxyphenyl) benzothiazole (HBT) derivative as the fluorescence signaling unit and a salicyldehyde functionality as the recognition receptor. The rational design approach is as follows. First, HBT is a kind of well-known excited state intramolecular photon transfer (ESIPT) fluorophore and possesses many salient properties, such as its dual emission, large Stokes shift, good photostability and ease of synthetic modification, [22] which is widely used for constructing ratiometric fluorescent probe. Second, Cys/Hcy reacts with aldehyde group to generate a 5- or 6-membered ring (thiazolidine/thiazine ring) while other biothiols like GSH cannot form the ring, [23-24] which might obviate the disturbances from GSH. Third, due to the different substituent effects in the molecule of HBT dye, [25-26] Cys-derived thiazolidine and Hcy-derived thiazinane rings may exert disparate functions on ESIPT behavior and result in distinct fluorescence changes, which would make the selective detection of Hcy possible. To our delight, the probe BA displayed a significant ratiometric fluorescent response to Hcy with high selectivity over other analytes including Cys and GSH. Most importantly, it can be used to image intracellular Hcy with clearly separated signals.
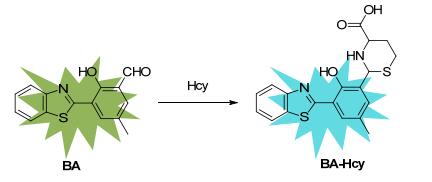
As displayed in Scheme 1, BA could be easily prepared via a two-step reaction from commercially available 5-methylsalicylaldehyde (1). Initially, condensation of 1 with 2-aminobenzenethiol resulted in compound 2. The formylation of 2 via Duff's reaction afforded the desired product with high yields (81%). The intermediate and product were confirmed by 1H NMR, 13C NMR, ESI-MS and ESI-HRMS spectra. The high-resolution mass spectrum showed a major peak at m/z 268.0522 corresponding to BA (calculated for C15H10NO2S: 268.0438), which suggests that the target compound is successfully synthesized.
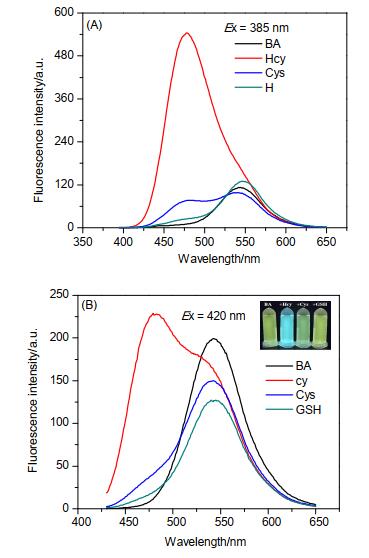
To explore the sensing ability of the newly synthesized probe, the fluorescence spectra of BA incubated with different biothiols (Hcy, Cys and GSH) were examined by using two different excitations at 385 and 420 nm, respectively. Firstly, the excitation wavelength of 385 nm (the best excitation wavelength for BA+Hcy) was used to check the fluorescence response of BA toward biothiols. As illustrated in Figure 1A, addition of Hcy to the BA solution triggered a remarkable fluorescence enhancement at 478 nm with 66 nm blue-shift compared to that of BA (λem=544 nm). Under the same conditions, the fluorescence enhancements caused by Cys and GSH were much weaker. Specifically, addition of Hcy, Cys and GSH led to 53-, 7- and 2-fold enhancement, respectively, indicating that BA is highly selective for Hcy over Cys and GSH. Subsequently, the wavelength at 420 nm was selected as the excitation wavelength of the testing system, which near the isosbestic point of the excitation spectra of BA and BA+Hcy. As illustrated in Figure 1B, introduction of Hcy to the BA solution led to the decrease of the initial emission band at 544 nm accompanied with the emergence of a new emission band at 478 nm. The dual emissions can be used for the ratiometric fluorescent analysis, because the intensity ratio of new emission band to initial emission band can provide a built-in correction and thus make the analysis results more accurate. Meanwhile, the color of the BA solution with addition of Hcy changed from green to blue with UV lamp irradiation (365 nm) (Figure 1B, inset), which further supports the substantial ratiometric fluorescence response. Notably, addition of Cys and GSH did not lead to obvious ratiometric changes. The fluorescence quantum yields of BA (10 µmol/L) before and after the addition of Hcy (1.0 mmol/L) were measured to be 0.52 and 0.71, respectively. These results clearly demonstrate that BA is able to discriminate Hcy from Cys and GSH, and can detect Hcy through a ratiometric fluorescence method.
(A) λex=385 nm; (B) λex=420 nm. Inset: the color changes of BA in the absent and present of Hcy/Cys/GSH under the observation of 365 nm UV light
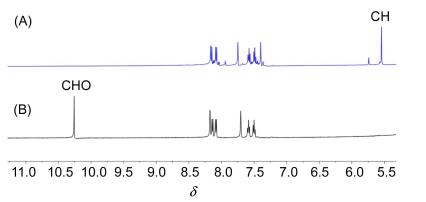
The ratiometric fluorescence change of BA in the presence of Hcy suggested the generation of BA-Hcy adduct. To confirm the recognition process, the 1H NMR spectra of BA before and after the addition of Hcy were tested. As depicted in Figure 2, BA exhibited a characteristic aldehyde proton signal at δ 10.26. With the addition of Hcy to BA, the aldehyde proton signal disappeared, while a set of new peaks at δ 5.55 and 5.74 corresponding to the thiazinane methine proton appeared, and the aromatic protons in benzothiazole showed a significant upfield shift, indicating that the recognition of Hcy with the probe is indeed through the well-known cyclization of Hcy with the aldehyde group to form the 6-membered thiazinane adduct. Another solid evidence for the formation of the thiazinane adduct came from high resolution mass spectrum. On a basis of the above results, a possible recognition mechanism of BA for Hcy was depicted in Scheme 2.
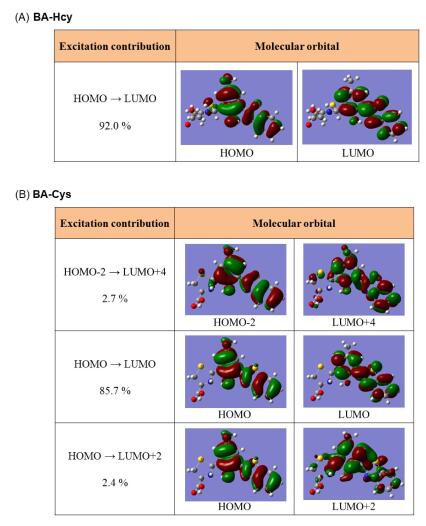
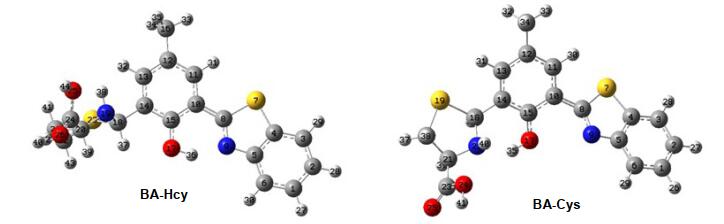
To better understand the distinct fluorescence responses of BA toward Hcy and Cys, the corresponding heterocyclic adducts, BA-Hcy and BA-Cys were examined by time-dependent density function theory (TD-DFT) calculations using Gaussian09 program with a B3LYP 6-31+G(d) basis set.[28] The optimized geometries and the molecular orbital plots of BA-Hcy and BA-Cys were presented in Figures 3 and 4. The main contribution transition of BA-Hcy for the S0→S1 energy state stemmed from HOMO→LUMO (ca. 92%), which is responsible for its strong fluorescence. In the case of BA-Cys, three contribution transitions to its excited state were found. Among them, HOMO-2→LUMO+4 (ca. 2.7%) and HOMO→LUMO+2 (ca. 2.4%) transition involves photo-induced electron transfer (PET) process, which may lead to the fluorescence weakening of BA-Cys adduct. Therefore, this factor might be accountable for the much higher fluorescence efficiency of BA-Hcy over that of BA-Cys.
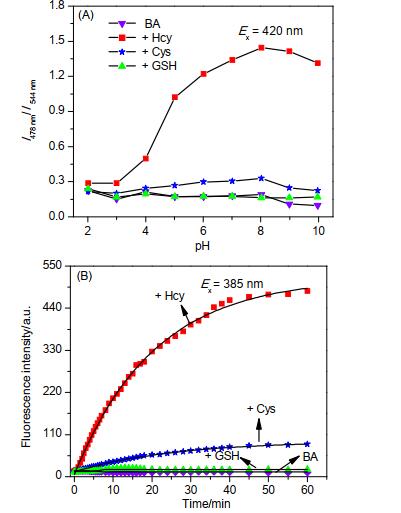
The effect of pH on the recognition performance of BA toward biothiols was studied. As shown in Figure 5A, free probe BA was pretty stable over the entire pH range. Moreover, satisfactory Hcy-sensing abilities were found in pH range of 6.0~9.0, which indicated that BA could be used in physiological conditions. In consideration of the further bioimaging applications of BA, a PBS buffer (pH 7.4) was thus chosen as the test medium in this work. The time course of fluorescence intensity of BA in the absence or presence of biothiols was investigated, and the results were displayed in Figure 5B. It could be seen that the interaction between BA and Hcy was completed within 45 min with a larger fluorescence change and a better selectivity over Cys and GSH. Thus, 45 min was selected as the optimized incubation time for the quantification of Hcy.
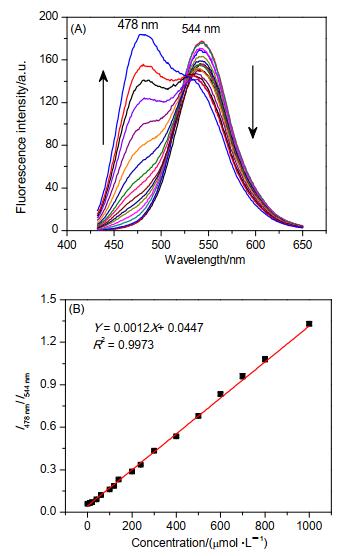
Under optimal experimental conditions, the fluorescence titration experiments were carried out. With the increasing addition of Hcy to the BA solution, the fluorescence intensity (I478 nm) was gradually increased when the testing system was excited with the short wavelength at 385 nm. The fluorescence intensity (I478 nm) was linearly related to the concentrations of Hcy, ranging from 0 to 0.3 mmol/L. The detection limit of Hcy (3σ/k)[27] by probe BA was estimated to be 0.7 µmol/L. Furthermore, under the excitation at 420 nm, a good ratiometric emission profiles can be obtained. As shown in Figure 6A, the emission band at 478 nm enhanced gradually with increasing Hcy concentration while the other emission band at 544 nm accordingly declined. There was a good linearity between the fluorescence intensity ratio (I478 nm/I544 nm) and the concentration of Hcy from 0 to 1.0 mmol/L (Figure 6B). And the corresponding detection limit was determined to be 1.6 µmol/L. The above results implied that probe BA could be employed for the quantitative detection of Hcy concentrations.
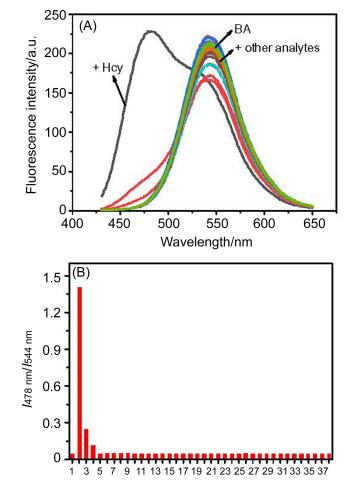
To assess the selectivity of BA for Hcy, the fluorescence spectra of BA incubated with a variety of biological-related species were measured, including amino acids (Hcy, Cys, GSH, Ser, Gly, Ala, Leu, Val, Arg, Asn, Vc), common anions (NO3-, CH3COO-, I-, SCN-, H2PO4-, Cl-, NO2-), common cations (Al3+, K+, Fe2+, Ca2+, Zn2+, Fe3+, Cu2+, Na+, Ni2+), and reactive oxygen/sulfur/nitrogen species (H2O2, ClO-, •OH, O2-, S2-, SO32-, S2O32-, S2O42-, S2O52- NO). As shown in Figure 7, only introduction of Hcy led to a distinct blue-shifted emission with a large fluorescent enhancement at 458 nm, whereas other analytes did not produce similar change to the fluorescence spectra of BA. These results revealed that BA could be used as a promising ratiometric fluorescence probe for selective detection of Hcy in biological sysems.
(1) BA only; (2) Hcy; (3) Cys; (4) GSH; (5) Ser; (6) Gly; (7) Ala; (8) Leu; (9) Val; (10) Arg; (11) Asn; (12) Vc; (13)NO3-; (14) CH3COO-; (15) I-; (16) SCN-; (17)H2PO4-; (18) Cl-; (19)NO2-; (20) Al3+; (21) K+; (22) Fe2+; (23) Ca2+; (24) Zn2+; (25) Fe3+; (26) Cu2+; (27) Na+; (28) Ni2+ (29) H2O2; (30) ClO-; (31) •OH; (32) O2-; (33) S2-; (34)SO32-; (35) S2O32-; (36) S2O42-; (37) S2O52-; (38) NO. λex=420 nm
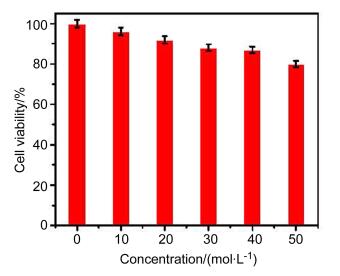
Encouraged by the excellent sensing properties of BA in vitro, the capability of the probe to image Hcy in living cells was investigated through confocal microscopy. Before the bioimaging applications, the cytotoxicity of BA to HeLa cells was evaluated through conventional methyl thiazolyl tetrazolium (MTT) assays. As shown in Figure 8, no significant decline in cell viability could be observed when the cells were incubated with increasing concentrations of BA (0~50 μmol/L) for as long as 24 h, demonstrating that BA is very low cytotoxicity to cultured cells and is suitable for fluorescence imaging. As displayed in Figure 9, when HeLa cells were stained with BA (10 μmol/L) in culture medium for 45 min, the fluorescence in the blue (A2) and green (A3) channels were observed simultaneously, indicating that BA is responsive to intracellular Hcy. In control experiment, when HeLa cells were precultured with N-ethylmaleimide (NEM) (0.5 mmol/L) for 30 min to consume the endogenously produced thiols, and then stained with BA (10 μmol/L) for 45 min, the fluorescence in the blue channel disappeared (B2). Furthermore, when the NEM-treated cells were incubated with Hcy (100 μmol/L) for 30 min and further incubated with BA (10 μmol/L) for 45 min, a brighter blue fluorescence (C2) was found. The results suggested that BA could be used to visualize intracellular Hcy in a dual-color manner.
The cell viability was observed via MTT assay
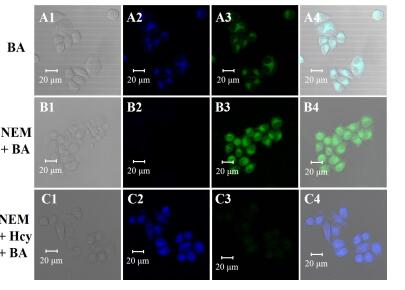
Cells A1~A4 were stained with BA (10 μmol/L) for 45 min. Cells B1~B4 were precultured with NEM (500 μmol/L) for 30 min and then stained with BA (10 μmol/L) for 45 min. Cells C1~C4 were precultured with NEM (0.5 mmol/L) for 30 min, incubated with Hcy (100 μmol/L) for 30 min and then stained with BA (10 μmol/L) for 45 min. A1, B1 and C1: bright field; A2, B2 and C2: blue channel (415~490 nm); A3, B3 and C3: green channel (520~600 nm); A4, B4 and C4: overlay of blue, green channel and bright field. Scale bar=20 μmol/L
Probe BA possessed enormous advantages including ratiometric fluorescent measurement for Hcy, visible-light excitation, high sensitivity and selectivity, fast response, and ratiometric imaging of the intracellular Hcy with good cell permeability and low cytotoxicity. These unique properties of BA make it to be a promising tool for studying the biological functions of Hcy in living systems.
In conclusion, a Hcy-selective ratiometric fluorescent probe (BA) was designed and synthesized by using HBT moiety as the fluorophore and salicyldehyde functionality as the recognition unit. This probe showed favorable properties including a ratiometric fluorescent measurement for Hcy, excellent sensitivity, high selectivity and low cytotoxicity. Furthermore, probe BA was successfully applied for the ratiometric imaging of the intracellular Hcy with good cellular uptake. It thus provides a promising approach for studying the effects of Hcy in biological systems and holds great potential in biological applications.
2-Aminobenzenethiol, hexamethylenetetramine (HMT), 5-methylsalicylaldehyde and trifluoroacetic acid (TFA) were received from Aladdin Reagent. All other chemicals and reagents were of analytical grade and obtained from commercial channels. 1H NMR (500 MHz) and 13C NMR (126 MHz) spectra were measured on a Bruker AVANCE- 500M spectrometer (tetramethyl silane as internal standard). ESI-HRMS were recorded on a Brucker APEX IV (7.0 T) FTMS. Twice-distilled water used in this work was gained through an ELGA LabWater System. UV-Vis spectra were measured on a Shimadzu UV-2501PC spectrophotometer. The data of fluorescence was recorded at room temperature with a Shimadzu RF-5301PC luminescence spectrometer.
A mixture of 2-aminobenzenethiol (0.6260 g, 5.0 mmol) and 5-methylsalicylaldehyde (0.6808 g, 5.0 mmol) in 30 mL of distilled water was added into sulfamic acid (0.0243 g, 0.25 mmol). Then, the mixture solution was stirred at room temperature for 5 h. The resultant solid was filtered, washed with distilled water and dried to give compound 2 as a white solid (0.9857 g, 82% yield). m.p. 127~128 ℃ (lit.[29] m.p. 127~128 ℃); 1H NMR (500 MHz, CDCl3) δ: 8.00 (d, J=8.1 Hz, 1H), 7.90 (d, J=8.0 Hz, 1H), 7.54~7.45 (m, 2H), 7.41 (t, J=7.6 Hz, 1H), 7.18 (d, J=7.1 Hz, 1H), 7.01 (d, J=8.4 Hz, 1H), 2.35 (s, 3H); 13C NMR (126 MHz, CDCl3) δ: 169.4, 155.8, 133.8, 132.6, 128.7, 128.3, 126.7, 125.5, 122.1, 121.5, 117.7, 116.3, 20.5; MS (EI) m/z: 242.28 (M+).
Compound 2 (0.4826 g, 2.0 mmol) and hexamethylenetetramine (HMT) (0.4206 g, 3.0 mmol) were added to TFA (15 mL). The reaction mixture was refluxed for 5 h. After the reaction was completed, the mixture solution was neutralized with NaHCO3 and extracted with dichloromethane (DCM). The organic phase was washed with distilled water for three times and evaporated in vacuum to give crude yellow solid, which was further purified through silica-gel chromatography using petroleum ether/ethyl acetate (V:V=30:1) as the eluent to give BA (0.4368 g, 81% yield). 1H NMR (500 MHz, DMSO-d6) δ: 12.72 (s, 1H), 10.28 (s, 1H), 8.16 (d, J=7.8 Hz, 1H), 8.10 (s, 1H), 8.06 (d, J=8.0 Hz, 1H), 7.65 (s, 1H), 7.56 (t, J=7.4 Hz, 1H), 7.48 (t, J=7.4 Hz, 1H), 2.34 (s, 3H); 13C NMR (126 MHz, DMSO-d6) δ: 192.0, 165.7, 157.5, 151.4, 135.6, 133.9, 133.3, 129.6, 127.4, 126.3, 123.6, 122.7, 122.7, 119.4, 20.2. HRMS calcd for C15H10NO2S: 268.0438, found 268.0522.
Stock solution of probe BA (1 mmol/L) was prepared in DMSO and was stored at 4 ℃. Stock solutions of 10 mmol/L various testing species (homocysteine (Hcy), cysteine (Cys), glutathione (GSH), serine (Ser), leucine (Leu), glycine (Gly), valine (Val), arginine (Arg), alanine (Ala), asparagine (Asn), ascorbic acid (Vc), Na2S, NaNO3, Na2SO3, H2O2, NaClO, Na2S2O3•5H2O, Na2S2O4, Na2S2O5, CH3COONa, KI, KSCN, NaH2PO4•2H2O, NaCl, NaNO2, AlCl3•6H2O, KCl, FeCl2•4H2O, CaCl2•2H2O, ZnCl2, FeCl3• 6H2O, CuCl2•2H2O and NiCl2•6H2O) were prepared by direct dissolution in distilled water. Hydroxyl radicals (•OH) were generated by the reaction of Fe2+ with H2O2, superoxide anion (O2-) was derived from KO2, and nitric oxide (NO) was provided by DEA/NONOate (1 mmol/L stock solution in 0.01 mol/L NaOH). Test solutions were prepared by adding 20 μL of BA (1 mmol/L), 180 μL of DMSO and appropriate amounts of each analytes (10 mmol/L) into 2 mL test tubes, respectively. Thereafter, the mixture solution was diluted to 2 mL with PBS buffer solution (20 mmol/L, pH 7.4). The sample solutions were shaken well and incubated for 45 min at room temperature before spectral measurement.
The fluorescence quantum yields of BA with and without Hcy were determined by using quinine sulfate (Φ=0.546 in 1 mol/L H2SO4) as a reference. The quantum yield was obtained using the following equation:
Фx=Фs(AsFx/AxFs)(nx2/ns2) (A≤0.05)
where, Ф represents the fluorescence quantum yield, x and s are the sample and the reference, respectively, A represents absorbance, and F is the corrected fluorescence emission spectral integral area.
HeLa cells were cultured in DMEM (Dulbecco's Modified Eagle's Medium) contained with 10% fetal bovine serum in CO2 incubator of 5% at 37 ℃. Then the cells were seeded on 96-well plates, and allowed to cultivate for one night. For imaging the cellular Hcy, HeLa cells were incubated with BA (10 μmol/Lol/L) in the culture medium containing 1% DMSO for 40 min at 37 ℃, and washed three times with prewarmed PBS buffer. For the thiol- blocking group, the cells were precultured with N-ethylmaleimide (a thiol-blocking agent, NEM, 0.5 mmol/L) for 30 min at 37 ℃, and then washed with prewarmed PBS buffer. The cells were further incubated with BA (10 μmol/L) in the culture medium containing 1% DMSO for 45 min at 37 ℃, and then washed three times with prewarmed PBS buffer. For the Hcy recovering group, the cells were precultured with NEM as previously mentioned, and then incubated with Hcy (100 μmol/L) for 30 min at 37 ℃. The cells were further incubated with BA (10 μmol/L) in the culture medium containing 1% DMSO for 45 min at 37 ℃, and washed with prewarmed PBS buffer for three times. Finally, the cell imaging was measured under a confocal fluorescence microscope (Leica TCS SP8, Germany) with exciting light at 405 nm.
Supporting Information Spectroscopic data, NMR spectra and MS spectra. The Supporting Information is available free of charge via the Internet at http://sioc-journal.cn.
Bu, L.; Chen, J.; Wei, X.; Li, X.; Agren H.; Xie, Y. Dyes Pigm. 2017, 136, 724. doi: 10.1016/j.dyepig.2016.09.032
Yang, X.; Guo, Y.; Strongin, R. M. Angew. Chem., Int. Ed. 2011, 50, 10690. doi: 10.1002/anie.201103759
Lee, P. T.; Lowinsohn, D.; Compton, R. G. Analyst 2014, 139, 3755. doi: 10.1039/C4AN00372A
Espina, J. G.; Montes-Bayón, M.; Blanco-González, E.; Sanz-Medel, A. Anal. Bioanal. Chem. 2015, 407, 7899. doi: 10.1007/s00216-015-8956-z
Huo, F. J.; Sun, Y. Q.; Su, J.; Chao, J. B.; Zhi, H. J.; Yin, C. X. Org. Lett. 2009, 11, 4918. doi: 10.1021/ol901951h
Inoue, T.; Kirchhoff, J. R. Anal. Chem. 2002, 74, 1349. doi: 10.1021/ac0108515
Kamińska, A.; Olejarz, P.; Borowczyk, K.; Głowacki, R.; Chwatko, G. J. Sep. Sci. 2018, 41, 3241. doi: 10.1002/jssc.201800381
Jiao, X.; Li, Y.; Niu, J.; Xie, X.; Wang, X.; Tang, B. Anal. Chem. 2018, 90, 533. doi: 10.1021/acs.analchem.7b04234
王瑞祥, 赖晓静, 邱观音生, 刘晋彪, 有机化学, 2019, 39, 952. doi: 10.6023/cjoc201811006Wang, R. X.; Lai, X. J.; Qiu, G. S.; Liu, J. B. Chin. J. Org. Chem. 2019, 39, 952(in Chinese). doi: 10.6023/cjoc201811006
Yue, Y.; Huo, F.; Li, X.; Wen, Y.; Yi, T.; Salamanca, J.; Escobedo, J. O.; Strongin, R. M.; Yin, C. Org. Lett. 2017, 19, 82. doi: 10.1021/acs.orglett.6b03357
Yue, P.; Yang, X.; Ning, P.; Xi, X.; Yu, H.; Feng, Y.; Shao, R.; Meng, X. Talanta 2018, 178, 24. doi: 10.1016/j.talanta.2017.08.085
Liang, Q.; Zhang, Y. J.; Zeng, M.; Guan, L.; Xiao, Y. Y.; Xiao, F. Toxicol. Res. 2018, 7, 521. doi: 10.1039/C8TX00029H
Cheng, T.; Huang, W.; Gao, D.; Yang, Z.; Zhang, C.; Zhang, H.; Zhang, J.; Li, H.; Yang, X. F. Anal. Chem. 2019, 91, 10894. doi: 10.1021/acs.analchem.9b02814
程晓红, 徐可, 屈少华, 阮志军, 有机化学, 2019, 39, 2835. doi: 10.6023/cjoc201904020Cheng, X. H.; Xu, K.; Qu, S. H.; Ruan, Z. J. Chin. J. Org. Chem. 2019, 39, 2835(in Chinese). doi: 10.6023/cjoc201904020
周婷婷, 杨瑜涛, 周柯岩, 胥稳智, 李玮, 有机化学, 2019, 39, 3498. doi: 10.6023/cjoc201906004Zhou, T. T.; Yang, Y. T.; Zhou, K. Y.; Xu, W. Z.; Li, W. Chin. J. Org. Chem. 2019, 39, 3498(in Chinese). doi: 10.6023/cjoc201906004
闫沛沛, 王婷, 张丹, 马晓雪, 有机化学, 2019, 39, 916. doi: 10.6023/cjoc201807055Yan, P. P.; Wang, T.; Zhang, D.; Ma, X. X. Chin. J. Org. Chem. 2019, 39, 916(in Chinese). doi: 10.6023/cjoc201807055
Qiu, X.; Jiao, X.; Liu, C.; Zheng, D.; Huang, K.; Wang, Q.; He, S.; Zhao, L.; Zeng, X. Dyes Pigm. 2017, 140, 212. doi: 10.1016/j.dyepig.2017.01.047
Lee, H. Y.; Choi, Y. P.; Kim, S.; Yoon, T.; Guo, Z.; Lee, S.; Swamy, K. M. K.; Kim, G.; Lee, J. Y.; Shin, I.; Yoon, J. Chem. Commun. 2014, 50, 6967. doi: 10.1039/c4cc00243a
Barve, A.; Lowry, M.; Escobedo, J. O.; Huynh, K. T.; Hakuna, L.; Strongin, R. M. Chem. Commun. 2014, 50, 8219. doi: 10.1039/C4CC03527E
Zhang, Y. J.; Ma, Y.; Liang, N. J.; Liang, Y. H.; Lu, C.; Xiao, F. Ecotoxicol. Environ. Saf. 2019, 186, 109749. doi: 10.1016/j.ecoenv.2019.109749
Zhao, N.; Gong, Q.; Zhang, R. X.; Yang, J.; Huang, Z. Y.; Li, N.; Tang, B. Z. J. Mater. Chem. C 2015, 3, 8397. doi: 10.1039/C5TC01159K
Sedgwick, A. C.; Wu, L.; Han, H. H.; Bull, S. D.; He, X. P.; James, T. D.; Sessler, J. L.; Tang, B. Z.; Tian, H.; Yoon, J. Chem. Soc. Rev. 2018, 47, 8842. doi: 10.1039/C8CS00185E
Meng, X.; Ye, W.; Wang, S.; Feng, Y.; Chen, M.; Zhu, M.; Guo, Q. Sens. Actuators, B 2014, 201, 520. doi: 10.1016/j.snb.2014.05.042
Lee, K. S.; Kim, T. K.; Lee, J. H.; Kim, H. J.; Hong, J. I. Chem. Commun. 2008, 6173.
Gu, B.; Huang, L.; Su, W.; Duan, X.; Li, H.; Yao, S. Anal. Chim. Acta 2017, 954, 97. doi: 10.1016/j.aca.2016.11.044
Chang, I. J.; Hwang, K. S.; Chang, S. K. Dyes Pigm. 2017, 137, 69. doi: 10.1016/j.dyepig.2016.09.058
Yang, L.; Su, Y.; Geng, Y.; Zhang, Y.; Ren, X.; He, L.; Song, X. ACS Sens. 2018, 3, 1863. doi: 10.1021/acssensors.8b00685
Wang, Y. W.; Liu, S. B.; Ling, W. J.; Peng, Y. Chem. Commun. 2016, 52, 827. doi: 10.1039/C5CC07886E
Huang, Z. J.; Ding, S. S.; Yu, D. H.; Huang, F. H.; Feng, G. Q. Chem. Commun. 2014, 50, 9185. doi: 10.1039/C4CC03818E

Figure 1 Fluorescence emission spectra of BA (10 µmol/L) with biothiols (1.0 mmol/L) in PBS buffer solutions (20 mmol/L, pH 7.4, containing 10% dimethyl sulfoxide (DMSO))
(A) λex=385 nm; (B) λex=420 nm. Inset: the color changes of BA in the absent and present of Hcy/Cys/GSH under the observation of 365 nm UV light

Figure 2 Partial 1H NMR (500 MHz) spectrum of BA in DMSO-d6 (A), and the resulting spectrum after addition of 50 equiv. Hcy in DMSO-d6 (B)

Figure 4 Molecular orbitals and excitation contributions of the excitation for BA-Hcy (A) and BA-Cys (B)

Figure 5 (A) Fluorescent response of BA (10 µmol/L) to biothiols (1.0 mmol/L) under different acidities, and (B) time-dependent fluorescence intensity (I478 nm) changes of BA (10 µmol/L) in the absence and presence of biothiols (1.0 mmol/L)

Figure 6 (A) Fluorescence response of BA (10 μmol/L) to varied concentration of Hcy (0~1.0 mmol/L), and (B) the relationship between the fluorescence intensity ratio (I478 nm/I544 nm) and Hcy concentration (0~1.0 mmol/L) (λex=420 nm)

Figure 7 (A) Fluorescence spectra of BA (10 µmol/L) in response to various analytes (1.0 mmol/L), and (B) fluorescence intensity ratio (I478 nm/I544 nm) changes of BA (10 µmol/L) in response to various analytes (1.0 mmol/L)
(1) BA only; (2) Hcy; (3) Cys; (4) GSH; (5) Ser; (6) Gly; (7) Ala; (8) Leu; (9) Val; (10) Arg; (11) Asn; (12) Vc; (13)NO3-; (14) CH3COO-; (15) I-; (16) SCN-; (17)H2PO4-; (18) Cl-; (19)NO2-; (20) Al3+; (21) K+; (22) Fe2+; (23) Ca2+; (24) Zn2+; (25) Fe3+; (26) Cu2+; (27) Na+; (28) Ni2+ (29) H2O2; (30) ClO-; (31) •OH; (32) O2-; (33) S2-; (34)SO32-; (35) S2O32-; (36) S2O42-; (37) S2O52-; (38) NO. λex=420 nm

Figure 8 Percentage of viable HeLa cells after treatment with indicated concentrations of BA (0~50 μmol/L) after 24 h
The cell viability was observed via MTT assay

Figure 9 Confocal fluorescence images of HeLa cells
Cells A1~A4 were stained with BA (10 μmol/L) for 45 min. Cells B1~B4 were precultured with NEM (500 μmol/L) for 30 min and then stained with BA (10 μmol/L) for 45 min. Cells C1~C4 were precultured with NEM (0.5 mmol/L) for 30 min, incubated with Hcy (100 μmol/L) for 30 min and then stained with BA (10 μmol/L) for 45 min. A1, B1 and C1: bright field; A2, B2 and C2: blue channel (415~490 nm); A3, B3 and C3: green channel (520~600 nm); A4, B4 and C4: overlay of blue, green channel and bright field. Scale bar=20 μmol/L

 扫一扫看文章

扫一扫关注我们
 下载:
下载:

 下载:
下载:

