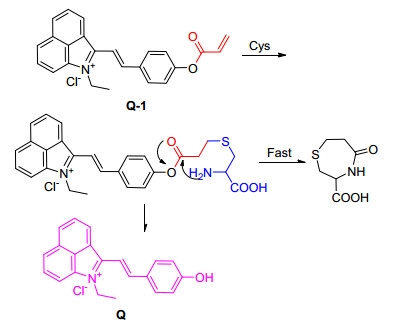
Scheme 1.
Mechanism of the reaction of aldehyde group with Cys
Novel Ratio-Based Fluorescent Probe for Intracellular Cys Detection
Xiaoqin Zhou , Mengyuan Cui , Chengli Jia , Min Yang , Min Ji , Peng Wang

Cysteine (Cys) is an essential amino acid in the human body.[1a-1b] Cys has been proved to be an effective antidote to a wide range of poisons due to its binding effect in vivo, [2] it plays an important role in the biosynthesis of methionine, thiamine, heparin, biotin, lipoic acid, coenzyme A, etc., [3a-3b] it can protect the defense system against oxidation[4a-4b] and affect the formation, folding, assembly and stability of disulfide bonds.[5a-5c] Therefore, it is very necessary and important to detect the level of Cys.[6] Common fluorophores of fluorogenic probes are cou- marin, [7a-7b] cyanine, [8a-8c] fluorescein, [9] rhodami- ne, [10a-10b] fluoropyrrole, [11a-11c] naphthalimide, [12a-12b] etc., while naph- thalimide fluorescent probes are relatively less compared with other kinds of fluorescent groups, mainly due to its poor water solubility, which is difficult to be used in cells. In this study, the conversion of naphthalimides into onium salts can well solve the problem of poor water solubility, therefore, structurally, it is converted from naphthalimide derivatives to indocyanines. Studies have shown that indocyanines-based fluorescent probes often have near- infrared spectral properties, so they are widely used in cell, tissue, and in vivo imaging.[13] In this study, a new fluorophore was designed and synthesized based on the indocyanines structure.
Stronginʼs group[14] reports selective Cys probes, and probes based on this strategy have been frequently reported. Both Cys and homocysteine (Hcy) can be cyclized with acrylate by Michael addition[15a-15b] to form S and N rings.[9] However, due to the steric hindrance effect, the formation rate of seven-membered cyclization is much faster than that of eight-membered cyclization, so the rate of reaction between probes and Cys is far higher than that of Hcy, in order to achieve selective detection of Cys. Based on this classical response recognition, the probe Q-1 was designed and synthesized, which can distinguish Cys from Hcy well. In 2012, Sinha et al.[16] synthesized and evaluated indocyanines dyes as PRMT inhibitors and imaging agents. Unfortunately, its excellent optical performance has not been fully demonstrated. In 2014, Liu et al.[17] reported a flavone-based excited-stste intramolecular proton transfer (ESIPT) ratiometric chemodosimeter for detection of Cys in linving cells. Its probe is a flavonoid based dye, and its recognition mechanism is the same as that in this paper. It has good optical properties, but its detection line is relatively high, and there is no visible color change of naked eye. The indocyanine fluorescent probe reported in this article is, as far as I know, the first fluorescent probe currently used for the detection of cysteine in cells.
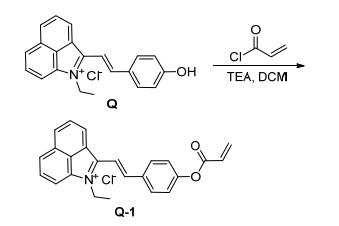
Based on the intramolecular charge transfer mechanism, after the nucleophilic addition of the probe Q-1 and Cys, the fluorophore Q is detached from the reaction system (Scheme 1), forming a new push-pull the electronic system causes a strong charge transfer within the molecule, which results in changes in the absorption and emission spectra. The UV absorption and fluorescence spectra of the probe Q-1 interacting with Cys further proved its correctness. The probe Q-1 can quickly respond to Cys, and the Cys concentration within the range of 0~85 μmol•L-1 maintains a good linear correlation with the fluorescence signal ratio. The detection limit can reach 75 nmol•L-1, and the fluorescence ratio signal is increased by 16 times, which can accurately analyze the concentration of Cys. Through selective and competitive experiments, it was found that the probe Q-1 is specific for Cys. At the same time, its pH response further indicates the stability of the probe in a neutral environment. However, the toxic effect of probe Q-1 on cells is negligible, and there is a higher ratio of fluorescence signals in cells. The synthetic route for the probe Q-1 is shown in Scheme 2.
The standard curve and curve equation between the concentration of probe Q-1 and the absorbance can be obtained by measuring the absorbance value of the sample at 417 nm with the ultraviolet spectrophotometer. There is a good linear correlation between the concentration and the absorbance (y=0.0287x, R2=0.9999). When the UV absorbance is 0.2~0.8, the solubility of probe Q-1 in PBS is between 6.67~27.9 μg/mL, so it has better solubility in PBS.
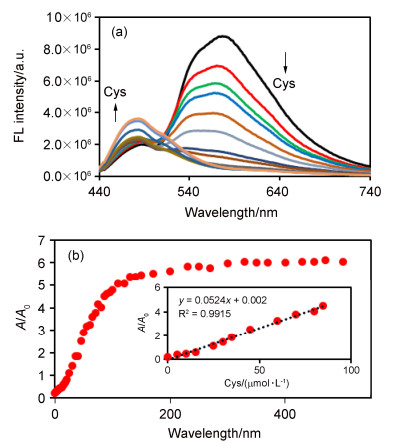
In this study, the reaction between the probe and Cys was characterized by mass spectrometry, and its spectral properties were also studied. It is found that the probe Q-1 has a large UV absorption peak in 440 nm, afterwards, the probe Q-1 was treated with different concentrations of Cys (0~1000 μmol•L-1) and shaken at 37 ℃ for half an hour, the solution changed from orange-red to blue. There is a clear difference, and its UV absorption peak is red shifted to 620 nm. However, at an excitation wavelength of 620 nm, its fluorescence spectrum has hardly changed. Similarly, at an excitation wavelength of 560 nm, its fluorescence spectrum has not changed. Therefore, 417 nm was used as the excitation wavelength. At 417 nm, after probe Q-1 interacts with Cys, there is a small UV absorption peak, regarding why only 417 nm can be used as the excitation wavelength, the fluorescence mechanism is not yet clear. The spectral response image of probe Q-1 to different concentrations of Cys is shown in Figure 1. It can be seen from Figure 1 that with increase of Cys concentration, the fluorescence intensity at 576 nm of the emission wavelength decreased, while the fluorescence intensity at 486 nm of the emission wavelength increased. Further study found that when the concentration of Cys is between 0 and 85 μmol•L-1, the fluorescence ratio signal with emission wavelength at 486 and 576 nm is linearly related to Cys concentration (y=0.0524x+0.002, R2=0.9915), and according to the detection limit formula LOD=3σ/K, the detection limit of probe Q-1 is 75 nmol•L-1. Probe Q-1 describes a ratio type fluorescent probe, which can well eliminate the influence of background noise. Probe Q-1 can be used for quantitative analysis of Cys with high sensitivity in a wide range.
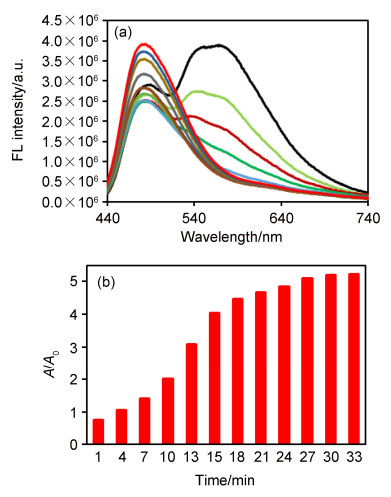
The fluorescence response of the probe to a certain concentration of Cys with time was measured (Figure 2). The results show that the probe Q-1 can respond quickly after contacting with Cys, and the fluorescenceintensity decreases sharply at 576 nm, but increases at 486 nm. After 30 min, it reaches saturation state, and the fluorescence ratio signal remains unchanged. Due to the attenuation effect, the signal of fluorescence intensity and fluorescence ratio in the saturated state is weaker than that in saturated state with the change of concentration.
In order to determine the stability of probe Q-1, the fluorescence spectrum of probe Q-1 and the probe Q-1 after interaction with Cys in pH 1~14 range was measured. The fluorescence intensity and fluorescence intensity ratio(I486 nm/I576 nm) of probe Q-1 at different emission wavelengths with the change of pH was referred. It can be seen that when the pH range is 1~9, the fluorescence ratio signal of the probe Q-1 is relatively stable. When pH is greater than 9, the ester bond of probe Q-1 will be hydrolyzed to generate fluorophore Q and acrylic acid chloride. The emission wavelength corresponding to probe Q-1 is at 576 nm, while the emission wavelength corresponding to the fluorophore Q is at 486 nm, so its fluorescence ratio signal is rapidly enhanced. However, the pH of the cell remains neutral, so the probe Q-1 can be used to detect Cys in cells. The fluorescence spectrum of the effect of probe Q-1 on the reaction system of Cys in the range of pH 1~14 was also tested. The results show that when pH is in the range of 1~14, the fluorescence intensity of the probe increases with the increase of alkalinity at the emission wavelength of 486 nm, and decreases with the increase of alkalinity at the emission wavelength of 576 nm. It can be concluded that the acidic environment has a certain inhibitory effect on the reaction, while the alkaline environment is conducive to the reaction. However, in a neutral environment, the fluorescence ratio of probe Q-1 to Cys remained stable at about 6.0. The fluorescence ratio signals of probe Q-1 to Cys will have better stability in cells.
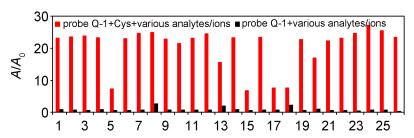
In order to prove the specificity and priority of probe Q-1 for Cys, the fluorescence spectrum of the interaction of probe Q-1 with different amino acids and inorganic ions were tested and analyzed, respectively (Figure 3). The fluorescence spectral responses of probe Q-1 to different amino acids and ions were measured. It is found that amino acids and ions have almost no effect on the fluorescence spectrum of probe Q-1, and the fluorescence ratio signal is very weak. However, with the addition of Cys, the fluorescence emission wave is significantly blue-shifted, and the ratio fluorescence signal is significantly enhanced, which is about 6~30 times stronger. It shows that probe Q-1 has better selectivity for Cys than other amino acids and ions, and can specifically detect Cys.
(1) Ala, (2) Arg, (3) Asp, (4) CaCl2, (5) Gln, (6) Gly, (7) GSH, (8) Hcy, (9) Leu, (10) Lys, (11) Met, (12) MgSO4, (13) Na2S, (14) NaCl, (15) NH4Cl, (16) Phe, (17) Pro, (18) Ser, (19) Thr, (20) Trp, (21) Val, (22) ZnCl2, (23) H2O2, (24) ClO-, (25) O2-, (26) •OH
The cytotoxicity assay of the probe Q-1 was evaluated by conventional cell viability assays. The probe Q-1 was dissolved in organic solvent DMSO, and different concentrations of probe Q-1 (0~50 µmol•L-1) were incubated with Hale cells for 24 h. The results show that when the concentration of the probe Q-1 is 50 μmol•L-1, the cells still maintain a high survival rate (about 90%). The results indicate that the probe Q-1 has a small toxic effect on cells, and its low toxicity has great application prospects.
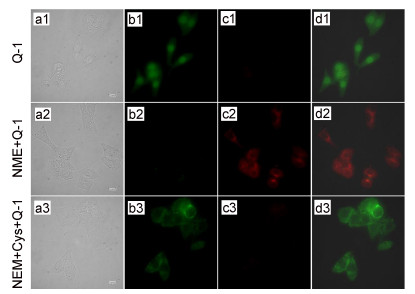
In order to investigate whether the probe Q-1 can selectively detect Cys in living cells, a fluorescent inverted microscope to perform cell imaging was used. As shown in Figure 4, brightfield measurements show cell viability in the experimental environment. In the control experiment, N-ethylmaleimide (NEM), as a sulfhydryl blocking agent, reduced the concentration of Cys. The cells treated with probe Q-1 alone showed weak fluorescence signal in the red channel and strong fluorescence signal in the green channel. When cells were incubated with NEM and probe Q-1, they showed strong fluorescence signal in the red channel and almost no fluorescence signal in the green channel. When cells were incubated with NEM and Cys, and then incubated with probe Q-1, strong fluorescence signal was observed in green channel, but almost no fluorescence signal in red channel. These results show that the interaction between probe Q-1 and Cys is a ratio mode fluorescence signal. Therefore, probe Q-1 will be a feasible fluorescent probe to detect the abnormal level of Cys.
A novel small molecule fluorescent probe was designed and synthesized. Based on the classical probe recognition mechanism, it can specifically recognize Cys, which is superior to homocysteine and glutathione. The fluorescence signal ratio of the probe Q-1 to Cys concentration has a good linear correlation in a wide range, low detection limit, large fluorescence intensity, and can be used for fluorescence imaging in water and fluorescence imaging in cells. It is worth mentioning that during this experiment of ultraviolet and fluorescence spectroscopy, a particularly interesting phenomenon was found. After nucleophilic addition of probe Q-1 with cysteine, it was further cycled to release fluorophore Q, and the color of the solution changes from orange-red to blue, and the maximum absorption peak of ultraviolet shifts to 620 nm. The absorbance at 620 nm is much larger than that at 417 nm. When the excitation wavelength is 620 nm, the reaction solution between probe Q-1 and Cys has almost no fluorescence. It is suspected that it may turn into heat. The investigation of light and heat will be further discussed in the future. The probe Q-1 will provide a new method for exploring the biological function of Cys, which is of great significance for the study of Cys in vitro. Its light and heat investigation may make the probe Q-1 not only have a labeling function, but also hope to provide new ideas for tumor research.
All the reagents are analytically pure and can be used directly without further purification. With TMS as the internal standard, 1H NMR and 1C NMR spectra were obtained through a Qone WNMR-I-AS400 nuclear magnetic resonance spectrometer (Suzhou) of Zhongke Oxford Spectral Technology Co., Ltd. The mass spectrometry was obtained by a Waters2795 high performance liquid chromatography+Quattro micro triple quadrupole mass spectrometer. The high resolution mass spectrometry was obtained by a 6200 series Q-TOF B.06.01 (B6157) (China medical university). The melting point of the substance is measured by a RY-1G melting point instrument of Tianjin Tianguang Optical Instrument Co., Ltd. (Suzhou). UV-Vis spectra were obtained by a Shimadzu UV-3700 (Suzhou). All pH measurements were carried out using a thunder magnetic PHS-3E PH meter with Emer 301F PH composite electrode (Shanghai instrument Electric Scientific Instruments Co., Ltd., Shanghai, China). The fluorescence spectrum was measured by a HORIBA Scientific FluoroMax-4 fluorescence spectrophotometer. The excitation wavelength was 417 nm and the excitation slit width was 5 nm. The emission slit width was 5 nm. Hale/HepG2 cells are derived from a Jiangsu Kaiji Biotechnology Co., Ltd. (China). The cytotoxicity test was measured by TECAN Infinite 200 PRO multifunction enzyme labeling instrument. The cell images were taken with a LeicaDMi8 fluorescence inverted microscope (China Pharmaceutical University, Nanjing, China).
Add (E)-1-ethyl-2-(4-hydroxystyryl)benzo[cd]indol-1- ium (Q, 3 g) to an anhydrous device, and inject dichloromethane (30 mL) and triethylamine (2.6 g) in an ice bath. As a catalyst, acryloyl chloride (1.5 g) was added dropwise and stirred at room temperature for 3 h. At the end of the reaction, the acryloyl chloride of the reaction liquid was quenched in the ice water mixture, extracted the organic layer with ethyl acetate, concentrated and dried under reduced pressure, and then the dark red crude product was obtained. The bright red product was obtained by rapid column chromatography (dichloromethane/MeOH, V: V=30:1) with 60% yield (2.7 g). m.p. 158~158.5 ℃; 1H NMR (400 MHz, MeOH) δ: 9.23 (d, J=7.4 Hz, 1H), 8.83~8.76 (m, 1H), 8.71 (d, J=8.0 Hz, 1H), 8.37 (dd, J=7.8, 3.0 Hz, 2H), 8.25~8.18 (m, 3H), 8.08~7.92 (m, 2H), 7.42 (d, J=8.7 Hz, 2H), 6.66 (dd, J=17.3, 1.1 Hz, 1H), 6.44 (dd, J=17.3, 10.4 Hz, 1H), 6.17 (dd, J=10.4, 1.1 Hz, 1H), 4.93 (q, J=7.3 Hz, 2H), 1.71 (t, J=7.3 Hz, 3H); 13C NMR (101 MHz, MeOH) δ: 164.0, 162.3, 154.4, 152.6, 138.7, 137.4, 135.3, 132.7 (d, J=4.9 Hz), 131.3, 131.0, 130.8, 129.8, 129.4, 127.6, 127.2, 123.5, 122.5, 119.5, 114.1, 41.7, 14.5.
Stock solutions of probe Q-1 (1 mmol/L) were prepared in dimethyl sulfoxide (DMSO). Stock solutions of H2O2, ClO-, O2-, •OH, CaCl2, MgSO4, NaCl, NH4Cl, Na2S, ZnCl2, Ala, Arg, Asp, Gln, Gly, Gsh, Hcy, Leu, Lys, Met, Phe, Pro, Ser, Thr, Trp and Val were prepared in distilled water. The pH was adjusted by adding a certain amount of sodium hydroxide and 2 mol•L-1 hydrochloric acid to phosphate buffer and acetate buffer. The stock solutions of analytes were diluted to desired concentrations with distilled water when needed. For the typical optical measurements, probe Q-1 was diluted to 10 μmol•L-1 in DMSO/phosphate buffer (V:V=9:1, 10 μmol•L-1, pH 7.2~7.4), and 3.0 mL of the resulting solution was placed in a quartz cell. The UV-vis or fluorescence spectra were obtained upon the addition of analytes. HepG2/Hale cells were cultured in modified Eagleʼs medium supplemented with 10% calf bovine serum in an atmosphere of 5% CO2 and 95% air at 37 ℃.
Supporting Information MS, HRMS, 1H NMR, 13C NMR of probe Q-1. The Supporting Information is available free of charge via the Internet at http://sioc-journal.cn/.
(a) Dai, C. G.; Du, X. J.; Song, Q. H. J. Org. Chem. 2015, 80, 12088.
(b) Ganganboina, A. B.; Dutta Chowdhury, A.; Doong, R. A. ACS Appl. Mater. Interfaces 2018, 10, 614.
Chen, W.; Luo, H.; Liu, X.; Foley, J. W.; Song, X. Anal. Chem. 2016, 88, 3638. doi: 10.1021/acs.analchem.5b04333
(a) He, L.; Yang, X.; Xu, K.; Lin, W. Anal. Chem. 2017, 89, 9567.
(b) Tian, Q.; Chen, S.; Chen, J.; Liu, R.; Wang, Y.; Yang, X.; Ye, Y. Chin. J. Org. Chem. 2019, 39, 2089(in Chinese).
(田庆, 陈双虎, 陈景龙, 刘蕊, 汪雨诗, 杨晓朋, 叶勇, 有机化学, 2019, 39, 2089.)
(a) Dong, B.; Lu, Y.; Zhang, N.; Song, W.; Lin, W. Anal. Chem. 2019, 91, 5513.
(b) Li, S.; Song, D.; Huang, W.; Li, Z.; Liu, Z. Anal. Chem. 2020, 92, 2802.
(a) Cao, X.; Lin, W.; Yu, Q. J. Org. Chem. 2011, 76, 7423.
(b) Chang, M. J.; Joo, J. H.; Lee, M. H. Bull. Korean Chem. Soc. 2019, 40, 539.
(c) Chen, C.; Zhou, L.; Liu, W.; Liu, W. Anal. Chem. 2018, 90, 6138.
Deng, L.; Wu, W.; Guo, H.; Zhao, J.; Ji, S.; Zhang, X.; Yuan, X.; Zhang, C. J. Org. Chem. 2011, 76, 9294. doi: 10.1021/jo201487m
(a) He, L.; Xu, Q.; Liu, Y.; Wei, H.; Tang, Y.; Lin, W. ACS Appl. Mater. Interfaces 2015, 7, 12809.
(b) Ding, Y.; Pan, Y.; Han, Y. Ind. Eng. Chem. Res. 2019, 58, 7786.
(a) Guo, L.; Chan, M. S.; Xu, D.; Tam, D. Y.; Bolze, F.; Lo, P. K.; Wong, M. S. ACS Chem. Biol. 2015, 10, 1171-5.
(b) He, L.; Yang, Y.; Lin, W. Anal. Chem. 2019, 91, 15220.
(c) Ji, Y.; Wang, Y.; Zhang, N.; Xu, S.; Zhang, L.; Wang, Q.; Zhang, Q.; Hu, H. Y. J. Org. Chem. 2019, 84, 1299.
Fu, Z. H.; Han, X.; Shao, Y.; Fang, J.; Zhang, Z. H.; Wang, Y. W.; Peng, Y. Anal. Chem. 2017, 89, 1937. doi: 10.1021/acs.analchem.6b04431
(a) Sun, S.; Qiao, B.; Jiang, N.; Wang, J.; Zhang, S.; Peng, X. Org. Lett. 2014, 16, 1132.
(b) Yang, L. L.; Zou, S. Y.; Fu, Y. H.; Li, W.; Wen, X. P.; Wang, P. Y.; Wang, Z. C.; Ouyang, G. P.; Li, Z.; Yang, S. J. Agric. Food Chem. 2020, 68, 4285.
(a) Chen, Y.; Zhao, J.; Guo, H.; Xie, L. J. Org Chem. 2012, 77, 2192.
(b) Gong, D.; Han, S. C.; Iqbal, A.; Qian, J.; Cao, T.; Liu, W.; Liu, W.; Qin, W.; Guo, H. Anal. Chem. 2017, 89, 13112.
(c) Zhang, D.; Xu, N.; Li, H.; Yao, Q.; Xu, F.; Fan, J.; Du, J.; Peng, X. Ind. Eng. Chem. Res. 2017, 56, 9303.
(a) Jia, T.; Fu, C.; Huang, C.; Yang, H.; Jia, N. ACS Appl. Mater. Interfaces 2015, 7, 10013.
(b) Sarkar, A.; Fouzder, C.; Chakraborty, S.; Ahmmed, E.; Kundu, R.; Dam, S.; Chattopadhyay, P.; Dhara, K. Chem. Res. Toxicol. 2020, 33, 651.
Luo, Z.; Huang, Z.; Li, K.; Sun, Y.; Lin, J.; Ye, D.; Chen, H.-Y. Anal. Chem. 2018, 90, 2875. doi: 10.1021/acs.analchem.7b05022
Wang, W. H.; Rusin, O.; Xu, X. Y.; Kim, k. k.; Escobedo, J. O.; Fakayode, S. O.; Fletcher, K. A.; Lowry, M.; Schowalter, C. M.; Lawrence, C. M.; Froczek, F. R.; Warner, I. M.; Strongin, R. M. J. AM. CHEM. SOC. 2005, 127, 15949-15958 doi: 10.1021/ja054962n
(a) Chen, J.; Jiang, X.; Carroll, S.; Huang, J.; Wang, J. Org. Lett. 2015, 17, 5978.
(b) Cheng, T.; Huang, W.; Gao, D.; Yang, Z.; Zhang, C.; Zhang, H.; Zhang, J.; Li, H.; Yang, X. F. Anal. Chem. 2019, 91, 10894.
Sinha, S. H.; Owens, E. A.; Feng, Y.; Yang, Y.; Xie, Y.; Tu, Y.; Henary, M.; Zheng, Y. G. Eur. J. Med. Chem. 2012, 54, 647. doi: 10.1016/j.ejmech.2012.06.017
Liu, B.; Wang, J.; Zhang, G.; Bai, R.; Pang, Y. ACS Appl. Mater. Interfaces 2014, 6, 4402. doi: 10.1021/am500102s

Figure 1 (a) Fluorescence intensity and (b) fluorescence intensity ratio (A/A0: I486 nm/I576 nm) titration profiles of Q-1 (10 μmol•L-1) in the presence of Cys (0~500 μmol•L-1) in PBS containing 10% DMSO as a cosolvent (excitation at 417 nm)

Figure 2 (a) Time-dependent the fluorescence intensity and (b) fluorescence intensity ratio (A/A0: I486 nm/I576 nm) of 10 μmol•L-1) probe Q-1 in the presence of 500 μmol•L-1) Cys under excitation at 417 nm in PBS (10% DMSO)

Figure 3 In the presence of various representative ions and amino acids (500 μmol/L individually) in a PBS buffer containing 10% DMSO as a co-solvent, probe Q-1 (10 μmol•L-1) fluorescence intensity ratio (A/A0: I486 nm/I576 nm)
(1) Ala, (2) Arg, (3) Asp, (4) CaCl2, (5) Gln, (6) Gly, (7) GSH, (8) Hcy, (9) Leu, (10) Lys, (11) Met, (12) MgSO4, (13) Na2S, (14) NaCl, (15) NH4Cl, (16) Phe, (17) Pro, (18) Ser, (19) Thr, (20) Trp, (21) Val, (22) ZnCl2, (23) H2O2, (24) ClO-, (25) O2-, (26) •OH

 扫一扫看文章

扫一扫关注我们
 下载:
下载:

 下载:
下载:

