Received Date:
30 November 2019 Revised Date:
13 January 2020 Available Online:
25 May 2020
Fund Project:
Project supported by the National Natural Science Foundation of China (No.81741160), the Natural Science Foundation of Guangdong Province (No. 2014A030313411), the Science and Technology Planning Project of Guangdong Province (Nos. 2017A020217008, 2015A020216017), the Special Project for Marine Economic Development (Six Major Marine Industries) of Guangdong Province of Department of Natural Resources of Guangdong Province (No. [2020]039), the Open Subject of Guangdong Province Key Laboratory of Pharmacodynamic Constituents of Traditional Chinese Medicine and New Drugs Research, the Fire Plan Project of the Guangzhou University of Chinese Medicine (No. XH20170110), and the Open Subject of State Key Laboratory of Marine Resources Utilization in the South China Sea of Hainan University (No. 2016003)
Abstract:
Subergorgic acid (1), a cyclopentapentalane sesquiterpenoid and potential reversible cholinesterase inhibitor, and its analogue 2-deoxy-2β-hydroxysubergorgic acid (2) were first isolated from soft coral-associated symbiotic and epiphytic fungus Aspergillus sp. EGF15-0-3. Their structures were established by NMR and HRESIMS spectroscopic data. According to the strategy of one strain many compounds (OSMAC) and eutrophic culture, Global Natural Products Molecular Networking (GNPS) was applied to detect the presence of compounds 1 and 2 in 23 different media for optimal medium compositions. As a result, compound 1 was found in 6 different media besides potato dextrose broth (PDB) medium, the contents of 2 were different in the solid and liquid media, and the best medium for compounds 1 and 2 was GPY+CaCO3. It was demonstrated that the soft coral-associated symbiotic and epiphytic fungus Aspergillus sp. EGF15-0-3 was the microbiological producer of compounds 1 and 2. This work provided strong evidence to support the hypothesis that novel and bioactive secondary metabolites produced by marine invertebrates often come from endogenetic, epiphytic, symbiotic or environmental microorganisms.
Subergorgic acid (1) (Figure 1), a cyclopentapentalane sesquiterpenoid with a tricyclo undecane (angular triquinane) skeleton, was firstly isolated from Suberogoria appressa of South China Sea by professor Kang-Hou Long in 1982, [1] and the absolute chemical structure was assigned on the basis of detailed spectroscopic data and X-ray analysis in 1985.[2~5] Compound 1 was a “reversible cholinesterase inhibitor” according to pharmacological theory.[6] Meanwhile, compound 1 and its analogues have been demonstrated to possess strong neurotoxicity, the capacity for inhibiting neuromuscular transmission, antiarrhythmic, antidiuretic, and protective effects on myocardial ischemia in perfusion injury.[3, 6] The structure-activity studies have shown that the carboxyl, carbonyl groups and double bond of 1 are closely related to its activity and toxicity. When these functional groups are on the coplane (pharmacodynamic conformation), they tend to interact with acetylcholinesterase.[7] It is worth noting that compound 1 and its derivatives are expected to become new drugs for the treatment of Alzheimerʼs disease, and the study has entered the pre-clinical trial stage.[7~11]
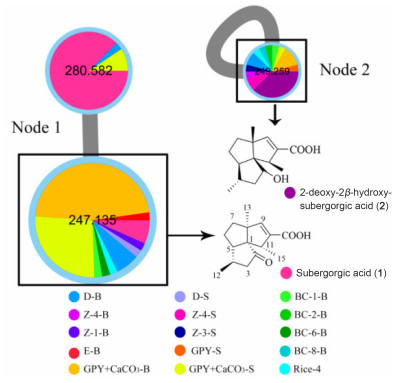
图 1
图 1.
Enlarged view of molecular network for the compounds 1 and 2 from Aspergillus sp. EGF15-0-3 in different media
The relative abundance of detected molecule can be visualized in node with a pie chart diagram (colors correspond to the different samples), and the edge (the grey line) thickness attribute was defined to reflect cosine similarity scores, with thicker lines indicating higher similarity
Because of its structural complexity, rigidity of cycle, and abundance of chiral centers, over the past 37 years since its first discovery, there were only several reports on the synthesis of compound 1.[12~20] For example, Gilbert group[21] recently synthesized it with correct stereochemistry by using Michael addition and Dreiding method. In a word, the synthetic procedure was rather complicated and the asymmetric synthesis was required, which were not conducive to its industrial production. Up to now, 1 has also been isolated from gorgonian Subergorgia suberosa, [22~27]Isis hippuris, [28]Menella sp.[29] and Leptogorgia rigida.[30] Meanwhile, 2-deoxy-2β-hydroxysubergorgic acid (2) (Figure 1), an analogue of 1, has been isolated from Menella kanisa.[31] Based on the hypothesis that new bioactive secondary metabolites produced by marine invertebrates usually come from endogenetic, epiphytic, symbiotic or environmental microorganisms, so we propose that subergorgic acid and its analogues may be produced by host- associated microorganisms.
At present, the one strain many compounds (OSMAC) strategy has been applied to stimulate the growth of novel marine fungal secondary metabolites by variation of cultivation parameters.[32~35] Meanwhile, Global Natural Products Social Molecular Networking (GNPS), an approach that organizes MS/MS data based on chemical similarity, has been developed to efficiently duplicate extracts and pure compounds with reduced cost and effort.[36~38] In order to find out whether subergorgic acid and its analogue are possibly from marine microorganism, the soft coral-derived fungus Aspergillus sp. EGF15-0-3 was cultured by 23 medium and analyzed by GNPS. compound 1 was not only isolated from EGF15-0-3 on PDB medium, but also produced in 6 different media besides PDB medium, the contents of compound 2 were largely different in the solid and liquid media, and the best medium for compounds 1 and 2 was GPY+CaCO3. Thus, we have successfully demonstrated that subergorgic acid and its analogues can be produced by marine microorganisms, not only in liquid media, but also eutrophic culture bioconversion (BC) and solid media, and marine microorganism may be the true producer of them.
2.
Results and discussion
Compounds 1 and 2 were obtained from the soft coral-associated symbiotic and epiphytic fungus Aspergillus sp. EGF15-0-3 for the first time (Figure 1). Their structures were characterized by comparison of NMR data with the literature.[3, 4] Meanwhile, comparison of the experimental CD curves with the literature, the absolute configurations of compounds 1 and 2 were also determined as 1S, 4R, 5S, 8S, 11R of 1 and 1R, 4S, 5R, 8R, 1S of 2, respectively.[5]
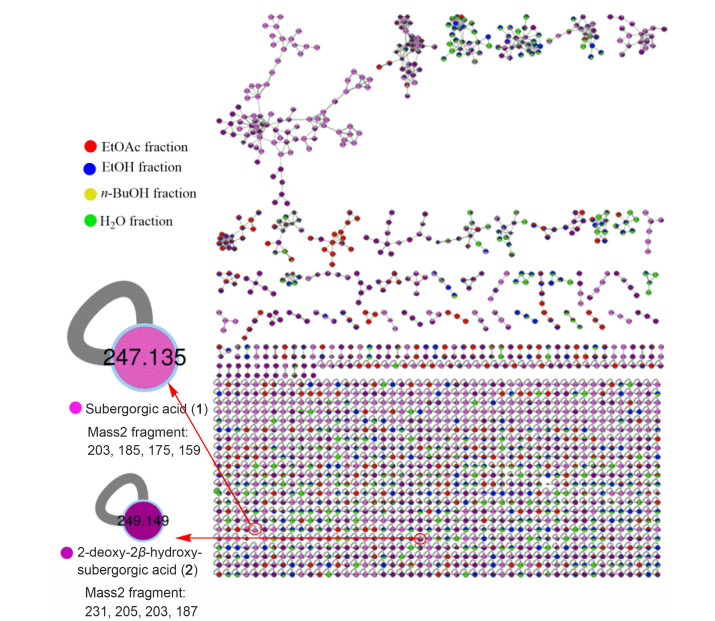
In order to confirm whether compound 1 and its analogues 2 can be produced in the different media, Aspergillus sp. EGF15-0-3 was cultivated in eight liquid-based, eleven bioconversion and four solid media by OSMAC. GNPS molecular network (Figure 2) was established with EtOAc crude extracts of 23 different media of EGF15-0-3, 1 and 2. Meanwhile, molecular network was established with 1, 2 and extracts of soft coral which have been sepa- rated into four fractions based on the polarity (Figure 3).The generated molecular networks were visualized in cytoscape, with the node pie chart diagram representing the relative abundance of detected molecule.
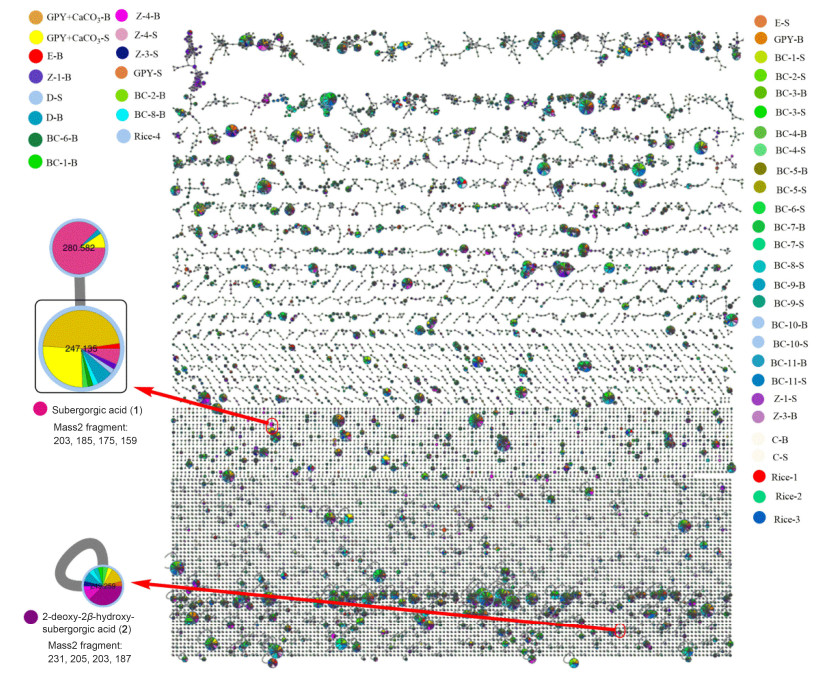
图 2
图 2.
Molecular network generated from direct infusion of extracts sampling of 23 different media of Aspergillus sp. EGF15-0-3 and 2 known compounds
The inlaid portions of the network were rearranged in cytoscape for easier visualization of node connectivity and annotation. The color of the node corresponds to the origin of the sample, and the thickness of the edge reflects the similarity defined by the cosine score. The size of the node is reflective of the relative amount of the indicated compounds
As a result, in node 1 (Figure 1), the presence of 1 in the crude samples of different media was confirmed by matching MS/MS fragmentation patterns and retention times. It was detected in the broth and mycelium of PDB and GPY+CaCO3 media, broth of Z-1, E, BC-1 and BC-6 media and in rice-4 medium (Figure 1). The contents of 1 in the GPY+CaCO3 medium were higher than other media under the same conditions. More information about node 1 can be found in the GNPS spectral library.[39]
Node 2 (Figure 1) showed nine media producing 2-de- oxy-2β-hydroxysubergorgic acid (2), including five liquid media, three BC media and one rice medium. It was detected in the broth and mycelium of GPY+CaCO3 and Z-4 media, mycelium of Z-3 and GPY media and broth of PDB medium. By changing amino acid composition and amount, 2 could be detected in the broth of BC-1, BC-2 and BC-8 media. It was also produced in rice-4 medium. The optimal medium for 2 is GPY+CaCO3. More information about node 2 can be found in the GNPS spectral library.[40]
Overall, GNPS has been demonstrated to be a facile and powerful technology to screen subergorgic acid and its analogues. The contents of 1 and 2 varied in different media. They were stable in GPY+CaCO3 medium, and the contents were reduced by adding Glu, Ser, Val, Pro, or other amino acids.
Meanwhile, in order to verify that fungus EGF15-0-3 was the producer of 1 and 2, the results of molecular network 2 were further analyzed (Figure 3). However, 1 and 2 were not found in all four polar fractions, indicating if there are any 1 and 2 in soft coral; their concentrations are below the detection limit of the LC-MS. More information about molecular networks of 1 and 2 can be found in the GNPS spectral library.[41]
3.
Conclusions
According to the analysis of GNPS, although subergorgic acid (1) and 2-deoxy-2β-hydroxy-subergorgic acid (2) have the same carbon skeleton, their productions were quite different in 23 media. The contents of 1 were largely different in the broth and mycelia of PDB, GPY+CaCO3, Z-1, E, BC-1, BC-6 and rice-4 media, and 2 was mainly from GPY+CaCO3, Z-4, Z-3, GPY, PDB, BC-1, BC-2, BC-8, and rice-4 media. Interestingly, symbiotic and epiphytic microorganisms could facilitate the steady production of 1 and 2 in GPY+CaCO3 and PDB media. While adding amino acids could reduce the production of both of them. This work provided strong evidence to support the hypothesis that novel and bioactive secondary metabolites produced by marine invertebrates often come from marine invertebrates-associated endogenetic, epiphytic, symbiotic or environmental microorganisms.
4.
Experimental
4.1
General experimental procedures
Optical rotation data were measured on a MCP 200 digital polarimeter (Anton Paar, Austria). UV and circular dichroism spectra were measured on a chirascan Circular Dichroism (Applied Photophysics, UK). HR-ESI-MS data were performed on a Triple TOFTM 5600+ system (AB SCIEX, USA). NMR spectra were recorded on a Bruker avance III HD 400 MHz digital NMR spectrometer (Bruker Optics, Karlsruhe, Germany) with TMS as an internal standard. Column chromatography (CC) was performed with 200~300 mesh silica gel (Qingdao Marine Chemical Factory, China). TLC was performed on silica gel GF254 (Qingdao Marine Chemical Factory, China), spots were visualized under Ultraviolet transmission reflectometer (Shanghai Jingke Industrial, Shanghai). The preparative HPLC was performed on a Semi-preparative HPLC (QuikSep, Beijing, China) with Kromasil 100-5 C18 column (10 mm×250 mm, 5 μm, Sweden). Subergorgic acid and 2-deoxy-2β-hydroxysubergorgic acid were used to establish GNPS, and their structures were determined by NMR and MS. 2-Deoxy-2β-hydroxysubergorgic acid was also from gorgonian Leptogorgia rigida.[13]
The strains in this work were cultured in eight liquid media, eleven bioconversion and four rice media. All of culture media compositions are available in the Supporting Information (Tables S1~S3).
4.2
Fungal material
The strain EGF15-0-3 was isolated from the soft coral (specimen was not identified, No. SYDLD-15) collected from Sanya Bay of South China Sea, Peopleʼs Republic of China, in March 2012. The fungus was identified as Aspergillus sp. by morphological characteristics and sequence analysis of the ITS region (GenBank accession no. FJ941865.1). A voucher strain EGF15-0-3 was deposited at the Laboratory of Marine Natural Products, Guangzhou University of Chinese Medicine, Guangzhou, P. R. China.
4.3
Fermentation, extraction and isolation
4.3.1
Fermentation, extraction and isolation of Aspergillus sp. EGF15-0-3
The fungus Aspergillus sp. EGF15-0-3 was cultured in the Erlenmeyer flasks each with 50 mL of PDB liquid medium (containing 20.0 g/L glucose, 200.0 g/L potato, and 30.0 g/L sea salt), and then cultured in PDB liquid nutrient medium shaking at 165 r/min for 2 d at 28 ℃ to yield seed culture. The seed culture was transferred aseptically to different media that have been prepared beforehand. The total amount of culture media (liquid, rice and bioconversion media) was 2 L for GNPS analysis. The total amount of PDB medium was 220 L for isolation and purification of secondary metabolites. The cultures were incubated at 28 ℃ under static conditions for 60 d.
Detailed extraction process of fungus EGF15-0-3 from different media and the weight of the extracts of mycelia and broth of different media are in Table S4.
Isolation process of subergorgic acid and 2-deoxy-2β- hydroxysubergorgic acid from fungus EGF15-0-3 on the PDB medium can be found in Supplementary Information (Figure S1, Figure S2).
The soft coral (No. SYDLD-15) was extracted with EtOH (500 mL) at room temperature, the crude extract was concentrated and diluted with distilled water (200 mL), then extracted with an equal volume of EtOAc and n-BuOH, respectively. Four different polar fractions of soft coral (No. SYDLD-15, 100 g) were EtOH (0.6071 g), EtOAc (0.1161 g), n-BuOH (0.8051 g) and H2O (3.4715 g) fractions.
4.4
Molecular networking
EtOAc extracts of 23 media, different polar fractions of soft coral (No. SYDLD-15) (1.0 mg/mL in CH3OH), subergorgic acid (100 ng/mL in CH3OH), and 2-deoxy-2β- hydroxysubergorgic acid (100 ng/mL in CH3OH) were used for GNPs analysis. The samples were analyzed by Time-of-flight mass spectrometer (Triple TOFTM 5600+systems, AB SCIEX, USA) which was attached to a Triple TOFTM 5600+Autosampler-Plus, a LC-Pump-Plus, and a PDA-Plus system.
An ESI source operating in negative ionization mode was used. Mass spectra were acquired between m/z 100 and 2000. Instrumental parameters were set as follows: ion spray voltage floating (ISVF): 4500V, ion source temperature (TMP): 550 ℃, collision energy (CE): 45 eV, collision energy spread (CES): 15 eV, declustering dotential (DP): 100 V, ion source gas 1 (GS1): 379 Pa, ion source gas 2 (GS2): 379 Pa, curtain gas (CUR): 241 Pa.
Separation was achieved by using an octadecyl silica gel column (Phenomenex Lurna@ 5 μm C18 column (4.6 mm×100 mm, 5 µm, USA). The column oven temperature was set at 40 ℃. Elution was conducted with a gradient mobile phase consisting of water and ACN, specifically, 10%~30% ACN/H2O at 0~2.5 min, 30%~90% ACN/H2O at 2.5~11.5 min, then maintaining 100% ACN for another 3.5 min at a flow rate of 0.7 mL/min. The injection volume was fixed at 3 μL.
The LC-MSn analysis of the EtOAc extract and the reference MS/MS spectra were deposited in GNPS (http://gnps.ucsd.edu), the results were visualized in Cytoscape 3.7.2 (www.cytoscape.org). A molecular network was created using the online workflow at GNPS. The data was clustered with MS-Cluster with a parent mass tolerance of 0.02 Da and a MS/MS fragment ion tolerance of 0.02 Da to create consensus spectra. A network was created where edges were filtered to have a cosine score above 0.7 and more than 6 matched peaks. The data were then imported into Cytoscape and displayed as a network of nodes and edges. The relative abundance of detected molecule can be visualized in each node with a pie chart diagram (colors correspond to the different samples), and the edge thickness attribute was defined to reflect cosine similarity with thicker lines indicating higher similarity.
Supporting Information Detailed descriptions of the experimental procedure, and NMR, MS and CD spectra for subergorgic acid and 2-deoxy-2β-hydroxysubergorgic acid. This materials can be downloaded for free from our website (http://sioc-journal.cn/)
[1]
Wu, Z. D.; Yao, Z. N.; Long, K. H. Acta Sci. Nat. Univ. Sunyatseni1982, 21, 69(in Chinese). (巫中德, 姚仲年, 龙康侯, 中山大学学报, 1982, 21, 69.)
[2]
Niu, L. W.; Dai, J. B.; Wan, Z. L.; Liang, D. C.; Wu, Z. D.; Yao, Z. N.; Long, K. H. Sci. China1985, 15, 709(in Chinese). (牛立文, 戴金璧, 万柱礼, 梁栋材, 巫中德, 姚仲年, 龙康侯, 中国科学, 1985, 15, 709.)
[3]
Groweiss, A.; Fenical, W.; He, C. H.; Clardy, J.; Yao, Z. N.; Long, K. H. Tetrahedron Lett.1985, 26, 2379. doi: 10.1016/S0040-4039(00)94832-9
[4]
Chen, B. H.; Jiao, K. F.; Ji, Q. E.; Song, H. Q.; Feng, R. Chin. Sci. Bull.1990, 38, 142(in Chinese). (陈邦华, 焦克芳, 纪庆娥, 宋鸿锵, 冯锐, 科学通报, 1990, 38, 142.)
[5]
Huang, Q. X.; Cheng, W.; Long, H. L.; Liu, H. G.; Ofwegen, L. V.; Lin, W. H. Helv. Chim. Acta2015, 98, 1202. doi: 10.1002/hlca.201500086
[6]
Wu, Z. D.; Peng, Y. C.; Lu, H. N.; Huang, H. P.; Long, K. H. Acta Sci. Nat. Univ. Sunyatseni1987, 26, 104(in Chinese). (巫中德, 彭映才, 陆慧宁, 黄红平, 龙康侯, 中山大学学报, 1987, 26, 104.)
[7]
Chen, B. H.; Jiao, K.F. Chin. J. Med. Chem.1991, 2, 1(in Chinese). (陈邦华, 焦克芳, 中国药物化学杂志, 1991, 2, 1.)
Fan, B.; Parrot, D.; Blümel, M.; Labes, A.; Tasdemir, D. Mar. Drugs2019, 17, 1.
[34]
Tran-Cong, N. M.; Mándi, A.; Kurtán, T.; Müller, W. E. G.; Kalscheuer, R.; Lin, W. H.; Liu, Z.; Proksch, P. RSC Adv. 2019, 9, 27279. doi: 10.1039/C9RA05469C
[35]
Huang, L. H.; Xu, M. Y.; Li, H. J.; Li, J. Q.; Chen, Y. X.; Ma, W. Z.; Li, Y. P.; Xu, J.; Yang, D. P.; Lan, W. J. Org. Lett. 2017, 19, 4888. doi: 10.1021/acs.orglett.7b02238
[36]
Yang, J. Y.; Sanchez, L. M.; Rath, C. M.; Liu, X.; Boudreau, P. D.; Bruns, N.; Glukhov, E.; Wodtke, A.; de Felicio, R.; Fenner, A.; Wong, W. R.; Linington, R. G.; Zhang, L.; Debonsi, H. M.; Gerwick, W. H.; Dorrestein, P. C. J. Nat. Prod.2013, 76, 1686. doi: 10.1021/np400413s
[37]
Nothias, L. F.; Nothias-Esposito, M.; da Silva, R.; Wang, M.; Protsyuk, I.; Zhang, Z.; Sarvepalli, A.; Leyssen, P.; Touboul, D.; Costa, J.; Paolini, J.; Alexandrov, T.; Litaudon, M.; Dorrestein, P. C. J. Nat. Prod.2018, 81, 758. doi: 10.1021/acs.jnatprod.7b00737
[38]
Tao, Y. W.; Li, P. L.; Zhang, D. J.; Glukhov, E.; Gerwick, L.; Zhang, C.; Murray, T. F.; Gerwick, W. H. J. Org. Chem.2018, 83, 3034. doi: 10.1021/acs.joc.8b00028
图 1
Enlarged view of molecular network for the compounds 1 and 2 from Aspergillus sp. EGF15-0-3 in different media
The relative abundance of detected molecule can be visualized in node with a pie chart diagram (colors correspond to the different samples), and the edge (the grey line) thickness attribute was defined to reflect cosine similarity scores, with thicker lines indicating higher similarity
图 2
Molecular network generated from direct infusion of extracts sampling of 23 different media of Aspergillus sp. EGF15-0-3 and 2 known compounds
The inlaid portions of the network were rearranged in cytoscape for easier visualization of node connectivity and annotation. The color of the node corresponds to the origin of the sample, and the thickness of the edge reflects the similarity defined by the cosine score. The size of the node is reflective of the relative amount of the indicated compounds

 下载:
下载:

 下载:
下载:


