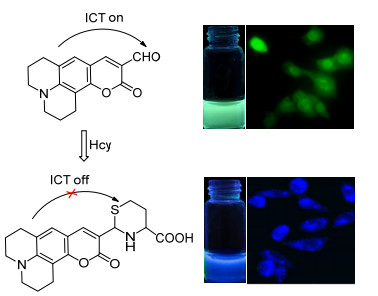
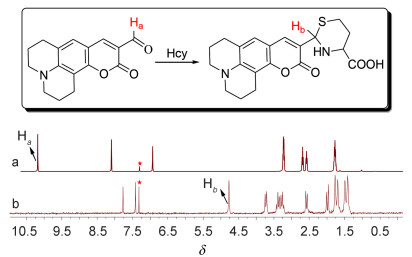
Scheme 1.
Structure of probe C2 and its sensing process towards Hcy

In recent decades, the progress in chemosensors for biological thiols including cysteine (Cys) and homocysteine (Hcy) has been fuelled from the biological and pharmacological stand points.[1] On the one hand, an abnormal level of cysteine is implicated in diseases such as skin lesions, liver damage, slowed growth, and an elevated level of homocysteine is a risk factor for Alzheimer's and cardiovascular diseases on the other.[2] Thus, the development of efficient methods for the detection and quantification of biological thiols under physiological conditions becomes an increasing demand in both chemistry and medicine field. Various methods have been used previously to analyze biological thiols, especially, fluorescence detection is advantageous in terms of their simplicity of implementation, high sensitivity, specificity, as well as rapid response, offering application methods both for in vitro assays and in vivo imaging studies.[3] Most of the reported fluorescent probes for bio-thiol are based on fluorescence measurement at a single wavelength, which may be influenced by variations in the sample environment. By contrast, ratiometric fluorescent approach can enable the measurement of emission intensities at two different wavelengths, providing a built-in correction for environmental variations. Therefore, this type of probes can acquire accurate results and also increase the dynamic range of fluorescence measurement.[4] For practical use in ratiometric measurement, an ideal fluorescent probe should exhibit a large emission wavelength shift (> 80 nm). Clearly, it is still challenging to acquire such a probe for Cys/Hcy.[5]
Generally, it is challenging to judiciously design fluorescent chemosensor in the context of thiols coordination due to their structural features. As a potential sensing system, specific chemical reaction-based probes, coined here as "reactive probe", can provide us versatile means with superior selectivity and have been the center of interest. Large number of optical probes for biological thiols has been constructed by virtue of its unique nucleophilic reactivity, involving Michael addition, [6] cleavage reactions by thiols, [7] imine formation, [8] and so on. Among these strategies, the unique cyclization with aldehyde is actively exploited as an interesting platform for the design of reactive chemosensors for thiols.[9] The different electronic properties between the initial aldehyde group and resultant thiazolidines or thiazinanes could induce different intramolecular charge transfer (ICT) efficiency and optical properties consequently, in and without the presence of thiols. However, many of them are associated with some limitations, including limited pH range, long response time, small emission wavelength shift, no difference to Cys and Hcy, especially the defect in bioimaging.
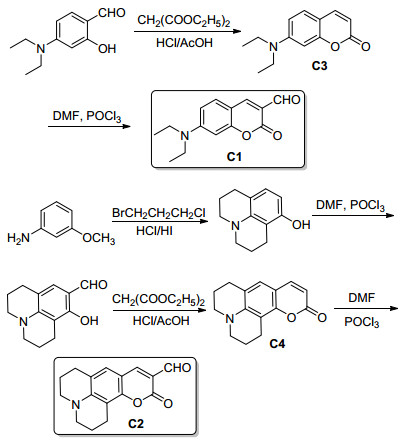
Here, we expected to develop novel ratiometric fluorescent chemosensors for Cys/Hcy through the convenient modulation of ICT efficiency. To the end, compounds C1 and C2 were synthesized composed of coumarin chromophore and aldehyde group. The coumarin moiety was selected for two reasons as follows. On one hand, it could act as the fluorescent signaling unit due to its excellent optical properties such as relatively high quantum efficiency and favorable solubility in water. On the other hand, it was expected to function as an electron donor in the ICT process, which was the key to the success of this strategy.[10] The aldehyde group was chosen to function as an electron acceptor and a putative thiols-dependent reactive subunit. It was expected that upon the addition of Cys/Hcy, the adduct subunit was deconjugated from the coumarin moiety, leading to the switched off ICT process and dramatic fluorescent changes consequently (Scheme 1). Herein, we would like to describe the new optical probe for Cys/Hcy in detail, featuring advantages such as relative good solubility in aqueous media, easy-to-make, rapid optical response, large emission and absorption shift, good ratiometric response, as well as the successful application in bioimaging of living cells.
The synthetic route to compounds C1~C4 was depicted in Scheme 2. It was easily seen that the target compounds C1 and C2 were prepared conveniently through the general Vilsmeier reactions. The whole synthetic route was very simple, and the purification was very easy. Compounds C1 and C2 exhibited good solubility in common organic solvents, such as DMF, CHCl3, CH2Cl2, CH3CN, acetone, THF etc. Target compounds were characterized by spectroscopic methods, and all gave satisfactory spectral data.
Before the sensing experiment, the fluorescent properties of aldehyde C1 in different ratio of DMSO and HEPES were firstly investigated. The solution of C1 emitted strong green fluorescence in pure DMSO. However, the emission intensity at about 495 nm decreased dramatically even with a little portion of H2O, while it kept almost stable with the continued increasing of H2O. The above result was consistent with the literature: if an aldehyde group was introduced to coumarin, the luminescence of the resultant compound would be nearly completely quenched in polar solvents.[11] It was apparent that with 10% DMSO, the largest fluorescence difference on C1 and C1+Hcy could be achieved. As a result, a reaction medium of HEPES buffer containing 10% DMSO was chosen in the titration experiment to detect biological thiols with "turn-on" fluorescent method.
The specificity of probe C1 was firstly examined under the same conditions. Both Cys and Hcy could react with the aldehyde group in probe C1 to induce obvious emission spectra changes, attributed to the nucleophilicity of the nitrogen and sulfur atoms in Cys and Hcy. Especially, Hcy, which has the least bulky thiol group, [9b] gave much higher fluorescent signal enhancement than Cys. Whereas other amino acids including Ala, Arg, Asn, Asp, Val, Glu, Gln, Gly, His, Ile, Leu, Lys, Met, Phe, Pro, Ser, Thr, Trp, Tyr and GSH, no significant changes could be obtained due to lack of nucleophilic sulfur. The above results indicated that C1 had much higher selectivity for Hcy than other amino acids examined here. Accordingly, Hcy was added into the diluted solution of probe C1 and its fluorescent response towards Hcy was investigated in detail. As shown in Figure 1, increasing the concentration of Hcy, excitingly, the emission displayed apparent increase companying with a slight blue-shift of the emission spectra (from 500 nm to 495 nm). It was noteworthy that in the presence of as low as 10 μmol/L Hcy, the sensing system displayed obvious fluorescence changes, indicating that probe C1 had rather high sensitivity towards Hcy. When 20 equiv. of Hcy was added, the emission intensity at 495 nm reached the maximum with about 30-fold enhancement (I/I0-1). Moreover, this fluorescence difference of the solution of C1 before and after the addition of Hcy could be easily distinguished by the naked eyes. As displayed in the inset of Figure 1, under a normal UV lamp, the solution changed from nearly non-luminescence to strongly green emission with the quantum yield increasing from 0.02 to 0.51[12].
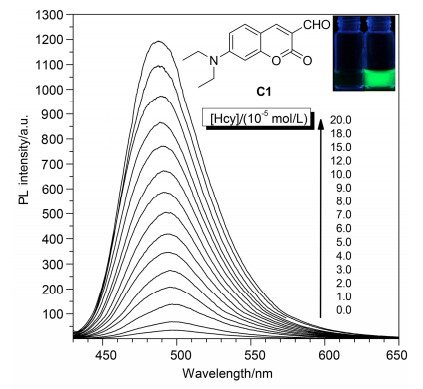
Inset: structure of probe C1 and fluorescent photograph of C1 and C1+Hcy
From the above experimental results, it was a pity that compound C1 could only act as a thiols chemosensor with "turn-on" fluorescent method. Through subtle structure adjustment, aldehyde C2 was designed and expected to efficiently sense thiols with ratiometric response. First of all, experimental conditions including the reaction media, pH value, as well as the time course were optimized. Considering the solubility of compound C2 in water, a portion of DMSO was added as a co-solvent. The emission spectra of C2 and C2+Hcy demonstrated different changes with the increasing fraction of H2O, possibly because of their different solubility in different media. With 10% DMSO, two well-separated emission peaks before and after the addition of Hcy could be obtained with the maximum ratiometric value of I450/I550. Therefore, a reaction medium of 10 mmol/L HEPES buffer containing 10% DMSO was chosen as the test condition in order to develop ratiometric fluorescence probe as mentioned above. It was depicted the effect of pH values on the emission intensities of C2 and C2+Hcy. It was obvious that the detection of C2 for Hcy could be operated in a wide pH range of 5.8~10.0. In the titration experiment, the pH of 7.4 was chosen by using the HEPES buffer for the purpose of physiological application. Since the optical signal changes relied on the chemical reaction between C2 and Hcy, the influence of the reaction rate on the sensing results was investigated. Upon treatment with Hcy (100 μmol/L), a more than 500-fold enhancement (from 11 to 5500) in the fluorescence intensity at 450 nm was detected within the first 5 min, indicating a high initial reaction rate of C2 by the nucleophilic Hcy. After 8 min the change on emission intensity leveled off. With the addition of the same concentration of Cys or GSH, a plateau of fluorescent intensity could be achieved after 12 minutes. Therefore, an assay time of 12 min was selected in the evaluation of the selectivity and sensitivity of C2 towards thiols in subsequent studies.
The sensing behavior of C2 towards Hcy was investigated carefully under the optimized condition. As shown in Figure 2, excitingly, the maximum emission wavelength of compound C2 shifted from 550 nm to 450 nm with the increasing concentration of Hcy. Actually, even at the concentration of Hcy as low as 1.0 μmol•L-1, apparent spectra changes could be observed with respect to the blank solution. It was noteworthy that the difference in the two emission wavelengths was large enough (emission shift: Δλ=100 nm) to accurately measure the intensities of two emission peaks and then obtain a huge ratiometric value. Actually, in the presence of 30 μmol/L of Hcy, a ca. 240-fold enhancement in the ratiometric value of I450/I550 was achieved with respect to the Hcy-free solution (from 0.02 to 4.83). To see the sensing process more visually, we compared the intensities at different wavelengths of 550 and 450 nm. As shown from the inset of Figure 2, there was a good linear relationship between intensity change and concentration of Hcy, which would be beneficial to the quantitative determination of thiol concentrations. Correspondingly, the luminescence color changed from green to blue (Figure 2, Inset), which could be easily distinguished by the naked eyes under the aid of a normal UV lamp. Thus, probe C2 could efficiently sense thiols with ratiometric response as expected.
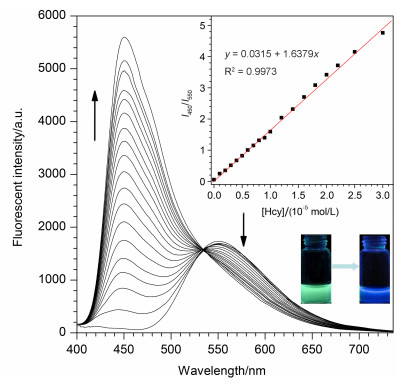
[Hcy]/(10-5 mol/L): 0, 0.1, 0.2, 0.3, 0.4, 0.5, 0.6, 0.7, 0.8, 0.9, 1.0, 1.2, 1.4, 1.6, 1.8, 2.0, 2.2, 2.5, 3.0. Inset: plot of emission intensity of probe C2 (10-5 mol•L-1) centered at 450/550 nm in the presence of different concentrations of Hcy; fluorescent photograph of C2 and C2+Hcy
In addition, probe C2 was applied to estimate the total concentration of thiols in commercial human blood plasma. According to the literature procedure, [13] triphenyl- phosphine was used as a reducing agent to convert disulfides to free thiols. 500 μL of reduced blood plasma was then added directly to 10 mL of probe C2 (10 μmol/L, DMSO/HEPES=1/9) and the effect on the total volume of solution induced by the addition of human blood plasma was negligible. The resulting solution was shaken well. After 15 min, the fluorescence intensity changes were recorded at room temperature. Apparent emission spectra changes could be observed with the ratiometric value of I450/I550 as 2.89. According to the equation of linear regression in the inset of Figure 2, the added thiols in the sensing system was measured to be ca. 1.75×10⁻⁵ mol•L-1. Correspondingly, the total content of thiols in the plasma was calculated to be ca. 350 μmol/L, which was well within the range of reported thiol concentrations from normal human blood plasma.[14]
Furthermore, the detection limit was calculated based on the fluorescence titration with the concentration of C2 as 2 μmol/L. To determine the S/N ratio, the emission intensity of C2 without Hcy was measured by 10 times and the standard deviation of blank measurements was determined. Under the present conditions, a good linear relationship between the fluorescence intensity at 450 nm and the Hcy concentration could be obtained in the concentration range of 0~5.0 μmol/L (R2=0.9981). The detection limit was then calculated with the equation: detection limit=3σ/k, where σ was the standard deviation of blank measurements, k is the slope from the plot. Accordingly, the detection limit of probe C2 was calculated to be as low as 2.8×10⁻⁷ mol/L.[15] By virtue of the nucleophilic reactivity of Cys/Hcy, many fluorescent chemodosimeters with excellent performance have been reported on the basis of special chemical reaction.[16~26] It was clear that the performance of probe C2 was among the best results of the fluorescent chemosensors with the nucleophilic reaction-based sensing approach.
To assess the specificity of probe C2 for Hcy over other small-molecular-weight biological thiols (e.g. Cys and GSH), the concentration-dependent ratio changes of probe C2 upon treatment with Cys or GSH under the same condition were examined. The emission ratio (I450/I550) displayed a very slight variation from 0.05 to 1.20 with the addition of 30 μmol•L-1 of Cys, only 24-fold variation. Furthermore, under the similar conditions, this probe exhibited essentially no ratiometric response to GSH, and the emission ratio displayed a negligible change from 0.05 to 0.36 even in the presence of GSH as 300 μmol•L-1, only a 7.2-fold variation. By sharp contrast, Hcy (30 μmol/L) elicited a large emission ratio jump from 0.02 to 4.83, a 240-fold enhancement as discussed above. These comparative studies clearly demonstrated that compound C2 was an excellent Hcy-specific ratiometric fluorescent probe. From the time-dependent ratio changes of C2, it was clear that the reaction rate between C2 and biological thiols followed the order: Hcy > > Cys > GSH, consistantly with both the selectivity order and sterical bulky order.[27] Furthermore, these experimental results were in keeping with the case in probe C1, indicating that this type of fluorescent probes was able to differentiate thiols by virtue of different steric bulk and addition reaction rate.
To further understand the specificity of probe C2 towards Hcy, other amino acids were examined in parallel under the same conditions. As shown in Figure 3, the reaction of C2 with Hcy gave apparent fluorescent changes, which could be easily observed by naked eyes under a normal UV lamp (as displayed in the inset fluorescence photograph in Figure 3); except the slight disturbance from Cys, whereas other amino acids such as Ala, Arg, Asn, Asp, Val, Glu, Gln, Gly, His, Ile, Leu, Lys, Met, Phe, Pro, Ser, Trp, Thr, Tyr as well as GSH showed negligible changes. The high selectivity of probe C2 was due to the fact that both Hcy and Cys could react with the aldehyde group in C2, attributable to the nucleophilicity of both the nitrogen and sulfur atoms in Cys and Hcy; whereas other amino acids, without the nucleophilic sulfur, could not conduct this chemical reaction.
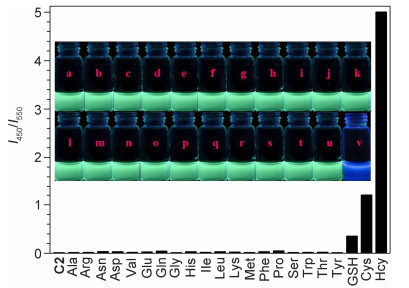
Inset: Photograph of C2 in the presence of various amino acid. Hcy: 30 mol•L-1, Cys: 30 μmol/L, others: 300 μmol/L. a~v: C2+Ala, Arg, Asn, Asp, Val, Glu, Gln, Gly, His, Ile, Leu, Lys, Met, Phe, Pro, Ser, Trp, Thr, Tyr, GSH, Cys and Hcy
Recently, colorimetric sensors are especially promising because the color change can be easily observed by naked-eyes, thus requiring less labor and no equipment[28]. Therefore, the colorimetric behavior of C2 was also investigated under the same conditions. With the increasing concentrations of Hcy, the absorption band of C2 at 455 nm gradually decreased along with the appearance of a new absorption band centered at about 360 nm. Actually, apparent change in absorption occurred even on the addition of as little as 20 μmol/L Hcy. The new absorption at 360 nm was responsible for the color change (from yellow to colorless) and perceptible to the naked eyes.
Prompted by the good sensing performance of C2 towards Hcy, the application of C2 to track intracellular Hcy levels was also conducted via a scanning microscopy. First of all, the cytotoxicity of C2 on HeLa cells was determined by conventional MTT assay. Upon exposure to 20 μmol/L concentration of C2 (concentration used for imaging studies in Figure 4) for 12 h, about 90% of the cells remained viable. This nullified the possibility of any significant cytotoxic influence of the reagent C2 on HeLa cells. As shown in Figure 4, the C2-loaded cells showed intracellular fluorescence at the green channel, indicating that compound C2 could penetrate the cell membrane and be used for fluorescent imaging of Hcy in living cells potentially. Before the fluorescent imaging experiment, Hela cells were stained with C2 (20 μmol•L-1) for 30 min followed by subsequent treated with 30 μmol•L-1 Hcy for another 20 min, and then washed with phosphate-buffered saline (PBS, 10 mmol•L-1, pH 7.12) for three times. By virtue of a scanning microscopy, it could be observed that the mean intensity of the emission collected at the green channel decreased, whereas the intensity collected at the blue channel increased. Accordingly, the blue and green fluorescence images of C2 and C2+Hcy were monitored and the mean blue to green intensities (FB/FG) were found to be 0.26 and 6.40 ratio using software package provided by OLYMPUS instruments, respectively. The bright-field images (Figures 4c and 4f) confirmed that the cells were viable throughout the imaging experiments. The imaging experiment results were consistent with the observations in titration experiments, and demonstrated that probe C2 could readily sense Hcy in cells with ratiometric fluorescent methods.
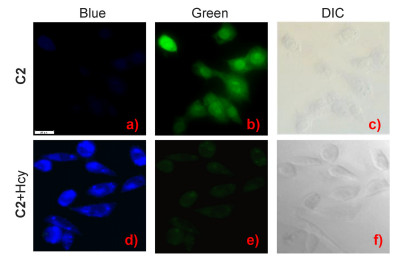
(a, d) fluorescence at the blue emission channel, (b, e) fluorescence at the green emission channel, and (c, f) bright field images. Scale bar: 20 μm
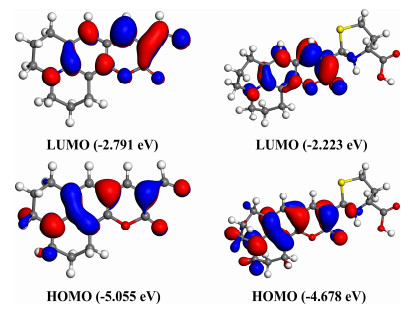
To get an insight into the molecular structure and the different fluorescence and absorption behaviors before and after the addition of Hcy, density functional theory (DFT) calculations were carried out at the PBE/DNP level using DMol3 program.[29] The calculated HOMOs and LUMOs of compound C2 and C2+Hcy were illustrated in Figure 5. The corresponding energy gaps between HOMO and LUMO were calculated to be 2.264 and 2.455 eV for C2 and C2+Hcy, respectively, which were in agreement with the remarkable blue-shift in both luminescence and absorption spectra of homocysteine adduct to that of C2. It was clear that the ICT took place through a conjugated bridge between the electron donor moieties and aldehyde group in compound C2, while this was obviously prohibited in the resultant thiazinane ring after the reaction with Hcy, leading to the different ICT efficiency and consequent optical behaviors before and after the addition of Hcy.
To explore the sensing mechanism of probe C2 to Hcy, the reaction mixture of C2 with Hcy was characterized by ESI-MS spectrometry. The ESI-MS spectrum of C2 revealed a main peak at 270.3 before the addition of homocysteine, corresponding to the species [C2+H]+/ (m/zcalcd=270.1). After addition of excess Hcy and incubation for 30 min, a major peak at about m/z 386.8 appeared coinciding exactly with that for the adduct species [C2+Hcy+H]+ (m/zcalcd=387.1). To further confirm this trans- formation, the reaction mixture of C2 with Hcy was also characterized by 1H NMR spectrometry. As shown in Figure 6, the resonance signal corresponding to the aldehyde proton (Ha) at about δ 10.10 disappeared; while a new peak at δ 4.80 assigned to the proton Hb emerged, confirming the formation of the aldehyde-hydrogen sulfite adduct. Meanwhile, a series of new signals at about δ 1.30~2.10 appeared ascribed to the saturated proton in the thiazinane ring, conforming the formation of homocysteine adduct. Therefore, all these data indicated that the reaction most likely followed the proposed mechanism as shown in Scheme 1.
In summary, two novel aldehyde functionalized coumarin fluorescent probes C1 and C2 towards biological thiols were constructed. The two probes displayed totally different sensing performance in spite of the slight structural differences. In terms of probe C1, it displayed remarkable fluorescence enhancement with the addition of Hcy/Cys. However, C2 displayed ratiometric fluorogenic and chromogenic response, and the change in fluorescence ratio (I450/I550) was over 240-fold with the detection limit as low as 2.8×10⁻⁷ mol/L. Density functional theory (DFT) calculations were carried out to compare the molecular structure and the different fluorescence and absorption behaviors before and after the addition of Hcy into the solution of C2. Moreover, C2 was successfully applied to microscopic imaging for the detection of Hcy in HeLa cells with ratiometric fluorescent methods. The results reported in this work might provide some useful information for the design of new reactive probe, that was to say, the subtle adjustment on the chemical structure could dramatically affect the sensing performance. Further study on the design of probe for biological thiols with better performance was still in progress.
Ethanol was dried over and distilled from Na under an atmosphere of dry nitrogen. N, N-Dimethylfomamide (DMF) was dried over and distilled from CaH2 under an atmosphere of dry nitrogen. Proteins including Ala, Arg, Asn, Asp, Val, Glu, Gln, Gly, His, Ile, Leu, Lys, Met, Phe, Pro, Ser, Thr, Trp, Tyr, GSH, Cys and Hcy were purchased from Sigma-Aldrich Chemical Company. All solvents and other reagents were of analytical grade and purchased from Shanghai Chemical Reagent Co. (Shanghai, China) used without further purification. Doubly distilled water was used in all experiments.
1H NMR and 13C NMR spectra were measured on an Varian Mercury300 and Bruker500 spectrometer using tetramethylsilane (TMS, δ 0) as internal standard. The ESI mass spectra were measured on a Finnigan LCQ advantage mass spectrometer. Melting points were measured on a Beijing Taike XT-4 microscopy melting point apparatus, and the thermometer was uncorrected. Elemental analyses were performed by a CARLOERBA-1106 microelemental analyzer. The pH values were determined by using a DELTA 320 PH dollar. UV-Vis spectra were obtained using a Shimadzu UV-2550 spectrometer. Photoluminescence spectra were performed on a Hitachi F-7000 fluorescence spectrophotometer. Compounds C3 and C4 were synthesized through the reported method.[30]
Fresh distilled DMF (1 mL) was added dropwise to POCl3 (1 mL) at 20~50 ℃ with N2 atmosphere and stirred for 30 min to yield a red solution. This solution was combined with a portion of C3 (750 mg, 3.5 mmol, dissolved in 5 mL of DMF) to yield a scarlet suspension. After stirring at room temperature for 30 min, the solution was heated at 60 ℃ for an additional 12 h. The solution mixture was slowly added to ice water (50 mL), and then NaOH solution (20%) was added to adjust pH of the solution to ca. 7 to yield a precipitate. The resulting solid was collected by filtration and recrystallized in absolute ethanol to give compound C1 766 mg, yield 89%. Yellow solid, m.p. 165~167 ℃; 1H NMR (300 MHz, CDCl3) δ: 1.24~1.28 (t, J=6.0 Hz, 6H), 3.44~3.51 (q, J=7.0 Hz, 4H), 6.49 (s, 1H), 6.63~6.66 (d, J=9.0 Hz, 1H), 7.40~7.43 (d, J=9.0 Hz, 1H), 8.26 (s, 1H), 10.13 (s, 1H); 13C NMR (75 MHz, DMSO-d6) δ: 12.1, 44.3, 96.1, 107.4, 110.2, 112.9, 132.9, 145.9, 153.2, 158.2, 160.5, 186.9; MS (ESI) m/z: 246.5 [M+H]+. Anal calcd for C14H15NO3 C 68.29, H 6.19, N 5.68; found C 68.56, H 6.16, N 5.71.
10-Oxo-2, 3, 5, 6-tetrahydro-1H, 4H, 10H-11-oxa-3a-aza-benzo[de]anthracene-9-carbaldehyde (C2): Gained as an orange solid according to the similar procedure to compound C1. Yield 83%, m.p. 183~185 ℃; 1H NMR (500 MHz, CDCl3) δ: 1.96~1.99 (m, 4H), 2.73~2.77 (t, J=10.0 Hz, 2H), 2.84~2.87 (t, J=7.5 Hz, 2H), 3.35~3.39 (t, J=10.0 Hz, 4H), 6.93 (s, 1H), 8.06 (s, 1H), 10.06 (s, 1H); 13C NMR (125 MHz, CDCl3) δ: 19.8, 20.8, 27.2, 49.9, 50.3, 106.0, 108.0, 112.6, 119.8, 128.2, 144.8, 149.3, 153.7, 162.1, 187.8; MS (ESI) m/z: 270.3 [M+H]+. Anal calcd for C16H15NO3 C 71.09, H 5.63, N 5.17; found C 71.36, H 5.61, N 5.20.
A solution of C1/C2 (1×10⁻⁵ mol/L) was prepared in HEPES/DMSO (V:V=9:1, 10 mmol•L-1, pH=7.4). The solution of Hcy (1×10⁻² mol/L) and various amino acids (1×10⁻¹ mol/L) were prepared in doubly distilled water. The solution of C1/C2 was placed in a quartz cell (10.0 mm width) and the fluorescence spectrum was recorded. Each amino acid was introduced in portions and fluorescence intensity changes were recorded at room temperature each time. C1: excitation wavelength=380 nm; C2: excitation wavelength=400 nm.
A solution of C2 (2×10⁻⁵ mol/L) was prepared in HEPES/DMSO (V:V=9:1, 10 mmol•L-1, pH=7.4). The solution of Hcy (1×10⁻² mol/L) was prepared in distilled water. A solution of C2 (3.0 mL) was placed in a quartz cell (10.0 mm width) and the absorption spectrum was recorded. The Hcy solution was introduced in portions and absorption changes were recorded at room temperature each time.
Cytotoxicity of compound C2 on HeLa cells was determined by conventional methyl thiazolyl tetrazolium (MTT) assay. HeLa cells were seeded in the 24-well plate with a density of 6×10⁴ cells per well, and then incubated in 1 mL of DMEM containing 10% FBS (fetal bovine serum) for 1 day in an incubator (37 ℃, 5% CO2). Thereafter, different concentrations of compound C2 were added to each well for 1, 2, 4 and 12 h, respectively. Then the medium was replaced with 1 mL of fresh medium and 100 L of MTT (5 mg/mL in PBS buffer) solution and cells were further incubated at 37 ℃ for 4 h. Then the medium was removed and 750 L of DMSO was added. The absorbance was measured at 570 nm using a microplate reader (Bio-Rad, Model 550, USA). The relative cell viability was calculated as: cell viability (%)=(OD570sample/ OD570control)×100%, where OD570control and OD570sample were obtained in the absence and presence of C2, respectively.[31] The actual value was averaged from four independent experiments.
HeLa cells were seeded to the 24-well plates, and then the cells with an initial density of 5×10⁴ cells•well-1 were routinely maintained at 37 ℃ in a humidified 5% CO2 atmosphere using DMEM (Dulbecco's modified eagle's medium) supplemented with 10% fetal bovine serum and 1% penicillin-streptomycin for 24 h.
Fluorescence cell imaging was performed with an OLYMPUS IX73 scanning microscopy with a 40×objective lens. Fluorescence images of C2-loaded cells were monitored at 400~410 and 460~490 nm (the excitation wavelength) for blue and green channels, respectively. The data were analyzed using software package provided by OLYMPUS instruments. Before the image experiments, the cells were treated with C2 (20 μmol•L-1) for 20 min, followed by subsequent staining with 30 μmol•L-1 Hcy for another 20 min and then washed with phosphate-buffered saline (PBS, 10 mmol•L-1, pH 7.12) for three times. In the control experiment, the HeLa cells were treated only with C2 (20 μmol•L-1, 20 min) and then washed with phosphate-buffered saline (PBS, 10 mmol•L-1, pH 7.12) for three times.
Supporting Information 1H NMR and 13C NMR spectra of compounds C1 and C2, fluorescent spectra of C1, C1+Hcy, C2 and C2+Hcy with different fraction of H2O, selectivity of C1, reaction-time profile for C2 toward Hcy, Cys and GSH, fluorescent spectra of C2 toward Hcy, Cys and GSH, UV-vis spectra of C2 toward Hcy, cell viability of C2, ESI-mass changes of C2 with Hcy. These materials can be downloaded for free from Web site (http://sioc-journal.cn/).
(a) An, L.; Tang, Y.; Wang, S.; Li, Y.; Zhu, D. Macromol. Rapid Commun. 2006, 27, 993.
(b) Zhao, D.; Du, J.; Chen, Y.; Ji, X.; He, Z.; Chan, W. H. Macromolecules 2008, 41, 5373.
(a) Weerapana, E.; Wang, C.; Simon, G. M.; Richter, F.; Khare, S.; Dillon, M. B.; Bachovchin, D. A.; Mowen, K.; Baker, D.; Cravatt, B. F. Nature 2010, 468, 790.
(b) Reiser, J.; Adair, B.; Reinheckel, T. J. Clin. Invest. 2010, 120, 3421.
(c) Lin, J.; Lee, I. M.; Song, Y.; Cook, N. R.; Selhub, J.; Manson, J. E.; Buring, J. E.; Zhang, S. M. Cancer Res. 2010, 70, 2397.
(a) Wang, J.; Hu, L. J.; Shen, J.; Jiang, J. Q.; Yu, K. Y., Sun, R. G. Chin. J. Org. Chem. 2018, 38, 760(in Chinese).
(王军, 虎良军, 申婧, 姜吉泉, 郁科勇, 孙荣国, 有机化学, 2018, 38, 760.)
(b) Ding, S.; Liu, M.; Hong, Y. Sci. China Chem. 2018, 61, 12.
(c) Zhou, Y.; Yoon, J. Chem. Soc. Rev. 2012, 41, 52.
(d) Jung, H. S.; Chen, X.; Kim, J. S.; Yoon, J. Chem. Soc. Rev. 2013, 42, 6019.
(e) Yin, C.; Huo, F.; Zhang, J.; Martinez-Manez, R.; Yang, Y.; Lv, H.; Li, S. Chem. Soc. Rev. 2013, 42, 6032.
(f) Yang, Y.; Zhao, Q.; Feng, W.; Li, F. Chem. Rev. 2012, 113, 192.
(a) Zhang, M.; Xiao, H. F.; Han, Z. X.; Yang, L. Q.; Wu, X. Y. Chin. J. Org. Chem. 2018, 38, 926(in Chinese).
(张敏, 肖慧丰, 韩志湘, 仰榴青, 吴向阳, 有机化学, 2018, 38, 926.)
(b) Jiang, K.; Cao, L.; Hao, Z. F.; Chen, M. Y.; Cheng, J. L.; Li, X.; Xiao, Pi.; Chen, L.; Wang, Z. Y. Chin. J. Org. Chem. 2017, 37, 2221(in Chinese).
(蒋凯, 曹梁, 郝志峰, 陈美燕, 程洁銮, 李晓, 肖萍, 陈亮, 汪朝阳, 有机化学, 2017, 37, 2221.)
(c) Hou, S. H.; Qu, Z. G.; Zhong, K. L.; Bian, Y. J.; Tang, L. J. Chin. J. Org. Chem. 2016, 36, 768(in Chinese).
(侯淑华, 曲忠国, 钟克利, 边延江, 汤立军, 有机化学, 2016, 36, 768.)
(d) Srikun, D.; Miller, E. W.; Domaille, D. W.; Chang, C. J. J. Am. Chem. Soc. 2008, 130, 4596.
(e) Komatsu, K.; Urano, Y.; Kojima, H.; Nagano, T. J. Am. Chem. Soc. 2007, 129, 13447.
(f) Tremblay, M. S.; Halim, M.; Sames, D. J. Am. Chem. Soc. 2007, 129, 7570.
Kimura, E.; Koike, T. Chem. Soc. Rev. 1998, 27, 179. doi: 10.1039/a827179z
(a) Jung, H. S.; Han, J. H.; Pradhan, T.; Kim, S.; Lee, S. W.; Sessler, J. L.; Kim, T. W.; Kang, C.; Kim, J. S. Biomaterials 2012, 33, 945.
(b) Yuan, L.; Lin, W.; Yang, Y. Chem. Commun. 2011, 47, 6275.
(c) Jung, H. S.; Ko, K. C.; Kim, G. H.; Lee, A. R.; Na, Y. C.; Kang, C.; Lee, J. Y.; Kim, J. S. Org. Lett. 2011, 13, 1498.
(d) Kwon, H.; Lee, K.; Kim. H.-J. Chem. Commun. 2011, 47, 1773.
(e) Chen, X.; Ko, S. K.; Kim, M. J. Chem. Commun. 2010, 46, 2751.
(a) Yang, T.; Guo, Z.; Shao, A.; Zhao, P.; Zhu, W. Chin. J. Appl. Chem. 2016, 33, 397(in Chinese).
(杨婷婷, 郭志前, 邵安东, 赵平, 朱为宏, 应用化学, 2016, 33, 397.)
(b) Lee, M. H.; Han, J. H.; Kwon, P. S.; Bhuniya, S.; Kim, J. Y.; Sessler, J. L.; Kang, C.; Kim, J. S. J. Am. Chem. Soc. 2012, 134, 1316.
(c) Shao, J.; Sun, H.; Guo, H.; Ji, S.; Zhao, J.; Wu, W.; Yuan, X.; Zhang, C.; James, T. D. Chem. Sci. 2012, 3, 1049.
(d) Lim C. S.; Masanta, G.; Kim, H. J.; Han, J. H.; Kim, H. M.; Cho, B. R. J. Am. Chem. Soc. 2011, 133, 11132.
(e) Zhao, C.; Zhou, Y.; Lin, Q.; Zhu, L.; Feng, P.; Zhang, Y.; Cao, J. J. Phys. Chem. B 2010, 115, 642.
(a) Secor, K.; Plante, J.; Avetta, C.; Glass, T. J. Mater. Chem. 2005, 15, 4073.
(b) Zhou, Y.; Won, J.; Lee, J. Y.; Yoon, J. Chem. Commun. 2011, 47, 1997.
(a) Xiong, L.; Zhao, Q.; Chen, H.; Wu, Y.; Dong, Z.; Zhou, Z.; Li, F. Inorg. Chem. 2010, 49, 6402.
(b) Shiu, H. Y.; Chong, H. C.; Leung, Y. C.; Wong, M. K.; Che, C. M. Chem. Eur. J. 2010, 16, 3308.
(c) Li, H.; Fan, J.; Wang, J.; Tian, M.; Du, J.; Sun, S.; Sun, P.; Peng, X. Chem. Commun. 2009, 45, 5904.
(d) Lee, K. S.; Kim, T. K.; Lee, J. H.; Kim, H. J.; Hong, J. I. Chem. Commun. 2008, 44, 6173.
Tsai, M. S.; Hsu, Y. C.; Lin, J. T.; Chen, H. C.; Hsu, C. P. J. Phys. Chem. C 2007, 111, 18785. doi: 10.1021/jp075653h
Lee, K. S.; Kim, H. J.; Kim, G. H.; Shin, I.; Hong, J. I. Org. Lett. 2008, 10, 49. doi: 10.1021/ol7025763
Williams, A. T. R.; Winfield, S. A.; Miller, J. N. Analyst 1983, 108, 1067. doi: 10.1039/an9830801067
Wang, W.; Escobedo, J. O.; Lawrence, C. M.; Strongin, R. M. J. Am. Chem. Soc. 2004, 126, 3400. doi: 10.1021/ja0318838
Seshadri, S.; Beiser, A.; Selhub, J.; Jacques, P. F.; Rosenberg, I. H.; D'Agostino, R. B.; Wilson, P. W. F.; Wolf, P. A. N. Engl. J. Med. 2002, 346, 476. doi: 10.1056/NEJMoa011613
Dong, Y. S.; Liu, T. Q.; Wan, X. J.; Pei, H.; Wu, L. S.; Yao, Y. W. Sens. Actuator, B 2017, 241, 1139. doi: 10.1016/j.snb.2016.10.022
Yuan, L.; Lin, W. Y.; Yang, Y. T. Chem. Commun. 2011, 47, 6275. doi: 10.1039/c1cc11316j
Zhang, X.; Hang, Y. D.; Qu, W. S.; Yan, Y. C.; Zhao, P.; Hua, J. L. RSC Adv. 2016, 6, 20014. doi: 10.1039/C5RA25220B
Chen, F.; Chen, Z.; Sun, Y.; Liu, H.; Han, D.; He, H.; Zhang, X.; Wang, S. RSC Adv. 2017, 7, 16387. doi: 10.1039/C6RA28712C
Sun, Y.; Chen, M.; Liu, J.; Lv, X.; Li, J.; Guo, W. Chem. Commun. 2011, 47, 11029. doi: 10.1039/c1cc14299b
Li, H.; Jin, L.; Kan, Y.; Yin, B. Sens. Actuator, B 2014, 196, 546. doi: 10.1016/j.snb.2014.02.052
Qu, W. S.; Yang, L.; Hang, Y. D.; Zhang, X.; Qu, Y.; Hua, J. L. Sens. Actuator, B 2015, 211, 275. doi: 10.1016/j.snb.2015.01.117
Liu, X.; Niu, L.; Chen, Y.; Yang, Y.; Yang, Q. Biosens. Bioelectron. 2017, 90, 403. doi: 10.1016/j.bios.2016.06.076
Chen, X.; Ko, S. K.; Kim, M. J.; Shin, I.; Yoon, J. Chem. Commun. 2010, 46, 2751. doi: 10.1039/b925453f
Jung, H. S.; Ko, K. C.; Kim, G. H.; Lee, A. R.; Na, Y. C.; Kang, C.; Lee, J. Y.; Kim, J. S. Org. Lett. 2011, 13, 1498. doi: 10.1021/ol2001864
Shao, J.; Guo, H.; Ji, S.; Zhao, J. Biosens. Bioelectron. 2011, 26, 3012. doi: 10.1016/j.bios.2010.12.004
Long, L.; Lin, W. Y.; Chen, B.; Gao, W.; Yuan, L. Chem. Commun. 2011, 47, 893. doi: 10.1039/C0CC03806G
(a) Zhang, S.; Wright, J. E. I.; Bansal, G.; Cho, P.; Uludag, H. Biomacromolecules 2005, 6, 2800.
(b) Shiu, H. Y.; Wong, M. K.; Che, C. M. Chem. Commun. 2011, 47, 4367.
(a) Tatay, S.; Gavina, P.; Coronado, E.; Palomares, E. Org. Lett. 2006, 8, 3857.
(b) Palomares, E.; Vilar, R.; Durrant, J. R. Chem. Commun. 2004, 40, 362.
(a) Delley, B. J. Chem. Phys. 1990, 92, 508.
(b) Delley, B. J. Chem. Phys. 2000, 113, 7756.
Lin, Y.; Lin, W. Y.; Song, J. Z.; Yang, Y. T. Chem. Commun. 2011, 47, 12691. doi: 10.1039/c1cc15762k
(a) Qian, Z.; Shan, X.; Chai, L.; Ma, J.; Chen, J.; Feng, H. ACS Appl. Mater. Interfaces 2014, 6, 6797.
(b) Meng, Z.; Wu, S.; Zhong, L.; Zeng, M.; Sun, X.; Li, L.; Zhang, S. RSC Adv. 2018, 8, 38075.
(c) Liao, S.; Zhao, X.; Zhu, F.; Chen, M.; Wu, Z.; Song, X.; Yang, H.; Chen, X. Talanta 2018, 180, 300.

Figure 1 Fluorescent emission spectra of C1 (10-5 mol•L-1, DMSO/HEPES=1/9) in the presence of different concentrations of Hcy excited at 380 nm
Inset: structure of probe C1 and fluorescent photograph of C1 and C1+Hcy

Figure 2 Fluorescent emission spectra of C2 (10-5 mol•L-1, DMSO/HEPES=1/9) in the presence of different concentrations of Hcy
[Hcy]/(10-5 mol/L): 0, 0.1, 0.2, 0.3, 0.4, 0.5, 0.6, 0.7, 0.8, 0.9, 1.0, 1.2, 1.4, 1.6, 1.8, 2.0, 2.2, 2.5, 3.0. Inset: plot of emission intensity of probe C2 (10-5 mol•L-1) centered at 450/550 nm in the presence of different concentrations of Hcy; fluorescent photograph of C2 and C2+Hcy

Figure 3 Fluorescent intensity change profile of C2 (10 μmol/L, DMSO/HEPES=1/9) in the presence of various amino acid
Inset: Photograph of C2 in the presence of various amino acid. Hcy: 30 mol•L-1, Cys: 30 μmol/L, others: 300 μmol/L. a~v: C2+Ala, Arg, Asn, Asp, Val, Glu, Gln, Gly, His, Ile, Leu, Lys, Met, Phe, Pro, Ser, Trp, Thr, Tyr, GSH, Cys and Hcy

Figure 4 Image of HeLa cells incubated with C2 (a~c) and pre-treated with C2 and then further incubated with 30 μmol/L Hcy (d~f) for 20 min
(a, d) fluorescence at the blue emission channel, (b, e) fluorescence at the green emission channel, and (c, f) bright field images. Scale bar: 20 μm

 扫一扫看文章

扫一扫关注我们
 下载:
下载:

 下载:
下载:


