图 1.
局域表面等离子体共振示意图
Figure 1.
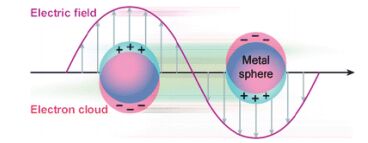
Illustration of localized surface plasmon resonance

生物传感是利用生物分子特异性识别来实现生物检测或成像的过程.生命科学的发展需要对生物体中的重要物质实现实时、在线、活体及原位检测, 对生物传感分析方法提出了新的要求.纳米技术的发展为生物传感提供了新的手段和机遇.纳米生物传感器通过纳米科技与生物传感器的融合实现了生物传感器结构的超微化, 结合纳米材料独特的光学以及电子特性, 在生物传感、医学诊断及治疗、分子生物学和细胞生物学取得了广泛的应用.
纳米光子学旨在利用光学近场作为信号载体, 纳米粒子作为器件材料的基本单元在纳米尺度研究光与物质的相互作用[1].纳米光子学的主要研究目的是突破衍射极限在亚波长尺度操纵光子行为[2].近年来, 基于纳米光子学的光学纳米天线、局域表面等离子体共振传感器以及表面增强光谱等技术, 在生物传感、纳米成像、医学诊断等领域取得了惊人的成就[3].
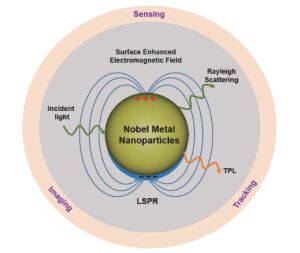
等离子体激元学是纳米光子学研究的一个重要分支.表面等离子体激元(SPs)是当光波(电磁波)入射到金属与介质分界面时, 金属表面的自由电子发生集体振荡行为[4].当表面等离子体激元被局域在粒径远小于入射光波长的金属纳米颗粒表面上时, 即可形成局域表面等离子体共振(LSPR)(图 1)[5]. LSPR效应赋予了贵金属纳米材料(金、银、铜)优异的物理、化学性质, 结合其良好的生物相容性、成熟的生物分子表面功能化修饰方法, 现已成为纳米传感和生物成像领域研究及应用的热点(图 2)[6].
本文将从贵金属局域表面等离子材料的性质出发, 按传感及成像策略分类探讨近年来局域表面等离子体材料在纳米传感及细胞成像中的研究进展, 并对贵金属局域表面等离子纳米传感器的未来发展前景做出展望.
对于小粒径球形金属纳米颗粒(d≪ λ)的局域表面等离子体共振的理论解释可追溯至20世纪初, 德国物理学家古斯塔夫•米(Gustav Mie)通过求解麦克斯韦(Maxwell)方程给出了描述球形金属纳米颗粒的消光、散射及吸收截面的数学公式[7]:
|
${\sigma _{{\rm{ext}}}} = \frac{{2\pi }}{{{{\left| k \right|}^2}}}\sum _{L = 1}^\infty (2L + 1)[R{\rm{e}}({a_L} + {b_L})]$ |
(1) |
|
${\sigma _{{\rm{sca}}}} = \frac{{2\pi }}{{{{\left| k \right|}^2}}}\sum\nolimits_{L = 1}^\infty {(2L + 1)(\left| {{a_L}} \right| + \left| {{b_L}} \right|)} $ |
(2) |
|
${\sigma _{{\rm{abs}}}} = {\sigma _{{\rm{ext}}}} - {\sigma _{{\rm{sca}}}}$ |
(3) |
式中, k为入射光(电磁波)波矢, L为散射极子(包括偶极散射、四极散射或多级散射).
|
${a_L} = \frac{{m{\psi _L}(mx)\psi _L^\prime (x) - \psi _L^\prime (mx){\psi _L}(x)}}{{m{\psi _L}(mx)\chi _L^\prime (x) - \psi _L^\prime (mx){\chi _L}(x)}}$ |
(4) |
|
${b_L} = \frac{{{\psi _L}(mx)\psi _L^\prime (x) - m\psi _L^\prime (mx){\psi _L}(x)}}{{{\psi _L}(mx)\chi _L^\prime (m) - m\psi _L^\prime (mx){\chi _L}(x)}}$ |
(5) |
其中, ψL和χL为黎卡迪-贝塞尔函数.
|
$(m = \widetilde n/{n_m})\widetilde n = {n_R} + i{n_I}$ |
nR和nI分别为金属材料折射率的实部和虚部, nm为周围介质环境折射率.
|
$x = {k_{\rm{m}}}r({k_{\rm{m}}} = 2\pi /{\lambda _{\rm{m}}})$ |
r为球形纳米颗粒粒径, km为入射光在介质环境中的波数.
对于粒径远小于入射光波长的球形金属纳米颗粒, x≪1, Eqs. 4, 5可以简化成以下形式:
|
${a_1} = - \frac{{i2{x^3}}}{3}\frac{{{m^2} - 1}}{{{m^2} + 2}}$ |
(6) |
|
${b_1} \approx 0$ |
(7) |
且其更高级数aL和bL可近似为零.
将Eqs. 6, 7代入Eqs. 1, 2可得球形金属纳米颗粒的消光和散射截面:
|
${\sigma _{{\rm{ext}}}} = \frac{{18\pi \varepsilon _{\rm{m}}^{3/2}V}}{\lambda }\frac{{{\varepsilon _2}(\lambda )}}{{{{[{\varepsilon _1}(\lambda ) + 2{\varepsilon _{\rm{m}}}]}^2} + {\varepsilon _2}{{(\lambda )}^2}}}$ |
(8) |
|
${\sigma _{{\rm{sca}}}} = \frac{{32{\pi ^4}\varepsilon _{\rm{m}}^2{V^2}}}{{{\lambda ^4}}}\frac{{({\varepsilon _1} - {\varepsilon _{\rm{m}}}) + {{({\varepsilon _2})}^2}}}{{{{({\varepsilon _1} + 2{\varepsilon _{\rm{m}}})}^2} + {{({\varepsilon _2})}^2}}}$ |
(9) |
式中, ε1、ε2和εm分别为金属材料介电常数的实部和虚部以及介质环境介电常数.
|
$\begin{array}{l} {\varepsilon _1} = n_{\rm{R}}^2 - n_{\rm{I}}^{\rm{2}}\\ {\varepsilon _2} = 2{n_{\rm{R}}} - {n_{\rm{I}}} \end{array}$ |
从Eq. 8可知, 球形金属纳米颗粒的消光截面在
需要指出的是, Eqs. 8, 9仅适应于小粒径金属纳米颗粒(d<10 nm)分析.米氏理论后经Gans[8]进一步完善, 并引入了纳米颗粒的形貌对其消光及散射性质的影响, 进一步拓展了米氏理论的应用范围:
|
${\sigma _{{\rm{ext}}}}(\lambda ) = \frac{{24{\pi ^2}{N_{\rm{A}}}{a^3}\varepsilon _{\rm{m}}^{3/2}}}{{\lambda \ln (10)}}[\frac{{{\varepsilon _{\rm{i}}}(\lambda )}}{{{{({\varepsilon _{\rm{r}}}(\lambda ) + \chi {\varepsilon _{\rm{m}}})}^2} + {\varepsilon _{\rm{i}}}{{(\lambda )}^2}}}]$ |
(10) |
式中, χ为纳米粒子的形貌因子, 其为颗粒长径比的函数, 对于球形纳米颗粒, χ=2.
贵金属纳米颗粒的局域表面等离子共振效应与纳米颗粒的尺寸、形貌、组成、周围环境折射率以及粒子间耦合作用密切相关[9].暗场显微镜(DFM)可在单颗粒水平上分析贵金属纳米颗粒的散射性质, 降低了传感分析检测限[10].本节内容将依据传感检测原理不同, 介绍贵金属纳米材料在传感领域的最新进展.
依据Mie理论, 贵金属纳米颗粒的等离子体共振频率与周围介质环境折射率密切相关.其散射光谱会随着折射率的变化发生位移. 1998年, Yee等首次提出了共振峰位移与周围介质环境折射率的关系(Eq. 11)[6c]:
|
$R = m\Delta \eta (1 - {e^{ - d/{l_d}}})$ |
(11) |
式中, R为周围介质环境引起的散射峰位移, m是折射率灵敏度(可通过实验测定), d是吸附层厚度, ld是表面等离子体激元电磁场衰减距离.该理论方程奠定了折射率变化相关传感器设计的理论基础.
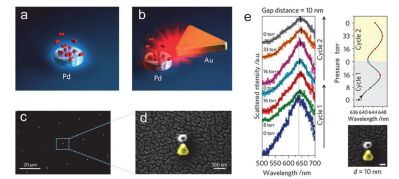
2011年, Alivisatos课题组[11]通过光刻法制备了金三角片-钯复合纳米结构, 并通过暗场光谱分析构建了一种基于等离子体“纳米天线”增强的气体传感器(图 3).金三角片(110 nm×40 nm)可实时感应钯纳米颗粒(60 nm×40 nm)在不同压力下对氢气的吸附和释放所引起的折射率变化.该方法可从单颗粒水平进行气体传感分析, 有效排除颗粒间差异性.
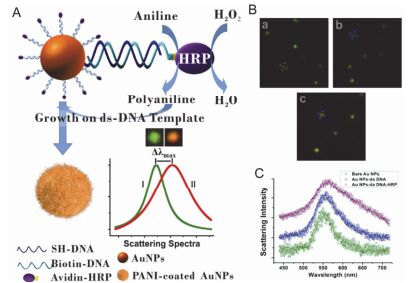
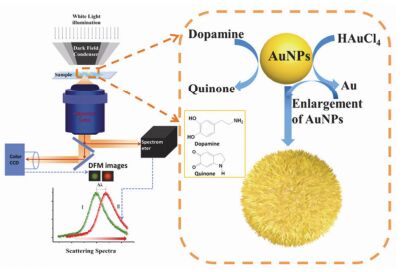
2014年, Xu等[12]构建了一种基于暗场散射信号的高灵敏H2O2检测纳米等离子体探针, 解决了双氧水(H2O2)诱导α-突触核蛋白(α-Syn)聚集中双氧水的来源问题(图 4).该工作利用辣根过氧化物酶(HRP)催化H2O2诱导苯胺在金纳米颗粒表面修饰的双链DNA上聚合, 引起金纳米颗粒周边介电常数的变化导致其散射光谱红移.该方法证实外源H2O2在α-Syn聚集中起主导作用.此外, 2015年该课题组利用金纳米颗粒散射性质及自催化生长性质构建了高灵敏多巴胺(DA)(图 5)传感方法[13], 以及潜指纹成像和指纹中可卡因[14](cocaine)和爆炸物[15](RDX)灵敏检测策略.
等离子体耦合是指贵金属纳米颗粒相互靠近时, 其表面电磁场产生的耦合作用, 等离子体耦合效应可诱导散射强度增加以及光谱红移[16]. 2003年, Nordlander等[17]建立了等离子体杂化模型, 采用分子轨道杂化理论对等离子体耦合进行解释, 将复合金属纳米结构中的不同颗粒近似成偶极子, 随着纳米颗粒间的距离缩小, 各自的偶极强度发生抑制或增强, 从而产生类似分子轨道的高能反键轨道和低能成键轨道.
2007年, El-Sayed等[16]通过光刻的方法探究了间隔距离对金纳米颗粒二聚体LSPR效应的影响, 得到了描述等离子体耦合与其散射光谱位移关系的经验公式:
|
$\frac{{\Delta \lambda }}{{{\lambda _0}}} = 0.18\exp (\frac{{ - s/D}}{{0.23}})$ |
(12) |
式中, s为颗粒表面间距, D为粒径.
DNA杂交可以将两个金纳米颗粒拉近, 产生耦合作用, 暗场显微镜可观测明显的颜色变化. Alivisatos课题组利用粒子间等离子体耦合作用与粒子间隔距离的关系, 构建了一种纳米等离子体“尺”[18], 并将其应用于实时DNA杂交检测[19]以及单分子蛋白检测.通过在金纳米颗粒表面分别修饰DNA aptamer片段, 在靶标分子存在时, 通过与靶标分子结合形成二聚体, 产生等离子体耦合作用, 实现了单分子水平的蛋白检测(图 6).等离子体“尺”具有信号强度高、稳定性好等优势.此外, 等离子体耦合距离长于FRET效应, 可检测的间隔距离变化范围更广.
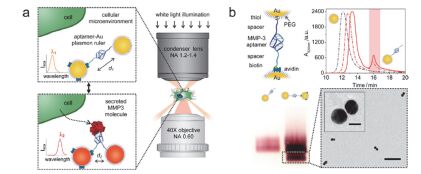
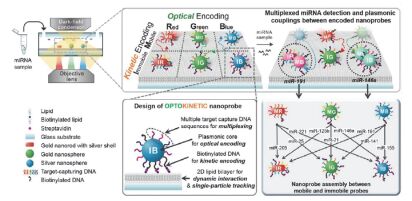
2017年, Nam等[20]通过分别在Au NRs@Ag核-壳结构、Au纳米粒子和Ag纳米粒子多种散射性质不同纳米颗粒表面修饰不同靶向性分子, 并通过调控DNA杂交调节粒子在磷脂双分子层界面的运动状态, 在暗场显微镜下实现了多元miRNA的高通量检测(图 7).
贵金属纳米颗粒聚集后的颜色变化适合构建简单、便捷、廉价的比色法检测策略.通过靶标分子诱导的贵金属纳米颗粒聚集或重分散比色分析方法已广泛应用于核酸、蛋白、金属离子、有机小分子以及抗原检测[21].金属纳米颗粒的散射信号比有机染料分子的荧光高4~6个数量级[22].因此, 等离子体纳米颗粒在比色法分析领域具有更高的灵敏度及稳定性.
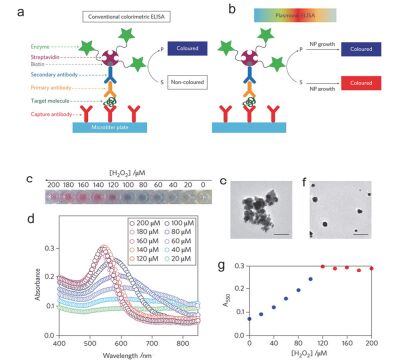
然而, 简单的基于等离子体耦合的比色分析法对低丰度生物靶标分子检测存在一定的局限, 可通过与酶联或核酸链式反应等信号放大手段结合使用, 进一步提高其检测灵敏度.例如, 2012年Stevens等[23]通过金纳米颗粒比色法与酶联免疫法联用, 利用HRP的高催化活性, 催化双氧水还原Au3+形成金纳米颗粒团聚体, 实现了前列腺特异性抗原和HIV-1抗原的超灵敏检测(图 8).
贵金属纳米材料通常具备良好的催化活性, 从单颗粒水平了解催化反应中的电子传递过程, 可以有效排除不同颗粒间的差异性, 对于催化反应机理的探究以及新型高效催化剂的设计具有深远的意义.贵金属纳米颗粒的暗场散射光谱与颗粒电子密度相关, 随着电子密度的增加, 散射光谱蓝移.
2009年, Mulvaney课题组[24]采用暗场显微镜实时监测金纳米十面体催化抗坏血酸氧化过程中的电子传递过程(图 9).在贵金属纳米催化剂设计中, 小粒径纳米催化剂具有更高的催化活性和原子利用率. 2015年Li等[25]针对小粒径纳米颗粒的散射信号较弱的局限, 通过寡核苷酸链(DNA)介导的自组装方法构建以50 nm金纳米颗粒为核, 13 nm金纳米颗粒为壳的卫星结构, 实时检测了13 nm金纳米颗粒的催化过程(图 10), 并结合理论计算, 得到了催化反应中的几个重要参数.
贵金属纳米材料的局域表面等离子体共振使颗粒表面产生强电磁场增强.贵金属纳米颗粒表面的拉曼(Raman)分子的拉曼散射信号可通过物理和化学两种途径增强其拉曼信号, 即表面增强拉曼光谱(SERS)[26]. Van Duyne等[6c]通过实验及理论计算的方法总结了拉曼增强因子的计算公式(Eqs. 13, 14).
|
$E{F_{{\rm{SERS}}}}({\omega _{\rm{v}}}) = \frac{{\left| {{E_{{\rm{out}}}}{{(\omega )}^2}} \right|\left| {{E_{{\rm{out}}}}{{(\omega - {\omega _{\rm{v}}})}^2}} \right|}}{{E_{\rm{o}}^4}}$ |
(13) |
|
$E{F_{{\rm{SERS}}}}({\omega _{\rm{v}}}) = \frac{{[{I_{{\rm{SERS}}}}({\omega _{\rm{v}}})/{N_{{\rm{surf}}}}]}}{{[{I_{{\rm{NRS}}}}({\omega _{\rm{v}}})/{N_{{\rm{vol}}}}]}}$ |
(14) |
增强的拉曼散射信号结合拉曼本证的高特异性, 在传感检测领域取得了广泛的应用.在贵金属纳米颗粒表面修饰拉曼报告分子(Raman reporter)和靶向捕获分子可构建拉曼检测探针.通过靶向捕获分子的特异性作用实现了DNA、蛋白等分子的高特异性和高灵敏检测[27].通过颗粒间耦合作用形成进一步增强的局域电磁场“hot spot”可进一步提高拉曼增强因子, 2013年, 蒋建晖课题组[27b]利用双修饰金纳米颗粒(Au NPs; Au NRs)以及抗原-抗体介导自组装形成的三明治结构, 通过粒子间耦合作用形成“hot spot”实现了复杂生物体系中三种细胞因子的高特异性多元检测(图 11). 2014年, Thacker等[28]利用DNA折纸(DNA origami)介导的精确自组装构建了间隔距离小于5 nm的金纳米颗粒(40 nm)二聚体, 该结构可实现拉曼信号4~5数量级的增强, 并具有结构均一、重复性好等优势(图 12A). 2017年, Song等通过DNA介导纳米颗粒生长法合成了含有纳米空隙的金银纳米蘑菇结构, 构建了一种即用型SERS纳米探针, 纳米结构中的DNA不仅可以作为间隙DNA(介导的DNA), 而且可以作为识别探针, 具有识别DNA和RNA靶标的能力.成功实现了多种DNA和RNA的同时高灵敏检测(图 12B)[29].
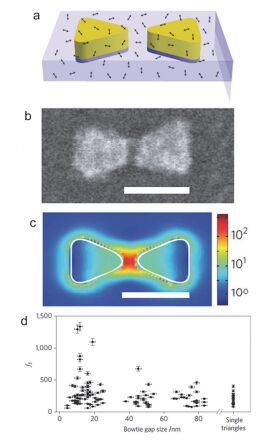
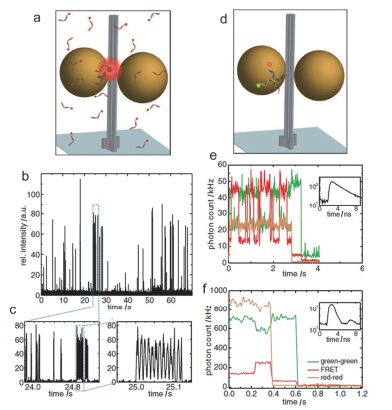
荧光法是常用的分析检测方法, 受限于有机荧光小分子较小的吸收和发射截面, 荧光分析方法的灵敏度和检测限在很大程度上受到限制.近年来, 诸多工作报道贵金属等离子体共振可通过增强荧光分子吸收以及辐射衰减速率等途径增强荧光发射. 2009年, Moerner等[30]通过光刻的方法构建了一种基于金纳米三角的“领结”结构, 实验结果表明该结构可对单分子(TPQDI)荧光增强1340倍, 并通过理论模拟计算方法证明了荧光增强的内在因素:局域表面电磁场耦合作用诱导吸收增强及辐射衰减速率加快, 从而使荧光分子具有更高的量子效率(图 13). 2012年, Tinnefeld等[31]利用DNA Origami精确自组装特性, 构建了金纳米颗粒(40 nm)二聚体, 成功地检测到了单分子荧光信号.并将该结构应用于短链DNA杂交分析和DNA holiday交叉结构的构象变化动力学分析(图 14).
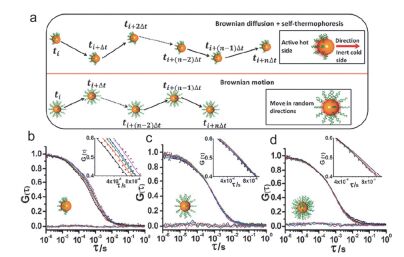
贵金属纳米颗粒的局域表面等离子体共振效应赋予其优异的光学性质, 基于其等离子体共振散射信号具有强度高、稳定性好等优势, 适合单颗粒水平长周期追踪. 2017年, Qin等[32]通过不对称DNA修饰的方法构建了一种化学催化反应驱动的等离子体“两面神”自热泳纳米马达(图 15).不对称DNA修饰导致金纳米颗粒(13 nm)催化活性位点的不对称分布, 在催化反应条件下, 形成局域温度梯度, 驱动纳米马达进行自热泳运动.利用Au NPs的散射信号作为追踪信号, 通过共振光散射相关光谱对马达驱动运动速率与催化反应速率的相关性进行了系统分析, 并建立了纳米马达运动速率与催化反应速率间的随机模型.
如前所述, 贵金属等离激元纳米探针具有亮度高、不易漂白、光学性质稳定等优势, 此外, 贵金属纳米粒子表面容易修饰DNA、蛋白等生物分子.因而具有LSPR效应的贵金属纳米粒子适合作为信号探针研究纳米粒子与细胞的相互作用.与荧光探针相比, LSPR探针的光学稳定性使其特别适合研究探针与细胞的动态相互作用.
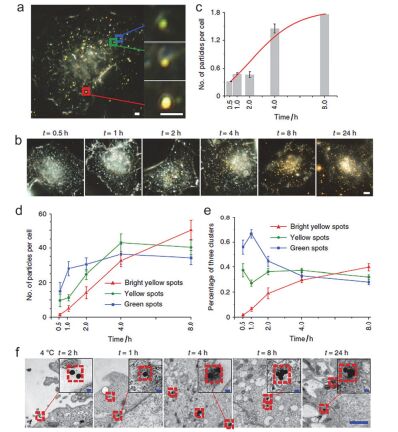
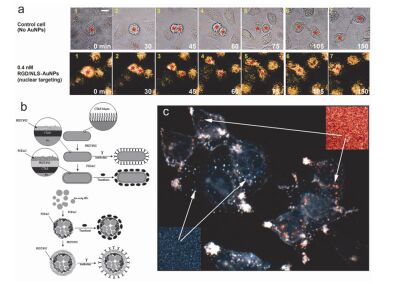
最近, Liu等[33]利用暗场显微镜发展fPlas探针实现了在单细胞水平半定量研究纳米粒子聚集状态的方法, 对金纳米粒子在细胞内通过微管进行运输, 并且对运输过程中发生逐步聚集的过程进行了实时成像, 发现其聚集状态对相关囊泡的运动状态有重要影响(图 16).这一研究结果揭示了纳米粒子在细胞内的运输与其聚集状态直接相关, 为设计新型纳米药物以及等离子体探针提供了思路和靶点.
在贵金属纳米颗粒表面修饰靶向性分子, 可实现肿瘤细胞特异性成像及治疗. 2010年, El-sayed等[34]采用PEG、RGD多肽(integrin-specific arginine-glycine-aspartic acid peptide)和核定位多肽NLS (nuclear localization signal)共修饰金纳米颗粒(30 nm), 实验结果显示该探针可特异性锁定肿瘤细胞核区, 并发现其可诱发肿瘤细胞胞质分裂阻滞, 从而引起细胞不完全分裂和凋亡(图 17).此外, 还可通过暗场实时观测贵金属纳米颗粒标记细胞的分裂周期[35]. 2009年, Prasad等[36]通过在金和银两种不同的纳米颗粒表面分别修饰两种不同的靶向分子(anticlaudin 4和antimesothelin), 实现了细胞的双色成像.
利用贵金属纳米颗粒等离子体共振散射光谱与其周围介质环境以及粒子间耦合作用等密切相关等性质, 可构建细胞内活性物质检测探针[37]. 2013年, 何彦课题组[38]合成了一种银(Ag)包裹金(Au)的核壳纳米棒, 利用硫化物(如Na2S)对银的刻蚀作用, 通过暗场光谱显微镜原位检测了活细胞内硫化物的分布, 随着硫化物与表面银原子反应形成硫化银(Ag2S), 单颗粒暗场散射光谱逐渐红移, 通过反应速率(光谱位移速率)可得出硫化物的浓度(图 18).
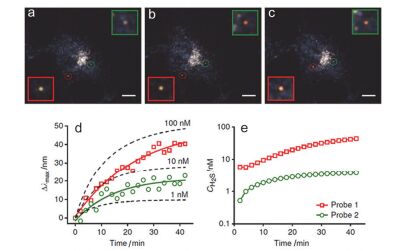
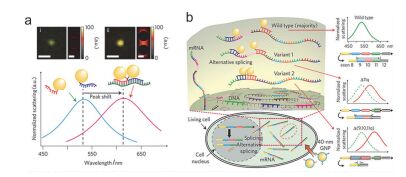
2014年, Lee等[39]利用Au NPs Dimer之间的耦合作用, 通过mRNA介导的杂交反应, 实现了活细胞内mRNA突变体的检测(图 19).当细胞内存在靶标mRNA时, 通过mRNA桥连作用形成二聚体, 散射强度增加及光谱红移.该方法可实现活细胞内单个mRNA突变体的分布成像, 如此高的灵敏度对于疾病的早期诊断、病理研究等具有非常深远的意义.
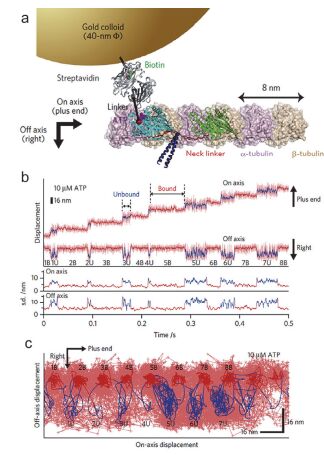
贵金属纳米颗粒不仅可以作为检测探针, 其强散射信号使其在成像标记方面具有强大的应用前景. 2016年, Tomishige等[40]采用金纳米颗粒(40 nm)标记驱动蛋白, 利用暗场显微镜实时监测驱动蛋白沿微管的运动过程(图 20), 实验结果首次揭示了驱动蛋白在运动过程中与微管存在两种不同的结合状态等微观机理信息.
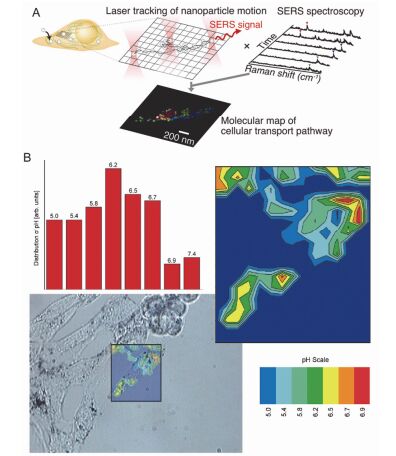
拉曼散射相对荧光成像具有峰宽较窄、无光漂白及自发荧光等干扰.在通过表面增强拉曼光谱解决拉曼分子本征拉曼散射信号低的局限后, 在多元、长周期细胞成像领域具有巨大的应用潜能[41]. 2011年, Kawata等[41c]利用金纳米颗粒SERS探针对J774A.1巨噬细胞内探针运输过程进行了动态拉曼成像(图 21).金纳米颗粒在细胞内转运过程中通过表面增强拉曼光谱, 可实时反映其周围介质环境特征. 2010年, Kneipp等[41d]通过在金纳米颗粒表面修饰4-巯基苯甲酸(pMBA)同时作为Raman信号指示探针及pH传感器, 鉴于质子化和去质子化pMBA分子在1423和1076 cm-1处峰强度比值的变化, 实现了细胞内原位pH成像(图 21).
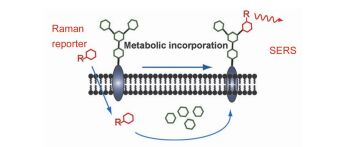
细胞表面多糖分子的存在与分布对于细胞功能具有非常重要的意义.然而, 由于多糖分子种类繁多且缺乏特异性靶向分子, 对其原位检测一直存在较大的挑战.陈兴课题组[42]发展了基于表面增强拉曼光谱的生物正交拉曼标记成像策略(图 22).结合拉曼成像技术, 实现对聚糖的直接标记与成像, 从而无需使用生物正交反应.他们设计并合成了含有“生物正交拉曼基团”的非天然糖探针. “生物正交拉曼基团”定义为该基团的拉曼振动信号落在细胞的“拉曼静默区间”, 即细胞中的天然生物分子在此期间无拉曼信号.运用这些非天然糖和表面增强技术, 他们实现了细胞表面唾液酸化聚糖的直接拉曼检测和成像.聚糖的拉曼检测方法有望与荧光技术互补, 用于研究一系列不同的糖基化过程.
从描述贵金属等离子纳米材料光学性质的Mie理论出发, 集中探讨了近年来贵金属等离子体纳米材料在传感以及细胞成像领域取得的研究进展.基于贵金属等离子纳米材料的强散射信号、LSPR效应、表面增强光谱以及良好的生物相容性等性质, 发展了一系列高灵敏、高选择性及高稳定性的纳米传感及成像探针.在肿瘤标志物检测、细胞内原位成像以及细胞内单颗粒追踪等领域获得了广泛的应用.
虽然当前基于贵金属等离子体纳米材料的传感及细胞成像纳米探针已取得较大的发展, 然而该领域仍存在许多挑战需要进一步发展和改进. (1)对于单颗粒检测分析, 通过仪器改进等有效提高其信噪比, 从而进一步提高检测限以及分辨率. (2)通过与其他技术联用, 进一步提高分析速率及可靠性. (3)对于细胞内原位检测, 通过表面改性和修饰等手段进一步提高其靶向性以及溶酶体逃脱效率. (4)进一步提高传感及成像探针的稳定性和准确性, 加速推进临床实际应用.
Kawata, S.; Ohtsu, M.; Irie, M. Nano-Optics 2002, 84.
Gramotnev, D. K.; Bozhevolnyi, S. I. Nat. Photonics 2010, 4, 83. doi: 10.1038/nphoton.2009.282
Quidant, R.; Kreuzer, M. Nat. Nanotechnol. 2010, 5, 762. doi: 10.1038/nnano.2010.217
Ozbay, E. Science 2006, 311, 189. doi: 10.1126/science.1114849
Schuller, J. A.; Barnard, E. S.; Cai, W.; Jun, Y. C.; White, J. S.; Brongersma, M. L. Nat. Mater. 2010, 9, 193. doi: 10.1038/nmat2630
(a) Mayer, K. M.; Hafner, J. H. Chem. Rev. 2011, 111, 3828; (b) Anker, J. N.; Hall, W. P.; Lyandres, O.; Shah, N. C.; Zhao, J.; Van Duyne, R. P. Nat. Mater. 2008, 7, 442; (c) Jung, L. S.; Chinowsky, T. M.; Mar, M. N.; Yee, S. S.; Campbell, C. T. Langmuir 1998, 14, 5636; (d) Li, Y.; Jing, C.; Zhang, L.; Long, Y. T. Cheminform 2012, 43, doi:10.1002/chin.201218277; (e) Peng, H.; Tang, H.; Jiang, J. Sci. Chin. Chem. 2016, 59, 783; (f) Xu, H.; Li, Q.; Wang, L.; He, Y.; Shi, J.; Tang, B.; Fan, C. Chem. Soc. Rev. 2014, 43, 2650.; (g) Lu, N, ; Gao, A.; Zhou, H.; Wang, Y.; Yang, X.; Wang, Y.; Li, T. Chin. J. Chem. 2016, 34, 308.
(a) G, M. Ann. Phys. Berlin 1908, 25, 377; (b) Bohren, C. F.; Huffman, D. R. Opt. Laser Technol. 1998, 31, 328.
Gans, R. Ann. Phys. Berlin 1912, 342, 881. doi: 10.1002/(ISSN)1521-3889
Kelly, K. L.; Coronado, E.; Lin, L. Z.; Schatz, G. C. Cheminform 2003, 34, 668.
Choi, Y.; Park, Y.; Kang, T.; Lee, L. P. Nat. Nanotechnol. 2009, 4, 742. doi: 10.1038/nnano.2009.258
Liu, N.; Tang, M. L.; Hentschel, M.; Giessen, H.; Alivisatos, A. P. Nat. Mater. 2011, 10, 631. doi: 10.1038/nmat3029
Xu, Y.; Li, K.; Qin, W.; Zhu, B.; Zhou, Z.; Shi, J.; Wang, K.; Hu, J.; Fan, C.; Li, D. Anal. Chem. 2015, 87, 1968. doi: 10.1021/ac5043895
Qin, W. W.; Wang, S. P.; Li, J.; Peng, T. H.; Xu, Y.; Wang, K.; Shi, J. Y.; Fan, C. H.; Li, D. Nanoscale 2015, 7, 15070. doi: 10.1039/C5NR04433B
Li, K.; Qin, W.; Li, F.; Zhao, X.; Jiang, B.; Wang, K.; Deng, S.; Fan, C.; Li, D. Angew. Chem., Int. Ed. 2013, 52, 11542. doi: 10.1002/anie.201305980
Peng, T.; Qin, W.; Wang, K.; Shi, J.; Fan, C.; Li, D. Anal. Chem. 2015, 87, 9403. doi: 10.1021/acs.analchem.5b02248
Jain, P. K.; Huang, W.; El-Sayed, M. A. Nano Lett. 2007, 7, 2080. doi: 10.1021/nl071008a
Prodan, E.; Radloff, C.; Halas, N. J.; Nordlander, P. Science 2003, 302, 419. doi: 10.1126/science.1089171
Lee, S. E.; Alivisatos, P.; Bissell, M. J.; Chen, Q.; Bhat, R.; Petkiewicz, S.; Smith, J.; Correia, A.; Ferry, V. Nano Lett. 2015, 15.
Jun, Y. W.; Sheikholeslami, S.; Hostetter, D. R.; Tajon, C.; Craik, C. S.; Alivisatos, A. P. Proc. Natl. Acad. Sci. U. S. A. 2009, 106, 17735. doi: 10.1073/pnas.0907367106
Kim, S.; Park, J. E.; Hwang, W.; Seo, J.; Lee, Y.; Hwang, J.; Nam, J. J. Am. Chem. Soc. 2017, 139, 3558. doi: 10.1021/jacs.7b01311
(a) Liu, D.; Chen, W.; Wei, J.; Li, X.; Wang, Z.; Jiang, X. Anal. Chem. 2012, 84, 4185; (b) Chen, G.; Chen, W.; Yen, Y.; Wang, C.; Chang, H.; Chen, C. Anal. Chem. 2014, 86, 6843; (c) Sener, G.; Uzun, L.; Denizli, A. Anal. Chem. 2014, 86, 514; (d) Soh, J. H.; Lin, Y.; Rana, S.; Ying, J. Y.; Stevens, M. M. Anal. Chem. 2015, 87, 7644.
Jain, P. K.; Lee, K. S.; El-Sayed, I. H.; El-Sayed, M. A. J. Phys. Chem. B 2006, 110, 7238. doi: 10.1021/jp057170o
de la Rica R.; Stevens, M. M. Nat. Nanotechnol. 2012, 7, 821. doi: 10.1038/nnano.2012.186
Novo, C.; Funston, A. M.; Mulvaney, P. Nat. Nanotechnol. 2008, 3, 598. doi: 10.1038/nnano.2008.246
Li, K.; Wang, K.; Qin, W.; Deng, S.; Li, D.; Shi, J.; Huang, Q.; Fan, C. J. Am. Chem. Soc. 2015, 137, 4292. doi: 10.1021/jacs.5b00324
Porter, M. D.; Lipert, R. J.; Siperko, L. M.; Wang, G.; Narayanan, R. Chem. Soc. Rev. 2008, 37, 1001. doi: 10.1039/b708461g
(a) Sun, L. ; Yu, C. ; Irudayaraj, J. Anal. Chem. 2007, 79, 3981; (b) Wang, Y. ; Tang, L. J. ; Jiang, J. Anal. Chem. 2013, 85, 9213; (c) Lee, J. H. ; Nam, J. M. ; Jeon, K. S. ; Lim, D. K. ; Kim, H. ; Kwon, S. ; Lee, H. ; Suh, Y. D. ACS Nano 2016, 6, 9574; (d) Qian, X. ; Zhou, X. ; Nie, S. J. Am. Chem. Soc. 2008, 130, 14934; (e) MacAskill, A. ; Crawford, D. ; Graham, D. ; Faulds, K. Anal. Chem. 2009, 81, 8134; (f) Li, Z. ; Zhao, A. ; Gao, Q. ; Guo, H. ; Wang, D. ; Li, L. Acta Chim. Sinica 2015, 73, 847. (李振兴, 赵爱武, 高倩, 郭红燕, 王大朋, 李磊, 化学学报, 2015, 73, 847. )
Thacker, V. V.; Herrmann, L. O.; Sigle, D. O.; Zhang, T.; Liedl, T.; Baumberg, J. J.; Keyser, U. F. Nat. Commun. 2014, 5, 3448.
Su, J.; Wang, D.; Nörbel, L.; Shen, J.; Zhao, Z.; Dou, Y.; Peng, T.; Shi, J.; Mathur, S.; Fan, C.; Song, S. Anal. Chem. 2017, 89, 2531. doi: 10.1021/acs.analchem.6b04729
(a) Kinkhabwala, A.; Yu, Z.; Fan, S.; Avlasevich, Y.; Müllen, K.; Moerner, W. E. Nat. Photonics 2009, 3, 654; (b) Wang, Y; Zu, X.; Yi, G.; Luo, H.; Wang, H.; Song, X. Chin. J. Chem. 2016, 34, 1321.
Acuna, G. P.; Möller, F. M.; Holzmeister, P.; Beater, S.; Lalkens, B.; Tinnefeld, P. Science 2012, 338, 506. doi: 10.1126/science.1228638
Qin, W.; Peng, T.; Gao, Y.; Wang, F.; Hu, X.; Wang, K.; Shi, J.; Li, D.; Ren, J.; Fan, C. Angew. Chem., Int. Ed. 2017, 56.
Liu, M.; Li, Q.; Liang, L.; Li, J.; Wang, K.; Li, J.; Lv, M.; Chen, N.; Song, H.; Lee, J.; Shi, J.; Wang, L.; Lal, R.; Fan, C. Nat. Commun. 2017, 8, 15646. doi: 10.1038/ncomms15646
Kang, B.; Mackey, M. A.; El-Sayed, M. A. J. Am. Chem. Soc. 2010, 132, 1517. doi: 10.1021/ja9102698
Qian, W.; Huang, X.; Kang, B.; El-Sayed, M. A. J. Biomed. Opt. 2010, 15, 046025. doi: 10.1117/1.3477179
Hu, R.; Yong, K.-T.; Roy, I.; Ding, H.; He, S.; Prasad, P. N. J. Phys. Chem. C 2009, 113, 2676.
(a) El-Sayed, I. H.; Huang, X.; El-Sayed, M. A. Nano Lett. 2005, 5, 829; (b) Kang, B.; Mackey, M. A.; El-Sayed, M. A. J. Am. Chem. Soc. 2010, 132, 1517; (c) Yu, C.; Nakshatri, H.; Irudayaraj, J. Nano Lett. 2007, 7, 2300; (d) Yu, C.; Irudayaraj, J. Anal. Chem. 2007, 79, 572.
Xiong, B.; Zhou, R.; Hao, J.; Jia, Y.; He, Y.; Yeung, E. S. Nat. Commun. 2013, 4, 1708. doi: 10.1038/ncomms2722
Lee, K.; Cui, Y.; Lee, L. P.; Irudayaraj, J. Nat. Nanotechnol. 2014, 9, 474. doi: 10.1038/nnano.2014.73
Isojima, H.; Iino, R.; Niitani, Y.; Noji, H.; Tomishige, M. Nat. Chem. Biol. 2016, 12, 290. doi: 10.1038/nchembio.2028
(a) Qian, X.; Peng, X. H.; Ansari, D. O.; Yin-Goen, Q.; Chen, G. Z.; Dong, M. S.; Yang, L.; Young, A. N.; Wang, M. D.; Nie, S. Nat. Biotechnol. 2008, 26, 83; (b) Wang, X.; Wang, C.; Cheng, L.; Lee, S. T.; Liu, Z. J. Am. Chem. Soc. 2012, 134, 7414; (c) Ando, J.; Fujita, K.; Smith, N. I.; Kawata, S. Nano Lett. 2011, 11, 5344; (d) Kneipp, J.; Kneipp, H.; Wittig, B.; Kneipp, K. J. Phys. Chem. C2010, 114, 7421; (e) Wang, Z.; Zong, S.; Yang, J.; Li, J.; Cui, Y. Biosens. Bioelectron. 2011, 26, 2883.
Lin, L.; Tian, X.; Hong, S.; Dai, P.; You, Q.; Wang, R.; Feng, L.; Xie, C.; Tian, Z.; Chen, X. Angew. Chem, Int. Ed. 2013, 52, 7266. doi: 10.1002/anie.201301387

图 2 贵金属纳米颗粒的等离子体性质及传感、追踪和成像应用示意图
Figure 2 Schematic illustration of plasmonic properties of noble metal nanoparticles and its' applications in sensing, tracking and imaging

图 3 单颗粒钯纳米颗粒氢气传感器(a)、纳米天线共振增强气体传感器(b)、金-钯纳米天线暗场散射图(c)及SEM图(d)和暴露在氢气中的单颗粒金-钯纳米三角天线的光学散射检测(e)
Figure 3 Hydrogen sensing with a single palladium nanoparticle (a), hydrogen sensing using a resonant antenna-enhanced scheme (b), dark-field image (c) and Representative SEM image (d) of the palladium-gold antennas, optical-scattering measurements of a single palladium-gold triangle antenna on hydrogen exposure (e)

图 4 纳米等离子体H2O2检测探针原理示意图(A)、Au NPs, ds-DNA修饰Au NPs, ds-DNA-HRP修饰Au NPs暗场散射图像(B)及光谱(C)
Figure 4 Principle of the plasmonic assay for H2O2 (A), dark-field images (B) and SPR spectra (C) of bare Au NPs, ds-DNA-loaded Au NPs, and ds-DNA-HRP-loaded Au NPs respectively

图 5 纳米等离子体多巴胺检测探针原理示意图
Figure 5 Schematic illustration of the principle of the nanoplasmonic DA sensor

图 6 基于核酸适配体的可逆等离子体“尺子”示意图(a)及金纳米颗粒dimer等离子体“尺子”组装及表征(b)
Figure 6 Schematic of reversible aptamer-Au plasmon ruler (a) and assembly of reversible plasmon rulers (b)

图 7 基于暗场显微镜的mRNA多元传感检测示意图
Figure 7 Optokinetically encoded nanoprobe (OK-NP)-tethered supported lipid bilayer (SLB) assay (OK-NLB assay)

图 8 传统ELISA比色法分析检测示意图(a)、Plasmonic ELISA比色分析检测示意图(b)、不同双氧水浓度下的颜色图片(c)以及紫外-可见吸收光谱(d)、不同双氧水浓度下酶催化形成金纳米颗粒TEM图[100 mmol•L-1 (e), 120 mmol•L-1 (f)]及反应体系溶液在550 nm处吸收值与双氧水浓度的相关性(g)
Figure 8 In conventional colorimetric ELISA, enzymatic biocatalysis generates a coloured compound (a), in plasmonic ELISA the biocatalytic cycle of the enzyme generates coloured nanoparticle solutions of characteristic tonality (S, substrate; P, product; NP, nanoparticle) (b), photograph (c) and ultraviolet-visible spectra (d) for different hydrogen peroxide concentrations, transmission electron microscopy (TEM) images of nanoparticles grown with hydrogen peroxide at concentrations of 100 mmol•L-1 (e) and 120 mmol•L-1 (f), and (g) graph showing that the absorbance of the solutions at 550 nm varies with concentration of hydrogen peroxide

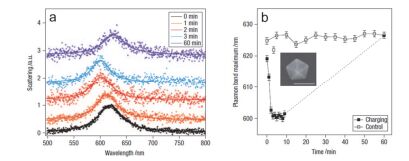
图 9 金十面体催化抗坏血酸氧化1, 2, 3及60 min时单颗粒散射光谱(a)及金十面体催化抗坏血酸氧化过程中单颗粒散射光谱峰值随时间的变化(b)
Figure 9 Scattering spectra of the decahedron at 1, 2, 3 and 60 min after electron injection by ascorbate ions (a), and spectral shift as a function of time for the catalysis reaction and for the control experiment (b)

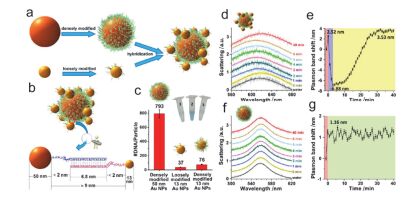
图 10 DNA介导“卫星”结构组装示意图(a, b)、不同金纳米颗粒表面DNA分子修饰量(c)、单颗粒“卫星”结构催化葡萄糖氧化过程暗场光谱(d)及峰值(e)随时间变化、单颗粒50 nm金纳米颗粒(失活)催化葡萄糖氧化过程暗场光谱(f)及峰值(g)随时间变化
Figure 10 Synthetic scheme for the preparation of Au nanohalo through the self-assembly of Au NPs of different diameters modified with complementary oligonucleotides (a, b), number of oligonucleotides per particle of different kinds of L-and S-Au NPs. Inset shows the colored product that is catalyzed by L-and S-Au NPs that loaded different amounts of oligonucleotides, respectively, as tested by a HRP-cascaded colorimetric reaction (c), LSPR spectra (d) and the corresponding plasmonic band peak shifts (e) of one Au nanohalo during the catalytic reaction, and LSPR spectra (f) and the corresponding plasmon band peak shifts (g) of one L-NPs along the catalytic process under same experimental condition

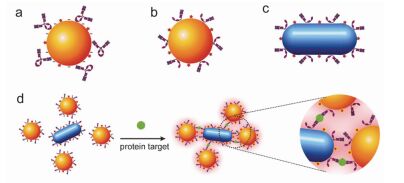
图 11 通过静电吸附修饰完整抗体的SERS探针(a)、通过Au-S共价作用修饰抗体片段的SERS探针[(b)金球, (c)金棒]和一步法免疫SERS检测原理示意图(d)
Figure 11 SERS nanoparticle decorated with randomly orientated antibodies via electrostatic assembly (a), SERS nanoparticle (b) and SERS nanorod (c) decorated with orientational antibody half-fragments and orientational antibody half-fragments respectively, and single-step SERS immunoassay based on plasmonic coupling enhancement via sandwiched antibody-antigen assembly (d)

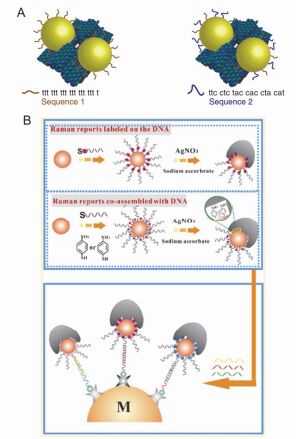
图 12 基于DNA折纸的SERS探针示意图(A)和基于Au-Ag蘑菇结构的即用型SERS检测探针原理示意图(B)
Figure 12 Schematic plot of the SERS probe based on DNA origami (A) and the schematic plot of the ready-to-use SERS probe based on Au-Ag nanomushrooms (B)

图 13 TPQDI分子覆盖的纳米“领结”结构示意图(a)、纳米“领结”结构SEM图(b)、纳米“领结”结构的FDTD模拟结果(c)及单分子荧光增强与纳米“领结”结构间隔距离的关系(d)
Figure 13 Schematic of bowtie nanoantenna (gold) coated with TPQDI molecules (a), scanning electron microscopy (SEM) image of a gold bowtie nanoantenna (b), finite-difference time-domain calculation of local intensity enhancement (c) and single molecule fluorescence brightness enhancements as a function of bowtie gap size (d)

图 14 DNA origami组装金二聚体短链DNA检测示意图(a)、短链DNA结合与去结合引起的荧光闪烁(b, c)、DNA origami组装金二聚体HJ交叉构象变化检测示意图(d)及HJ交叉构象变化引起的荧光强度及FRET效率改变[(e)无金纳米颗粒, (f)有金纳米颗粒]
Figure 14 Sketch of the modified DNA pillar for the DNA binding assay (a), fluorescence intensity transient showing several binding and unbinding events on a DNA origami pillar with two NPs (b), enlarged views reveal the magnitude of enhancement (c), sketch of the DNA origami dimer with an incorporated HJ labeled with green and red dyes (d), and fluorescent intensity and FRET transients show oscillations of the HJ for a pillar with no NPs (e) and a NP dimer (f).

图 15 (a) Janus NPs(上)及Active NPs(下)运动示意图及Janus NPs (b)、Active NPs (c)和Inactive NPs (d)在不同底物浓度催化反应条件下的共振光散射相关光谱
Figure 15 (a) Schematic diagram of the movement of Janus NPs (upper) and Active NPs (down) and the RLSCS data of Janus NPs (b), active NPs (c) and Inactive NPs (d) under different substrate concentrations

图 16 金纳米颗粒在细胞内的不同状态[单颗粒(绿点), 小聚集体(黄点)和大聚集体(亮黄点)](a)、fPlas-gold与细胞相互作用的时间进程(b)暗场图像和(f)TEM图像、细胞对fPlas-gold摄取量随孵育时间的变化(c)及不同时刻不同聚集状态纳米颗粒数量(d)和百分比(e)统计结果.
Figure 16 A representative dark-field microscopy (DFM) image showing the presence of single particles (green spots in blue rectangle), small clusters (yellow spots in green rectangle) and large clusters (bright yellow spots in red rectangle), respectively (a), DFM and (f) transmission electron microscopy (TEM) images for time evolution of fPlas-gold incubated with HeLa cells. Scale bar in b, 5 mm; scale bar in f, 2 mm, inserted 50 nm (b), Inductively coupled plasma atomic emission spectrometry (ICP-AES) analysis of elemental gold in cells along with the time (t) (c), and averaged particle counts (d) and percentages of different clustering states (e) of fPlas-gold in cells over time (t)Data were analyzed from 20 cells.

图 17 核定位金纳米颗粒(0.4 nmol•L-1)处理肿瘤细胞分裂过程的实时成像(a)、不同形貌或材料贵金属纳米颗粒的表面修饰示意图(b)及基于Au NRs和Ag NPs的Panc-1细胞暗场双色成像图(c)
Figure 17 Real-time images of cancer cell division showing an apparent cytokinesis arrest followed by binucleate cell formation in the presence of 0.4 nmol•L-1 nuclear-targeting gold nanoparticles (a), surface functionalization and conjugation of Au NRs and Ag or Au NPs (b) and multiplexed imaging of Panc-1 cells labeled with antibody conjugated Au NRs and Ag NPs (c)

图 18 细胞培养基中加入0.1 mmol•L-1 Na2S后单颗粒PNP的暗场图像随时间的变化[(a) 2 min, (b) 26 min和(c) 42 min]、实验测量(点)以及拟合(实线)两个不同PNP的散射峰值随时间的变化(d)及理论计算图(d)中两个不同PNP探针周围Na2S浓度随时间的变化(e)
Figure 18 Representative images showing the gradual colour changes of two individual PNPs after adding 0.1 mmol•L-1 Na2S to the cell culture medium for (a) 2 min, (b) 26 min and (c) 42 min, observed (hollow dots) and fitted (lines) time-dependent λmax shifts of the two particles (d) and calculated time-dependent change in local sulphide concentrations surrounding the two particles according to the fitted results in d (e)

图 19 基于等离子体耦合作用的mRNA成像分析示意图(a)及细胞内单个mRNA突变体成像检测原理示意图(b)
Figure 19 Spectral characteristics of different nanoparticle structures formed by DNA hybridization for sequence-specific detection (a) and schematic diagram of single mRNA mutants imaging detection in cellular environment (b)

图 20 金纳米颗粒探针标记驱动蛋白沿微管运动示意图(a)、金纳米颗粒探针中心位置(x和y方向)随驱动蛋白沿微管运动过程中的变化(b)及金纳米颗粒探针在x和y方向位置不确定性的二维相关性分析(c)
Figure 20 Schematic depicting the gold probe attached to one head of the dimeric kinesin moving processively along a microtubule protofilament (a), changes of the center position (x and y direction) of the gold nanoparticle probe which attached to the drive protein and move along the microtube (b) and the two-dimensional correlation of the position uncertainty of the gold nanoparticles in the x and y (c)

图 21 细胞内吞金纳米颗粒的动态SERS成像示意图(A)和基于SERS的细胞内含体pH成像(B)
Figure 21 Dynamic SERS imaging of cellular transport pathways with endocytosed gold nanoparticles (A) and the pH imaging of the endosome in cells based on SERS (B)

 扫一扫看文章

扫一扫关注我们
 下载:
下载:

 下载:
下载:
