Received Date:
21 May 2022 Accepted Date:
02 June 2022 Available Online:
25 October 2022
Abstract:
Understanding the atomic and electronic changes of active sites promotes the whole new sight into electrochemical carbon dioxide reduction reaction (CO2RR), which provides a feasible strategy to achieve carbon neutrality. Here we employ operando high-energy resolution fluorescence-detected X-ray absorption spectroscopy (HERFD-XAS) to track the structural evolution of Ni(II) phthalocyanine (NiPc), considered as the model catalysts with uniform Ni-N4-C8 moiety, during the CO2RR. The HERFD-XAS method is in favor of elucidating the interaction of the reactant/catalyst interface from the atomic electronic structure dimension, facilitating the establishment of the catalytic mechanism and the dynamic structure changes. Based on operando measurement, surface sensitive difference spectra (∆µ) and spectroscopy simulation, the interfacial interactions between the active sites of NiPc and reactants are monitored and the Ni species gradually reduced by increasing the applied potential is discovered. HERFD-XAS method offers an advanced and powerful tool for elucidating the complex catalytic mechanism in further various systems.
The urgency of energy crisis and the menace of climate change desiderate renewable energy technologies. The mitigation of the climate change caused by human activities requires replacement existing fossil fuels with alternative clean energy sources.[1, 2] Electrocatalytic CO2 reduction reaction (CO2RR) is one of the prospective routes to mitigate environment and energy crisis by storing renewable energy in value-added chemicals, such as CO, CH4 and C2H4.[3-5] Owing to the excellent chemical stability of CO2 molecules and its accompanying competitive hydrogen evolution reaction (HER) during the electroreduction of CO2, a deep understanding of the catalytic reaction mechanism and the structural evolution of the catalyst during the reaction process can conduce to improve the product selectivity, thereby promoting its industrialization process.[6] Metal phthalocyanines, [7, 8] an important class of molecular catalysts with excellent structure-stability and uniform M-N4 moiety, have been considered as the potential catalysts for CO2RR.[9-12] Until now, the intrinsic behavior of the active site in metal phthalocyanines catalysts during the reaction, especially the interaction between the surface sites and the adsorbate, has not been well elaborated. To address this conundrum, it is critical to develop in situ or operando techniques that can identify the behavior of these active sites.
Recently, multifarious experimental and theoretical techniques including density functional theory (DFT) calculations, [13]in situ infrared spectroscopy (IR), [14] surface-enhanced Raman spectroscopy (SERS), [15]in situ X-ray absorption spectroscopy (XAS)[16-18] and resonant inelastic X-ray scattering (RIXS)[19] have been employed to uncover the reaction mechanism. However, in situ IR and in situ Raman spectroscopy can only capture the information of non-metal species upon the surface, while they cannot access the chemical state and electronic structure of metal catalysts in real time during the reaction. Accordingly, various information about chemical and physical properties of catalysts resorted to XAS. Extended X-ray absorption fine structure (EXAFS) is commonly employed to extract the coordination number and distances of coordinating atoms in the local structure around an X-ray absorbing central catalyst metal. Essentially, EXAFS is a valuable tool while it suffers from particular intrinsic limitation.[20]
Nonetheless, XANES is extracted by the transition of electrons from core level to unoccupied, providing information of the chemical state and electronic structure. Starting with the XANES region, a variety of electronic and structural details are found in pre peaks of transition metals. Features in XANES region contains abundant information. For example, the pre-edge peaks could be relevant to the 3d/4p orbital hybridization arising from the configuration symmetry. Besides, shoulders are frequently considered as the fingerprint for square-planar M-N4 moieties. However, limited to the intrinsic lifetime broadening and detection resolution, some weak but vital features in XANES are hindered, missing the more unambiguous information of geometric (coordination symmetry) and electronic (oxidation state) structure.[20, 21] As a result, the development and application of hard XAS with high-energy resolution is urgently needed. Eisenberger et al. showed that reducing the lifetime broadening in XANES can be achieved by probing the intensity of the emitted X-ray fluoresence in a narrow energy bandwidth, [22] and it was called high energy-resolved fluorescence detection X-ray absorption near edge structure (HERFD-XANES). Combined with spectroscopy simulation, the leap from qualitative analysis to quantitative analysis of high-resolution spectroscopy methods could be actualized. Apparently, HERFD-XANES can detect the lowest unoccupied (LUMO) state of metal catalysts to precisely measure the symmetrical arrangement of molecular orbitals and their occupancy, that is, it is a more physical alternative to the oxidation state form commonly used in chemistry.[23, 24]
Herein, we resort operando HERFD-XANES in the practical situation of electrochemical to reveal the interfacial interaction between active sites and the reactants, which allows us to uncover the catalytic activity for the CO2RR to CO of NiPc. By utilizing a self-designed von Homos type spectrometer setup in BL14W1-XAFS beamline of Shanghai Synchrotron Radiation Facility (SSRF), Kβ1, 3 emission line of Ni species in NiPc was acquired. Compared with the conventional XAS, HERFD-XANES can obtain more details during catalytic reactions and will gradually turn into a powerful tool to elucidate the complex catalytic mechanism.
HERFD-XANES ACQUISTION
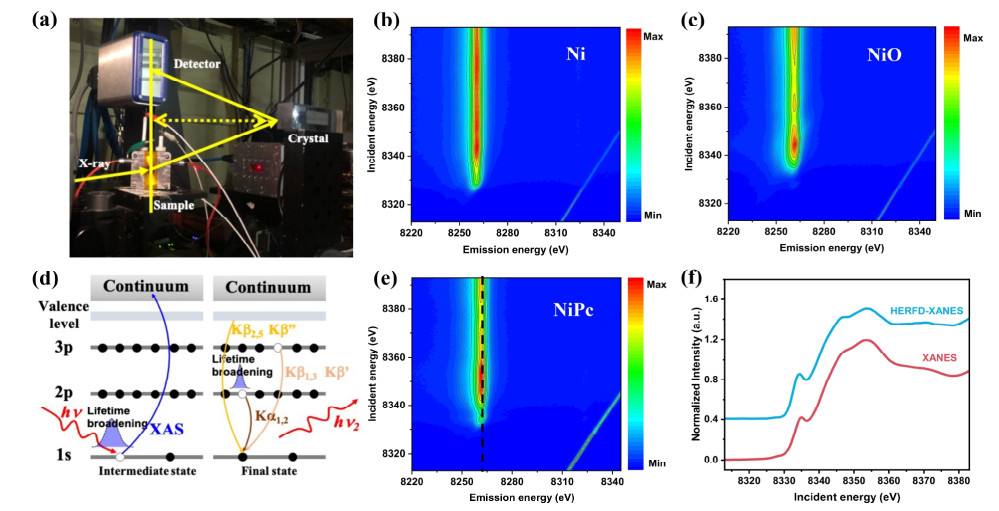
HERFD-XANES has the advantage of specifically recording elemental spectra, in favor of transition metal systems commonly used in catalysis. Figure 1a displays the von Hamos spectrometer for operando HERFD-XANES, which permits us to collect the signal in the catalytic situations[25]. To straightforward clarify the physical process of HERFD-XANES, Figure 1d presents a schematic diagram of the inner electron excitation and relaxation processes. Once the electrons are excited to the conduction band, the electrons in 3p or 2p orbital subsequently fill the core hole accompanied by the emission of fluorescence. K$ \mathrm{\alpha } $1, 2 emission (2p→1s) or Kβ1, 3 emission (3p→1s) could be selected by adjusting the arrangement of components in the spectrometers and the indices of crystal face of analyzer crystals.[26] In conventional XAFS, an inner shell electron is excited to an occupied orbital by absorbing incident X-ray photons, and the final state is a hole at the core level. HERFD-XANES is a secondary emission process, with the final state to be the electron hole in higher orbitals, generating longer broadening lifetime and higher energy resolution. The valent state variation during the catalytic reaction indicates the charge-transfer process. Here we collect Kβ1, 3 emission rather than K$ \mathrm{\alpha } $1, 2 emission due to more detailed information on 3d orbital changes through 3p-3d exchange interactions.[27]
Figure 1
Figure 1.
(a) Experimental set up base on von Hamos geometry developed at BL14W1-XAFS beamline of SSRF. (b) Kβ1, 3-RIXS plane of Ni foil. The contour plane at the emission energy of ~8266.18 eV is the Kβ1, 3-RIXS plane. (c) Kβ1, 3-RIXS plane of NiPc. (d) Electronic transitions involved and studied in the prepeak signal of HERFD-XANES and Kβ1, 3-XES. (e) Kβ1, 3-RIXS plane of NiO. (f) HERFD-XANES (blue) and conventional XANES (pink) spectra of NiPc. The HERFD-XANES spectrum was obtained by integrating the RIXS intensity along the dashed line in (d) with a scale of 0.3 eV.
Figure 1b, c, e show the Ni Kβ1, 3-RIXS planes of Ni foil, NiO and NiPc. The Kβ1, 3-RIXS planes were recorded by adjusting the position of analyzers and detector to the Ni Kβ1, 3 emission peak of NiPc and scanning the incident X-ray energy through the XANES region. And HERFD-XANES is obtained by integrating the profile along the constant emission energy (CEE) line, corresponding to the full-profile surface maximum intensity (dashed black line at 8266.18 eV in Figure 1d), with a width scale of 0.3 eV. Figure 1f shows the spectral comparison between HERFD-XANES of NiPc and conventional XANES. In the HERFD-XANES spectrum, finer structures can be clearly observed, while in the conventional XANES spectrum a lot of spectral information is hindered due to the lifetime broadening limitation. Furthermore, the superior high-energy resolution of HERFD-XANES makes it a powerful tool to determine fine atomic and electronic structures.
PERFORMANCE OF THE NiPc CATALYST
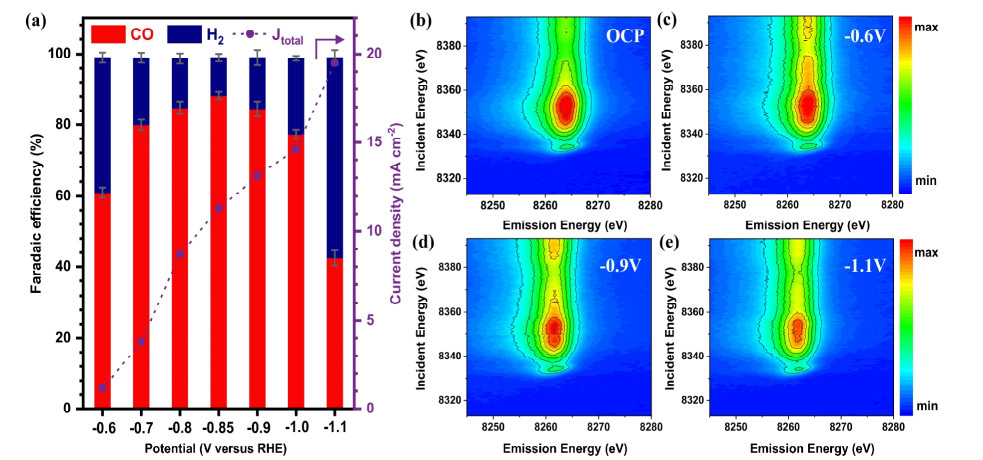
To evaluate the CO2RR activity of NiPc cathode catalysts, we performed experimental tests on the model catalyst NiPc. Figure 2a shows the potentiostatic electrolysis test of the model catalyst NiPc in CO2-saturated 0.5 M KHCO3 electrolyte, in which NiPc exhibits robust selectivity to CO in a wide potential range. Chronoamperometric measurements were carried out at different potentials to obtain product distributions. CO was the only gaseous product from the CO2RR, with H2 as the by-product from the hydrogen evolution reaction (HER). Faradaic efficiencies of CO and H2 (FE(CO) and FE(H2), respectively) from NiPc were plotted in Figure 2a. In the electrocatalytic CO2RR reaction, both CO2RR and HER contribute to the current density, and on NiPc, the CO2RR to CO dominates over the HER, with Faradaic efficiency reaching the maximum value of 89% at 0.85 V versus RHE (Figure 2a). The model catalyst NiPc showed negligible CO2 reduction activity. Figure S4 shows the linear sweep voltammetry (LSV) of NiPc in a CO2-saturated 0.5 M KHCO3 electrolyte, in which the NiPc catalyst exhibits relatively low onset potential and poor current density. Both the CO2RR and HER contribute to the current density. Obviously, NiPc shows the great activity, namely, CO current density, in a wide potential range (Figure 2a).
Figure 2
Figure 2.
(a) Faradaic efficiency and total current density of NiPc at the applied potentials (0.5 M KHCO3 saturated by CO2). The faradaic efficiency is stated as an average and calculated at the steady-state current and product concentration. Operando Kβ1, 3-RIXS planes of NiPc without potential applied (b) and NiPc under (c-e) various potentials vs. RHE in a 0.5 M KHCO3 solution during the ECO2RR.
To explore the ratio changes of the products CO and H2, we calculated the FE (Figure 2a) and partial current densities of the products. Despite the poor electrical conductivity of NiPc, the relationship between its catalytic activity and applied potential is sufficient to guide the elucidation of the mechanism. The product CO displayed an upward trend with increasing potential, reaching a maximum at 0.85 V (vs. RHE), while the selectivity for H2 was almost unchanged in the potential range from 0.7 V to 1.0 V (vs. RHE) (Figure 2a).
OPERANDO HERFD-XANES ANALYSIS
Due to the deficiency in energy resolution of conventional in situ X-ray techniques, operando HERFD-XANES was conducted for measuring the interaction near the outmost surface of electrocatalysts. Operando HERFD-XANES analysis was used to track the dynamic structural evolution of the NiPc active site in carbon dioxide reduction reaction (CO2RR) and the adsorption of reaction intermediates on the catalyst surface (Figure 2b-d). Figure 2(b-d) shows the Kβ1, 3-RIXS profiles at different potentials. In CO2-saturated KHCO3 electrolyte, the spectral features of NiPc have the same intensity and similar profile as that of pristine NiPc, indicating that CO2 molecules are physically, rather than chemically adsorbed on the catalyst surface without any potential applied.
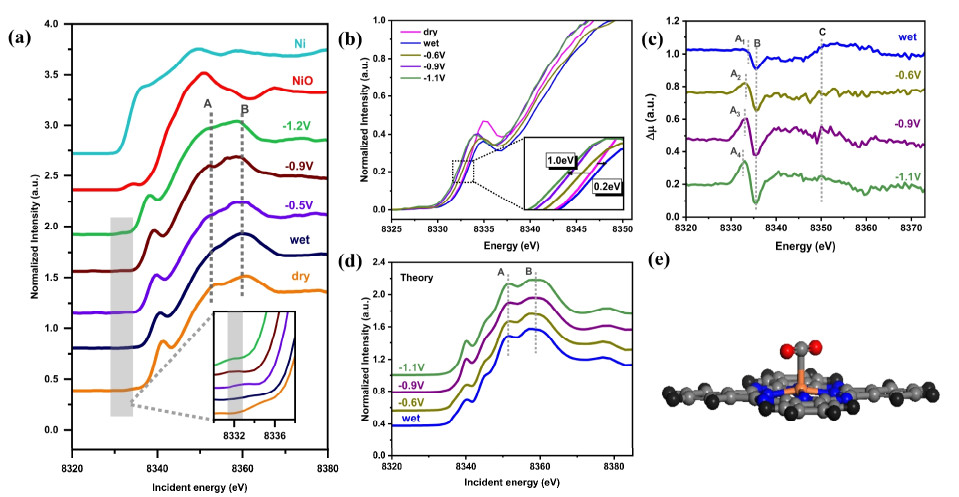
To further track the structural evolution of the catalyst and the adsorption of intermediates on the surface during the reaction, we integrated the profile along the constant emission energy at 8261.8 eV to obtain the corresponding HERFD-XANES spectrum (Figure 3a). It is observed from the HERFD-XANES spectrum that NiPc has similar XANES profiles at different voltages in the XANES region, but its peak intensity shows regular changes with the shifting of potential. In the spectrogram, it's not uncommon to find that it is almost indistinguishable between the spectrum of the original dried NiPc and that of the catalyst immersed only in electrolyte (in the CO2 saturated solution of 0.5 M KHCO3 electrolyte), which is consistent with the result presented by the Kβ1, 3-RIXS spectrum. The enlarged pre-edge structure is shown in the inset of Figure 3a, indicating the change of valence state. The adsorption edge positions of NiPc XANES spectra shift toward lowenergy ranges with the increase of the potential, which can further speculate that the metal ion Ni in the model catalyst NiPc is gradually reduced in the reaction.
Figure 3
Figure 3.
(a) Normalized K-edge HERFD-XANES of NiPc at various applied potentials vs. RHE during the CO2RR and corresponding standard references of Ni and NiO. The inset enlarges the pre-edge structure. (b) Ni K-edge XANES spectra of NiPc at various applied potentials vs. RHE during the CO2RR, where peaks A and B represent 1s→4px, y transitions and multiple scattering processes, respectively (inset shows the expanded pre-edge region). (c) Operando Ni K-edge ∆µ spectra of NiPc at various potentials vs. RHE by subtracting the dry HERFD-XANES spectrum. (d) The theoretical HERFD-XANES spectrum of NiPc without potential applied, NiPc at 0.6 V (vs. RHE), 0.9 V (vs. RHE), and 1.1 V (vs. RHE), obtained from FDMNES simulation. (e) The schemes show the corresponding calculation model for the XANES simulation (Ni (orange), N (blue), C (gray), O (red) and H (black)).
The pre-edge peak intensity of NiPc is weak due to its high D4h centrosymmetry, with a peak at approximately 8334 eV classifying as forbidding the dipole but allowing the quadrupole transition (1s→3d), indicating that 3d and 4p orbital hybridization has occurred in Ni center atoms.[28, 29] Interestingly, as the reaction progressed, the peak intensity of peak A gradually became larger, and the relative intensity ratio (IA/IB) of peaks A and B was significantly larger than that of the original dry catalyst. These two peaks belong to the 1s→4px, y transition and the multiple scattering process, respectively.[30] Recent study shows the relative intensity ratio (IA/IB) correlates with the catalytic activity.[30] These results further confirm the change in the D4h symmetry of the model catalyst NiPc during the reaction. Figure 4b, c display the normalized operando Ni K-edge XANES spectra and ∆µ spectra of NiPc at various potentials vs. RHE by subtracting the dry HERFD-XANES spectrum. As shown in the inset of Figure 4b, as the applied potential increases, the Ni K-edge at 0.6 V (vs. RHE) is negatively shifted in the position of the absorption edge compared with that in CO2-saturated KHCO3 solution, indicating the increase in the low oxidation state during the reaction. During CO2RR, the Ni K-edge of NiPc shifted back to lower energy, which indicates the low-oxidation-state Ni after CO2 reduction. To amplify the evolution of active sites on the catalyst surface, we introduced a surface-sensitive ∆µ analysis obtained by subtracting the HERFD-XANES spectrum of the original dry sample.[19] The electrocatalytic reaction essentially occurs between the catalyst surface and the interface of the electrolyte solution, so only the active sites in full contact with the electrolyte solution participate in the reaction. In virtue of ∆µ analysis, the information of Ni species unchanged was removed, thus highlighting the process of Ni species being reduced during the reaction. As shown in Figure 3c, the positive A1-A4 peak (~8333 eV) corresponding to the change of the pre-edge peak shifts to the lower energy region with the potential increasing, indicating that the Ni(II) species shift towards Ni(I) evolution of species.[31] In addition, feature B (8336 eV) is a negative peak, which can be attributed to the variation in the NiPc shoulder intensity.
The disordered NiPc structure in reaction is further substantiated by comparing the experimental XANES data to the theoretical results based on FDMNES code (Figure 3d). NiPc remains the characteristic features of analogue Ni-centered macrocycles during reaction (Figure 3a), which is well seized by the FDMNES calculations based on NiPc (Figure 3d). All these features exhibit similar trends in amplitude and/or position, and both the relative intensity ratios (IA/IB) of peaks A and B are significantly increased. Most interestingly, all of these trends can be well reproduced in FDMNES by gradually binding the central Ni away from the N4-plane (Figure 3e), and completely bind to CO2 molecules by the distortion of the D4h symmetry. To precisely reflect the potential-induced structural evolution, we combined the ∆µ analysis and the XANES simulation, which images the dynamic structural changes on the surface of model catalyst directly (Figure S5). It is noteworthy that the Δµ spectra obtained from the experimental and theoretical HERFD-XANES spectrum, respectively, display a similar trend, the corresponding characteristic peak A (~8350 eV), whose intensity gradually increases with the potential induction, indicating that the model catalyst NiPc was distorted and the disordered D4h symmetry structure was formed during the reaction.
STRUCTURE-PERFORMANCE CORRELATION
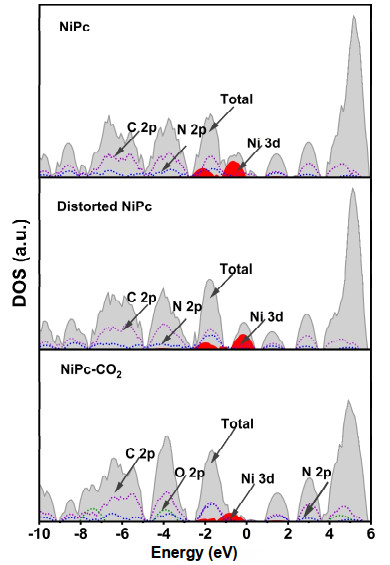
The pristine and CO2-absorbed catalytic surfaces were constructed for theoretical calculations to investigate absorbate-surface interactions. On the basis of operando HERFD-XANES analysis, the adsorption process and structure evolution of NiPc during CO2RR condition are definite. Unambiguously, we calculated the self consistently calculated density of states (DOS) of chemisorbed CO2 molecules on NiPc (Figure 4). As shown in Figure 4, both on the original NiPc and NiPc which undergoes structural evolution during the reaction, the center of the 3d band of Ni is close to the Fermi level, which is favorable for the adsorption of CO2 molecules. The d-band model is an approximate description of the bond formation at catalyst surface.[32, 33] As the central atom Ni protrudes upward, the d-band center displays a downward shift of 0.3 eV (Table S1). The adsorption capacity increases gradually with the more negative d-band center, indicating that the structural evolution has greatly affected the electronic characteristics. As the applied potential becomes more negative, the NiPc binds with a CO2 molecule, and the overlap between the C 2p and Ni 3d states increases. In addition, the d-band center moves upward by 0.2 eV (Table S1), indicating that the adsorbed CO2 molecule weakens the adsorption capacity of the surface for intermediates. Combined with the catalytic performance, the upward bulge of the metal atom at the center of the initial catalyst structure enhances the contact between the catalyst surface and the reactants, and we believe that the negative potential-induced structural evolution is responsible for the generation of CO products.
Figure 4
Figure 4.
Total density of states and partial density of states of NiPc, distorted NiPc and NiPc-CO2, respectively.
Besides the discussion of NiPc in CO2RR, the dynamic structural evolution of CoPc is also discussed. To reveal the structural evolution of CoPc during the reaction, we monitor the change of the catalyst active site with operando HERFD-XANES, which displays the Kβ1, 3-RIXS spectra of pristine CoPc and the catalyst during the CO2RR (Figure S9 and S10). In electrochemical experiments, with hydrogen and carbon monoxide as reaction products, CoPc has high selectivity to CO in a wide potential range. And then we integrated the profile along the constant emission energy at 7644 eV to obtain the corresponding HERFD-XANES spectrum (Figure S11). The adsorption edge positions of CoPc XANES spectra shift toward low-energy ranges with the increase of bias voltage, which can further speculate that the metal ions in the model catalyst CoPc are gradually reduced in the reaction.
CONCLUSION
In summary, operando X-ray techniques, including HERFDXANES, ∆µ analysis and spectroscopy simulation, were conducted to unveil the catalytic nature of the typical NiPc model catalyst system. Benefiting from superior high-energy resolution,
operando HERFD-XANES plays a vital role in determining the structural evolution of NiPc and the adsorption of intermediates during the catalytic reaction. NiPc is potentially induced to transform into an atom-dispersed low Ni(I) center, determining the intrinsic CO2 reduction activity. The operando HERFD-XANES analysis developed in this work provides a novel view of CO2RR, which can be conducive to understanding the operando surface mechanism in various system.
EXPERIMENTAL
Materials and Chemicals
β-Form nickel(II) phthalocyanine NiPc with dye content of 85%, β-form cobalt(II) phthalocyanine (CoPc) with dye content of 97% and carboxylated multiwalled carbon nanotubes (MWCNTs) were purchased from Sinopharm Chemical Reagent Co., Ltd., and Nafion was purchased from Sigma-Aldrich. All chemicals were used directly without further purification.
Synthesis of Model Catalyst
In the preparation of NiPc, 8 mg NiPc and 2 mg MWCNTs were weighted, mixed, and grinded vigorously for at least 1 h. The product was collected (hereinafter NiPc). Similarly, 8 mg CoPc and 2 mg MWCNTs were weighted, mixed, and grinded vigorously for at least 1 h, obtaining the hybrid CoPc catalyst.
Electrode Preparation
Dried NiPc (5 mg) was mixed with 980 μl of isopropanol and 20 μl of nafion (5 wt%), followed by ultrasonication for 1 h. The catalyst ink (20 μl) was dropped onto the electrodes using a pipette and dried under ambient air. The 20 μl of the catalyst ink contained 0.1 mg of NiPc-CNT. Similarly, CoPc-CNT was prepared in the same way to obtain the working electrode.
Electrochemical Measurements
A gas-tight electrolysis H-cell and a biologic VMP3 potentiostat were used to measure the electrocatalytic activities of the catalysis. And electrocatalysis studies were based on a three-electrode system in a H-cell separated with a Nafion ion exchange membrane (Nafion117, Dupont), equipped with a KCl-saturated Ag/AgCl electrode and a platinum wire as the reference and counter electrodes, respectively.
Product Analysis
During electrochemical reaction, the gaseous products from the outlet of the cathode compartment were directly discharged into the gas chromatograph (GC-2014, Shimadzu) equipped with a Molecular sieve-13X 60/80 column and a Plot-Q80/100 column and analyzed online. The faradaic efficiencies of the gas products were calculated by using the concentrations (ppm) detected by the GC as follows:
Where ppm is the concentration of the gaseous products CO or H2, $ {v}_{{CO}_{2}} $is the flow rate of CO2 (10 ml min-1), $ \alpha $is the quantity of transferred electrons for producing CO or H2 and Q (A·s) is the total quantity of electric charge.
Liquid products were analyzed by using the other off-line GC-2014 (Shimadzu) equipped with an autosampler and an OVI-G43 capillary column (Supelco, USA). The faradaic efficiencies of liquid products were calculated as follows:
Where CHCOOH (ppm) is the concentration of the product ethanol, V is the liquid volume in the cathodic chamber (30 mL), α is the quantity of transferred electrons and Q (A·s) is the total quantity of electric charge.
Measurements were made in a typical three-electrode setup under the same condition in electrochemical characterization case performed in a self-designed Teflon cell with a window sealed by Kepton tape. The von Hamos-geometry-type wavelength-dispersive X-ray spectrometer was set up at the BL14W1-XAFS beamline of the Shanghai Synchrotron Radiation Facility (SSRF). Fluorescence was spilt by the analyzer crystal Si(444) facet for Ni and Si(440) for Co, and the X-ray was allowed to transmit through the tape and catalyst. For HERFD-XANES, the dispersive von Hamous geometry type spectrometer was used. With such a spectrometer, the emission spectrum can be obtained in a single ''shot'', which can dramatically reduce the acquisition time, but at the cost of lower signal intensities and reduced energy resolution.[23] During the operando test, a self-designed electrochemical cell equipped with a peristaltic pump was used, and the CO2 in 0.5 M KHCO3 electrolyte was saturated and flowed into the cell at a flow rate of 1 ml/min. The working electrode was prepared by dropping the catalyst ink onto one side of a hydrophobic paper with a loading of 4 mg/cm2.
The ∆µ analysis of Ni K-edge HERFD-XANES was based on the normalized spectra data, and the difference spectra were obtained by the equation below:
Where µ(CO2, potential) is the normalized HERFD-XANES spectra of working electrode at different reaction potentials, and the µ(dry) is the normalized spectra of dry sample.
The Ni K-edge HERFD-XANES simulation was performed using FDMNES code with multiple scattering mode (Green) applying the muffin-tin potential.[34] The calculated radius was 6.5 Å with a self-consistent calculated radius of 6 Å.
DFT Calculations
The Vienna ab initio simulation package (VASP) was used for all DFT calculations.[35-37] The generalized gradient approximation (GGA) of Perdew-Burke-Ernzerhof (PBE)[38] was used to visualize the electron-ion interaction as well as electron-electron exchange and correlation functional, respectively.
The cutoff energy was set to 400 eV in the calculations. The simulated unit cells are constructed periodically, where the vacuum space was specified to be ~15 Å. All atomic coordinates were allowed to relax until calculated Hellmann-Feynman forces smaller than 0.05 eV/Å in geometric optimization. Monkhorst-Pack meshes of 6×6×1 k-point sampling in the Brillouin zone were employed for the NiPc.
ACKNOWLEDGEMENTS:
This work was supported by the National Natural Science Foundation of China (U1732267), Shanghai Science and Technology Development Funds (22YF1454500), Photon Science Center for Carbon Neutrality and Low-Carbon Conversion Science and Engineering Center.
COMPETING INTERESTS
The authors declare no competing interests.
Supplementary information is available for this paper at http://manu30.magtech.com.cn/jghx/EN/10.14102/j.cnki.0254-5861.2022-0133 ADDITIONAL INFORMATION For submission:https://www.editorialmanager.com/cjschem
[1]
Li, J.; Gong, J. Operando characterization techniques for electrocatalysis. Energy Environ. Sci. 2020, 13, 3748-3779. doi: 10.1039/D0EE01706J
[2]
Liu, M.; Pang, Y.; Zhang, B.; De Luna, P.; Voznyy, O.; Xu, J.; Zheng, X.; Dinh, C. T.; Fan, F.; Cao, C.; De Arquer, F. P.; Safaei, T. S.; Mepham, A.; Klinkova, A.; Kumacheva, E.; Filleter, T.; Sinton, D.; Kelley, S. O.; Sargent, E. H. Enhanced electrocatalytic CO2 reduction via field-induced reagent concentration. Nature2016, 537, 382-386. doi: 10.1038/nature19060
Zhang, Y. -J.; Sethuraman, V.; Michalsky, R.; Peterson, A. A. Competition between CO2 reduction and H2 evolution on transition-metal electrocatalysts. ACS Catal. 2014, 4, 3742-3748.
[5]
Kim, D.; Resasco, J.; Yu, Y.; Asiri, A. M.; Yang, P. Synergistic geometric and electronic effects for electrochemical reduction of carbon dioxide using gold-copper bimetallic nanoparticles. Nat. Commun. 2014, 5, 4948. doi: 10.1038/ncomms5948
[6]
Francke, R.; Schille, B.; Roemelt, M. Homogeneously catalyzed electroreduction of carbon dioxide-methods, mechanisms, and catalysts. Chem. Rev. 2018, 118, 4631-4701. doi: 10.1021/acs.chemrev.7b00459
[7]
Wang, M.; Torbensen, K.; Salvatore, D.; Ren, S.; Joulie, D.; Dumoulin, F.; Mendoza, D.; Lassalle-Kaiser, B.; Isci, U.; Berlinguette, C. P.; Robert, M. CO2 electrochemical catalytic reduction with a highly active cobalt phthalocyanine. Nat. Commun.2019, 10, 3602. doi: 10.1038/s41467-019-11542-w
[8]
Weng, Z.; Wu, Y. S.; Wang, M. Y.; Jiang, J. B.; Yang, K.; Huo, S. J.; Wang, X. F.; Ma, Q.; Brudvig, G. W.; Batista, V. S.; Liang, Y. Y.; Feng, Z. X.; Wang, H. L. Active sites of copper-complex catalytic materials for electrochemical carbon dioxide reduction. Nat. Commun. 2018, 9, 415. doi: 10.1038/s41467-018-02819-7
[9]
Wu, Y.; Jiang, Z.; Lu, X.; Liang, Y.; Wang, H. Domino electroreduction of CO2 to methanol on a molecular catalyst. Nature2019, 575, 639-642. doi: 10.1038/s41586-019-1760-8
[10]
Liu, J. Catalysis by supported single metal atoms. ACS Catal. 2016, 7, 34-59. doi: 10.1021/acscatal.6b01534
[11]
Yang, M.; Li, S.; Wang, Y.; Herron, J. A.; Xu, Y.; Allard, L. F.; Lee, S.; Huang, J.; Mavrikakis, M.; Flytzani-Stephanopoulos, M. Catalytically active Au-O(OH)x- species stabilized by alkali ions on zeolites and mesoporous oxides. Science2014, 346, 1498-1501. doi: 10.1126/science.1260526
[12]
Qiao, B.; Wang, A.; Yang, X.; Allard, L. F.; Jiang, Z.; Cui, Y.; Liu, J.; Li, J.; Zhang, T. Single-atom catalysis of CO oxidation using Pt1/FeOx. Nat. Chem.2011, 3, 634-641.
[13]
Zhong, M.; Tran, K.; Min, Y.; Wang, C.; Wang, Z.; Dinh, C. T.; De Luna, P.; Yu, Z.; Rasouli, A. S.; Brodersen, P.; Sun, S.; Voznyy, O.; Tan, C. S.; Askerka, M.; Che, F.; Liu, M.; Seifitokaldani, A.; Pang, Y.; Lo, S. C.; Ip, A.; Ulissi, Z.; Sargent, E. H. Accelerated discovery of CO2 electrocatalysts using active machine learning. Nature2020, 581, 178-183. doi: 10.1038/s41586-020-2242-8
[14]
Li, Y.; Cheng, W.; Su, H.; Zhao, X.; He, J.; Liu, Q. Operando infrared spectroscopic insights into the dynamic evolution of liquid-solid (photo)electrochemical interfaces. Nano Energy2020, 77, 105121. doi: 10.1016/j.nanoen.2020.105121
[15]
Dong, J. C.; Zhang, X. G.; Briega-Martos, V.; Jin, X.; Yang, J.; Chen, S.; Yang, Z. L.; Wu, D. -Y.; Feliu, J. M.; Williams, C. T.; Tian, Z. -Q.; Li, J. F. In situ Raman spectroscopic evidence for oxygen reduction reaction intermediates at platinum single-crystal surfaces. Nat. Energy2018, 4, 60-67. https://www.nature.com/articles/s41560-018-0292-z
[16]
Bergmann, A.; Martinez-Moreno, E.; Teschner, D.; Chernev, P.; Gliech, M.; De Araujo, J. F.; Reier, T.; Dau, H.; Strasser, P. Reversible amorphization and the catalytically active state of crystalline Co3O4 during oxygen evolution. Nat. Commun. 2015, 6, 8625. https://www.nature.com/articles/ncomms9625
[17]
Hutchings, G. S.; Zhang, Y.; Li, J.; Yonemoto, B. T.; Zhou, X.; Zhu, K.; Jiao, F. In situ formation of cobalt oxide nanocubanes as efficient oxygen evolution catalysts. J. Am. Chem. Soc. 2015, 137, 4223-4229. doi: 10.1021/jacs.5b01006
[18]
Hu, C.; Ma, Q.; Hung, S. -F.; Chen, Z. -N.; Ou, D.; Ren, B.; Chen, H. M.; Fu, G.; Zheng, N. In Situ electrochemical production of ultrathin nickel nanosheets for hydrogen evolution electrocatalysis. Chem.2017, 3, 122-133. https://www.sciencedirect.com/science/article/pii/S2451929417302243
[19]
Mei, B.; Liu, C.; Li, J.; Gu, S.; Du, X.; Lu, S.; Song, F.; Xu, W.; Jiang, Z. Operando HERFD-XANES and surface sensitive Δμ analyses identify the structural evolution of copper(II) phthalocyanine for electroreduction of CO2. J. Energy Chem.2022, 64, 1-7.
[20]
Hung, S. F.; Chan, Y. T.; Chang, C. C.; Tsai, M. K.; Liao, Y. F.; Hiraoka, N.; Hsu, C. S.; Chen, H. M. Identification of stabilizing high valent active sites by operando high-energy resolution fluorescence-detected X-ray absorption spectroscopy for high-efficiency water oxidation. J. Am. Chem. Soc. 2018, 140, 17263-17270. doi: 10.1021/jacs.8b10722
[21]
Kanan, M. W.; Yano, J.; Surendranath, Y.; Dinca, M.; Yachandra, V. K.; Nocera, D. G. Structure and valency of a cobalt-phosphate water oxidation catalyst determined by in situ X-ray spectroscopy. J. Am. Chem. Soc.2010, 132, 13692-13701. http://web.mit.edu/dincalab/papers/paper18p.pdf
[22]
Eisenberger, P.; Platzman, P. M.; Winick, H. X-ray resonant Raman scattering: observation of characteristic radiation narrower than the lifetime width. Phys. Rev. Lett.1976, 36, 623-626. doi: 10.1103/PhysRevLett.36.623
[23]
Bauer, M. HERFD-XAS and valence-to-core-XES: new tools to push the limits in research with hard X-rays? Phys. Chem. Chem. Phys.2014, 16, 13827-13837.
Al Samarai, M.; Delgado-Jaime, M. U.; Ishii, H.; Hiraoka, N.; Tsuei, K. -D.; Rueff, J. P.; Lassale-Kaiser, B.; Weckhuysen, B. M.; De Groot, F. M. F. 1s3p Resonant inelastic X-ray scattering of cobalt oxides and sulfides. J. Phys. Chem. C2016, 120, 24063-24069. https://dspace.library.uu.nl/handle/1874/341802
[28]
Yamamoto, T. Assignment of pre-edge peaks in K-edge X-ray absorption spectra of 3d transition metal compounds: electric dipole or quadrupole? X-ray Spectrom.2008, 37, 572-584.
Jia, Q.; Ramaswamy, N.; Hafiz, H.; Tylus, U.; Strickland, K.; Wu, G.; Barbiellini, B.; Bansil, A.; Holby, E. F.; Zelenay, P.; Mukerjee, S. Experimental observation of redox-induced Fe-N switching behavior as a determinant role for oxygen reduction activity. ACS Nano. 2015, 9, 12496-12505.
[31]
Yang, H. B.; Hung, S. -F.; Liu, S.; Yuan, K.; Miao, S.; Zhang, L.; Huang, X.; Wang, H. -Y.; Cai, W.; Chen, R.; Gao, J.; Yang, X.; Chen, W.; Huang, Y.; Chen, H. M.; Li, C. M.; Zhang, T.; Liu, B. Atomically dispersed Ni(I) as the active site for electrochemical CO2 reduction. Nat. Energy2018, 3, 140-147. https://www.nature.com/articles/s41560-017-0078-8
Norskov, J. K.; Abild-Pedersen, F.; Studt, F.; Bligaard, T. Density functional theory in surface chemistry and catalysis. Proc. Natl. Acad. Sci. U. S. A. 2011, 108, 937-943.
Kresse, G.; Hafner, J. Ab initio molecular dynamics for open-shell transition metals. Phys. Rev. B1993, 48, 13115-13118. doi: 10.1103/PhysRevB.48.13115
[36]
Kresse, G.; Furthmuller, J. Efficient iterative schemes for ab initio total-energy calculations using a plane-wave basis set. Phys. Rev. B1996, 54, 11169-11186. doi: 10.1103/PhysRevB.54.11169
Perdew, J. P.; Burke, K.; Ernzerhof, M. Generalized gradient approximation made simple. Phys. Rev. Lett.1996, 77, 3865-3868. doi: 10.1103/PhysRevLett.77.3865
Figure 1
(a) Experimental set up base on von Hamos geometry developed at BL14W1-XAFS beamline of SSRF. (b) Kβ1, 3-RIXS plane of Ni foil. The contour plane at the emission energy of ~8266.18 eV is the Kβ1, 3-RIXS plane. (c) Kβ1, 3-RIXS plane of NiPc. (d) Electronic transitions involved and studied in the prepeak signal of HERFD-XANES and Kβ1, 3-XES. (e) Kβ1, 3-RIXS plane of NiO. (f) HERFD-XANES (blue) and conventional XANES (pink) spectra of NiPc. The HERFD-XANES spectrum was obtained by integrating the RIXS intensity along the dashed line in (d) with a scale of 0.3 eV.
Figure 2
(a) Faradaic efficiency and total current density of NiPc at the applied potentials (0.5 M KHCO3 saturated by CO2). The faradaic efficiency is stated as an average and calculated at the steady-state current and product concentration. Operando Kβ1, 3-RIXS planes of NiPc without potential applied (b) and NiPc under (c-e) various potentials vs. RHE in a 0.5 M KHCO3 solution during the ECO2RR.
Figure 3
(a) Normalized K-edge HERFD-XANES of NiPc at various applied potentials vs. RHE during the CO2RR and corresponding standard references of Ni and NiO. The inset enlarges the pre-edge structure. (b) Ni K-edge XANES spectra of NiPc at various applied potentials vs. RHE during the CO2RR, where peaks A and B represent 1s→4px, y transitions and multiple scattering processes, respectively (inset shows the expanded pre-edge region). (c) Operando Ni K-edge ∆µ spectra of NiPc at various potentials vs. RHE by subtracting the dry HERFD-XANES spectrum. (d) The theoretical HERFD-XANES spectrum of NiPc without potential applied, NiPc at 0.6 V (vs. RHE), 0.9 V (vs. RHE), and 1.1 V (vs. RHE), obtained from FDMNES simulation. (e) The schemes show the corresponding calculation model for the XANES simulation (Ni (orange), N (blue), C (gray), O (red) and H (black)).

 DownLoad:

 下载:
下载:


