Figure 1.
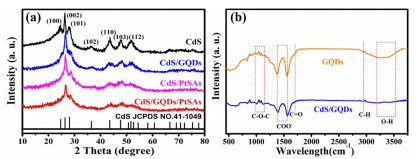
(a) XRD patterns of the CdS, CdS/GQDs, CdS/PtSAs and CdS/GQDs/PtSAs samples; (b) FTIR spectra of GQDs and CdS/GQDs.
Enhanced Photocatalytic H2-production Activity of CdS Nanoflower using Single Atom Pt and Graphene Quantum Dot as Dual Cocatalysts
Yi Yang , Jinsong Wu , Bei Cheng , Liuyang Zhang , Ahmed Abdullah Al-Ghamdi , Swelm Wageh , Youji Li

Given the shortage of fossil fuels and environmental pollution, the exploration of renewable energy becomes necessary.[1-5] It is a sustainable approach to converting solar energy into hydrogen fuel. As a promising H2 generation photocatalyst, CdS has the advantages of a relatively narrow bandgap, appropriate conduction and valence band positions, and high visible-light absorption efficiency.[6-9] Nevertheless, the H2-production rate is still limited by the rapid recombination of electron-hole pairs caused by the lack of surface-active sites and the long electron migration distance.[10, 11] To enhance hydrogen evolution performance, noble metals such as platinum, palladium, and gold are usually used as cocatalysts to promote charge separation.[12-18] Most noble metals exist in the form of nanoparticles, which have low atom utilization.[19, 20] While downsizing particles into single atoms is effective to maximize their atomic utilization and provide more active sites. Thus, numerous attempts have been made to stabilize high-density noble metal atoms on the photocatalyst for H2 production.[21-25]
As a most effective cocatalyst for hydrogen evolution, the dispersed platinum single atoms (PtSAs) greatly improve the utilization rate of noble metal materials. Thus, their photocatalytic efficiency is much higher than that of precious metal particles due to their maximum atomic efficiency as well as the admirable Gibbs free energy proton adsorption.[26-28] Besides, the low coordination environment of metal centers, electron confinement/quantum size effects and enhanced metal-carrier interaction also contribute to the enhanced catalytic performance of Pt single atoms.[29] Generally, single-atom catalysts (SACs) with high surface free energy usually cannot exist alone, and need to be stabilized by suitable support. Metal oxides such as TiO2, [30-32] FeOx, [33] and CeO2, [34, 35] have been reported as supports to disperse metal atoms. SACs can also be anchored on two-dimensional materials including MoS2[36, 37], g-C3N4[38, 39] and carbon materials.[40-45]
Carbon materials with high surface area, outstanding water solubility, excellent electrical conductivity and high chemical stability have proved to be the ideal supporting materials to enhance the metal-support interactions.[46] As a new type of carbon material, graphene quantum dots (GQDs) with a size less than 10 nm have attracted extensive attention in the field of photocatalysis.[47] Benefiting from their electronic and chemical features, they can not only serve as effective cocatalysts, but also provide anchoring sites for PtSAs to further improve photocatalytic performance.[48]
Herein, we firstly prepared hierarchical CdS nanosheets by a facile one-step microwave hydrothermal method. Especially, the ultrathin CdS nanosheets with thickness of 4 nm can greatly shorten the charge transfer distance, which is beneficial for improving the separation of photogenerated carriers and optical absorption. To further realize the uniform dispersion of GQDs on CdS nanosheets, freeze drying was adopted to maintain the original physical structure of the sample while avoiding the agglomeration of GQDs. Afterwards, single platinum atoms were deposited on CdS/GQDs nanocomposites by in-situ photocatalytic reduction at low temperatures. Compared with other synthetic strategies, this method can inhibit the migration of PtSAs precursor during the reduction reaction and effectively avoid the nucleation and growth of PtSAs. Hence, CdS/GQDs/PtSAs hybrid with abundant surface-active sites was constructed. It demonstrated superior charge transfer and separation ability, which improved solar energy utilization and charge separation rates. CdS/GQDs/PtSAs hybrid exhibited the highest hydrogen evolution activity with a rate of 13488 μmol h-1 g-1, 62 times higher than that of pristine CdS. This strategy is testified to significantly improve the photocatalytic performance of CdS derived from the synergistic catalytic effect of GQDs and PtSAs.
Structure and Morphology of Materials. The X-ray diffraction (XRD) patterns are shown in Figure 1a. The diffraction peaks of all samples can be easily indexed to the hexagonal CdS (JCPDS No. 41-1049). The peaks at 2
Fourier transform infrared (FTIR) spectroscopy was performed to analyze the functional groups present in GQDs as well as CdS/GQDs nanocomposite. As displayed in Figure 1b, GQDs exhibit specific absorption bands around 3364, 2950 and 1724 cm-1, which can be respectively attributed to the stretching vibration of O-H, C-H, and C=O. The peaks located at 1120 and 990 cm-1 are related to the C-O bonds and epoxy groups.[49, 50] The high intensity of the aforementioned peaks indicates that GQDs have similar structures to graphene oxide (GO) that have many oxygen-rich functional groups.[51] Due to the presence of chemical groups such as -OH, C=O and epoxy groups, GQDs have good solubility in water and most polar organic solvents. After loading GQDs on CdS, the composite demonstrates a similar spectrum to GQDs but with lower absorption intensity. The FTIR results suggest that GQDs have been successfully introduced facilitated by their small size.
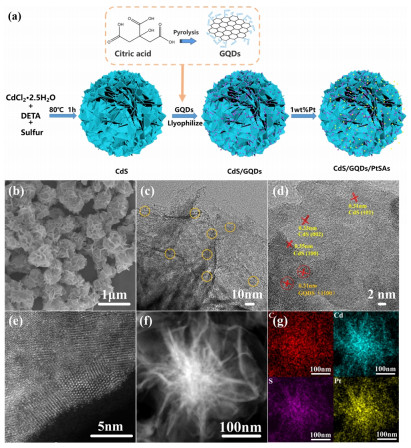
The overall synthetic procedure for the CdS/GQDs/PtSAs composites is presented in Figure 2a. The surface morphologies of samples were explored via field emission scanning electron microscopy (FESEM). Pristine CdS (Figure 2b) has a unique hierarchical flower structure composed of ultrathin nanosheets. Accordingly, such structure benefits light harvesting due to possible multiple scattering in the interlayer between the CdS nanosheets. In addition, their multiple exposed surfaces provide more active sites for hydrogen production (Figure S1a). After the decoration of GQDs and PtSAs, the inherent morphology of CdS remains almost the same, indicating that the nanostructures of CdS were not damaged (Figure S1b). The transmission electron microscopic (TEM) image in Figure 2c exhibits the uniform distribution of nanometer-sized GQDs on the surface of CdS nanosheets. The high-resolution TEM (HRTEM) image in Figure 2d confirms the crystallinity of CdS nanosheets. The lattice fringes of CdS nano-sheets with a d spacing of approximately 0.31 and 0.33 nm can be assigned to the (0 0 2) and (1 0 1) crystal planes of CdS, which correlates well with the XRD data in Figure 1a. It can be seen that Figure S1c displays lattice fringes with a spacing of 0.21 nm, corresponding to the (1100) crystal plane of graphene.[47] Furthermore, the microstructure and composition of materials at the atomic scale can be observed from HAADF-STEM (Figure 2e and 2f) images with single-atom resolution. Specifically, the bright spots are assigned to PtSAs which are uniformly anchored on the whole surface of CdS/GQDs nanosheets with little aggregation. Besides, the EDS spectrum (Figure S2) and elemental mapping for CdS/GQDs/PtSAs reveal the spatial distributions of Cd, S, C and Pt. The elemental mapping also reflects that PtSAs are evenly distributed in the samples (Figure 2g).
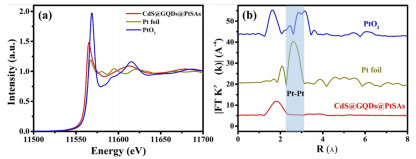
To further confirm the local structure of single-atom Pt in CdS/GQDs/PtSAs, the X-ray absorption near edge structure (XANES) and extended X-ray absorption fine structure (EXAFS) were performed to investigate the electronic structure and coordination environment. Figure 3a shows the Pt L3-edge XANES spectra of CdS/GQDs/PtSAs, Pt foil and PtO2. The absorption edge of CdS/GQDs/PtSAs is higher than that of Pt foil, demonstrating that Pt is partially oxidized in CdS/GQDs/PtSAs. As further revealed by the k3-weighted EXAFS (Figure 3b), no obvious Pt-Pt coordination peak at 2.6 Å was observed in CdS/GQDs/ PtSAs, confirming the presence of PtSAs.[52] Its single-atom distribution accords with the HAADF-STEM image. In addition, a dominant peak centered at around 1.9 Å is observed in CdS/GQDs/PtSAs, which can be assigned to the Pt-C bonding according to previous reports.[53, 54] These results indicate that Pt atoms can be stabilized and integrated into a suitable supporting medium such as GQDs.
The thickness of the obtained ultrathin CdS nanosheets is about 4 nm according to AFM images (Figure 4a-b). The BET specific surface area (SBET) and corresponding pore size distribution of samples were investigated using N2 adsorption-desorption isotherms (Figure 4c). All samples exhibit typical type-IV isotherms, which indicates the presence of mesopores within CdS petals. The shape of the peculiar hysteresis loops originates from the overlap of the type H2 and H3 hysteresis loops. The hysteresis loops of H2 at the relative pressure (p/p0) range of 0.5-0.9 imply the formation of a network of interconnected pores produced by the originally produced CdS nanoparticles within the nanosheets. At the same time, the type H3 hysteresis loops at a higher relative pressure (p/p0) ranging from 0.9 to 1.0 indicate the presence of slit-shaped macropores, which is consistent with the FESEM image of the CdS (Figure 2b). In the corresponding pore size distribution curves (Figure 4c inset), all the samples possess two peaks centered at 2.5 and 80 nm, confirming the coexistence of mesopores formed by the aggregation of primary CdS particles and macropores formed by the self-assembly of CdS nanosheets.[55, 56]
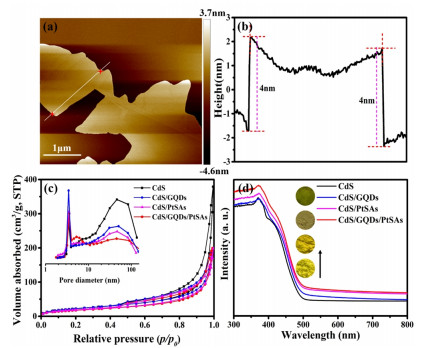
Table 1 lists the Brunauer-Emmett-Teller specific surface area (SBET), pore volume (Vp) and average pore diameter (dp) of all the samples. The introduction of GQDs and PtSAs on the surface of CdS nanosheets has a negligible effect on its pore size distribution curve and N2 adsorption-desorption isotherm. The SBET of CdS, CdS/GQDs, CdS/PtSAs and CdS/GQDs/PtSAs gradually decreases from 85 to 83, 79 and 72 m2 g-1. This is because GQDs and PtSAs partially block some mesopores on the CdS nanosheet surface.
 DownLoad:
CSV
DownLoad:
CSV
| Sample | SBET (m2/g) | Vp (cm3/g) | dp (nm) |
| CdS | 85 | 0.28 | 13.4 |
| CdS/GQDs | 83 | 0.21 | 11.6 |
| CdS/PtSAs | 79 | 0.20 | 10.1 |
| CdS/GQDs/PtSAs | 72 | 0.19 | 9.8 |
The optical absorption features and light-harvesting ability of the CdS, CdS/GQDs, CdS/PtSAs, and CdS/GQDs/PtSAs samples were characterized by the UV/Vis diffuse reflectance spectra (DRS). As shown in Figure 4d, the substantial enhancement of absorption at a wavelength around 500 nm correlates with the intrinsic bandgap absorption of CdS. And the bandgap of CdS is estimated to be about 2.4 eV. After loading GQDs and PtSAs, the absorption edge exhibits a slight redshift. Also, enhanced light absorbance is observed for the CdS/GQDs, CdS/PtSAs, and CdS/GQDs/PtSAs samples in the visible-light range (400-800 nm), which is consistent with the color change of the samples from light yellow to viridescent. In short, the synergy of GQDs and PtSAs can ameliorate the optical properties of CdS nanosheets.[57, 58]
Photocatalytic Activity Measurement. The photocatalytic hydrogen evolution activity of the prepared samples was evaluated under visible light illumination (≥ 420 nm) with lactic acid as the sacrificial agent. As shown in Figure 5a, the pure CdS exhibits a relatively low hydrogen evolution rate of 213 μmol h-1 g-1, which can be attributed to the facile recombination of photogenerated carriers. The loading amount of GQDs has a significant influence on the photocatalytic hydrogen evolution performance of CdS. After adding 1 wt% GQDs to CdS, the composite photocatalyst exhibits the highest H2 rate of 513 μmol h-1 g-1. The growth decreases dramatically after adding GQDs up to 5 wt%, which can be attributed to the influence of opacity and light scattering, preventing effective absorption of light and reducing active sites.
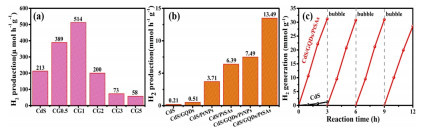
With the introduction of 1 wt% GQDs and 1 wt% Pt, the H2 evolution rate of composite samples shows an upward trend in comparison with the pure CdS. Figure 5b displays that CdS or CdS/GQDs loaded with PtSAs has better hydrogen production activity than Pt particles (PtNPs). This result is attributed to the higher utilization rate of isolated platinum atoms than platinum particles. The closer contact and good incorporation among PtSAs, GQDs and CdS is conducive to accelerating the transfer of carriers. When PtSAs and GQDs coexist on the CdS surface for the CdS/GQDs/PtSAs sample, it shows the highest hydrogen evolution activity with a rate of 13488 μmol h-1 g-1 as well as the maximum apparent quantum efficiency (AQE) of 35.5%. The energy conversion efficiency is estimated to be ca. 13.05%. As shown in Table S1, CdS/GQDs/PtSAs, in this work, outperforms most of the CdS-based photocatalysts reported previously. The evolution of dense hydrogen bubbles is apparent over the composite sample, whereas this phenomenon is hardly observed over the undecorated CdS (Supplementary video). The enhanced photocatalytic performance can be ascribed to the following reasons: 1) GQDs and PtSAs can accelerate the separation and transfer of charges on CdS nanosheets in order to retard the recombination of photogenerated electron-hole pairs. 2) The light absorption of CdS/GQDs/PtSAs sample was enhanced in the visible-light regions, and the effective light harvesting assisted in photocatalytic hydrogen production. 3) The existence of the "heating effect" caused by GQDs and PtSAs promotes the interaction of photon energy with the lattice, the lattice vibration intensifies and the temperature rises, which contributes to the reduction reaction of photocatalytic hydrogen production. It is reasonable that the synergetic effects of PtSAs and GQDs play a vital part in facilitating photocatalytic reactions of the CdS. Figure 5c displays recyclability of photocatalytic H2 production over CdS and CdS/GQDs/PtSAs samples under visible-light irradiation. After four recycles, the CdS/GQDs/PtSAs sample exhibits favorable stability after 12 h visible light irradiation. It can be seen from Figure S3 that the XRD pattern of CdS/GQDs/PtSAs does not change significantly after the cyclic stability test. Moreover, the stable H2 evolution rate of CdS/GQDs/PtSAs confirms the stability of PtSAs and GQDs in the CdS sample.
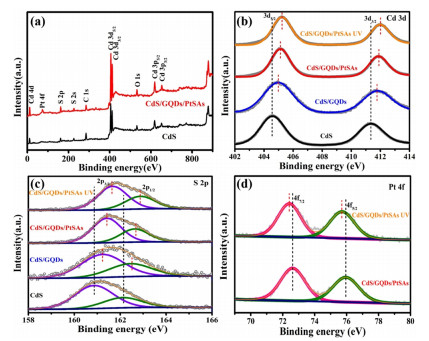
Photocatalytic Mechanism of CdS/GQDs/PtSAs. To investigate the surface chemical composition and chemical status of all the studied samples, XPS measurements were carried out.[59, 60] The survey spectrum of CdS/GQDs/PtSAs sample reveals the existence of Cd, S, C and Pt elements (Figure 6a). The high-resolution spectrum of C 1s (Figure S4) is deconvoluted into four peaks at 284.6, 286.8, 288.5 and 290.3 eV for the CdS/GQDs sample, corresponding to sp2 graphite carbon (C=C), epoxy/hydroxyls (C–O), carbonyls (C=O) and carboxyl (COOH), respectively. The as-prepared GQDs are rich in oxygen-containing functional groups, consistent with the FTIR spectrum. In Figure 6b, Cd 3d XPS spectrum from CdS reveals two obvious peaks located at 404.8 and 411.5 eV, which can be respectively ascribed to the binding energies of Cd 3d5/2 and Cd 3d3/2 of Cd2+. Besides, the peaks of S 2p3/2 and S 2p1/2 in the S 2p spectrum (Figure 6c) are located at 160.8 and 162.0 eV, respectively. For CdS/GQDs/PtSAs, Pt is present, confirming the successful incorporation of Pt into CdS/GQDs. The Pt 4f spectrum of CdS/GQDs/PtSAs displays two main peaks located at 72.6 and 75.9 eV, which are assigned to Pt 4f7/2 and Pt 4f5/2, respectively (Figure 6d). Notably, both Cd 3d and S 2p peak positions exhibit a gradual positive shift from pure CdS to CdS/GQDs, demonstrating the transfer of free electrons from CdS to GQDs after combination. After the deposition of PtSAs on CdS/GQDs, the peaks of Cd 3d and S 2p further shift positively, indicating that free electrons are further transferred to PtSAs. When exposed to light, the binding energies of both Cd 3d and S 2p for CdS/GQDs/PtSAs are increased by 0.2 eV in comparison with those in dark, indicating that the transfer direction of the photoexcited electrons is preserved while the transfer degree reinforces. On the contrary, the binding energies of Pt 4f in CdS/ GQDs/PtSAs (72.5, 75.8 eV) are smaller than those in dark (72.6, 75.9 eV), indicating that more oxidized state Pt existed in the CdS/GQDs/PtSAs. The negative shift of corresponding Pt 4f peaks further manifests that PtSAs are electron acceptors in the composite.
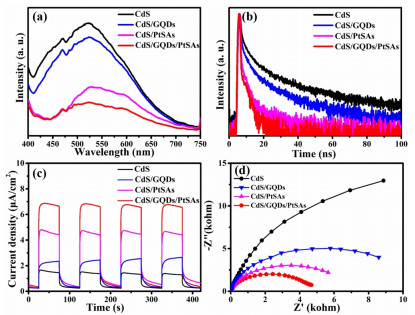
Steady-state photoluminescence (PL) and time-resolved fluorescence (TRPL) spectroscopy were used for exploring the separation and transfer efficiency of photogenerated electron-hole pairs. Figure 7a shows the steady-state photoluminescence (PL) spectra of as-obtained samples. The PL intensity of CdS/GQDs/PtSAs is considerably lower in comparison to pristine CdS under 400 nm light excitation, which can be attributed to effective electron transfer through CdS to GQDs and PtSAs. Furthermore, TRPL spectra revealed the lifetime of photogenerated charge carriers (Figure 7b). A double-exponential model function fitting was adopted to analyze the photoluminescence decay curves. As Table 2 summarizes, the fitting result illustrates that the average lifetime of CdS/GQDs/PtSAs exhibits faster decay than that of CdS, confirming that PtSAs and GQDs have better electron trapping ability. Compared with CdS/GQDs and CdS/PtSAs samples, CdS/GQDs/PtSAs samples have the lowest PL strength and decay life. In other words, the composite possesses a lower recombination rate, better electron-hole separation ability, and long-survived photogenerated electrons.[61, 62]
 DownLoad:
CSV
DownLoad:
CSV
| Sample | τ1 (ns) |
A1 (%) |
τ2 (ns) |
A2 (%) |
Average lifetime (ns) |
| CdS | 2.50 | 79.80 | 15.66 | 20.18 | 10.57 |
| CdS/GQDs | 2.38 | 82.40 | 14.41 | 17.60 | 9.16 |
| CdS/PtSAs | 2.13 | 92.26 | 12.59 | 7.74 | 5.59 |
| CdS/GQDs/PtSAs | 1.85 | 93.40 | 9.40 | 6.60 | 3.85 |
To further investigate the photocatalytic mechanism, a series of photoelectrochemical measurements were acquired in a typical three-electrode system. Photocurrents can reflect the generation and separation of electron-hole pairs and their transfer efficiency on the semiconductor surface.[63, 64] The transient photocurrent responses of CdS, CdS/GQDs, CdS/PtSAs, and CdS/GQDs/PtSAs with on-off cycles of 400 nm LED-light irradiation are shown in Figure 7c. The pristine CdS exhibits a relatively low photocurrent response due to the fast electron-hole recombination. The enhanced photocurrent responses of CdS/GQDs and CdS/PtSAs indicate that either GQDs or PtSAs facilitate electron extraction, which is beneficial for improving the separation and transfer efficiency of the photoinduced carriers. The CdS/GQDs/PtSAs sample exhibits the highest photocurrent density, implying that the synergy between GQDs and PtSAs further improves charge separation.
As shown in Figure 7d, the charge transfer resistance of samples was further investigated by electrochemical impedance spectra (EIS). Generally, a smaller arc radius of the EIS spectrum reflects smaller charge transfer resistance, implying that the photocatalyst can accelerate the photo-generated charge separation more effectively. Apparently, CdS/GQDs/PtSAs shows the lowest charge transfer resistance while the pristine CdS shows the highest. The trend of impedance is consistent with that of photocurrent intensity. Furthermore, Mott-Schottky experiment was performed to estimate the flat-band potential of CdS. As shown in Figure S5, all the Mott-Schottky curves have positive slopes, suggesting that CdS is an n-type semiconductor. The flat-band potential of CdS calculated from the intercept of the linear graph with the horizontal axis is -0.45 V versus the normal hydrogen electrode (NHE). The flat band potential is very approaching to conduction band (CB) position. Due to the negative flat band potential of CdS, the photogenerated electrons have sufficient reduction capacity.
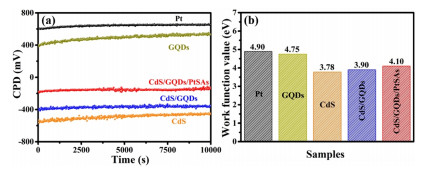
To further investigate the interfacial charge transfer in CdS/GQDs/PtSAs nanocomposite samples, the contact potential difference (CPD) of CdS, GQDs and PtSAs samples was tested by Kelvin probe. The work function values of Pt, GQDs, CdS, CdS/GQDs and CdS/GQDs/PtSAs samples derived from CPD (Figure 8a) are 4.90, 4.75, 3.78, 3.90, 4.10, respectively (Figure 8b). Accordingly, the Fermi level (Ef) values of Pt, GQDs, CdS, CdS/GQDs and CdS/GQDs/PtSAs samples were calculated to be -4.90, -4.75, -3.78, -3.90 and -4.10 eV, respectively. The difference in Fermi levels results in interfacial charge transfer between CdS, GQDs and PtSAs.[65] Since CdS has a higher Ef, the charge will transfer from CdS to GQDs until the contact interface reaches the Fermi level equilibrium. When PtSAs are deposited on CdS/GQDs composite, the electrons may migrate from GQDs to PtSAs driven by the most negative Ef of Pt. This is attributed to the fact that Pt has the lowest Ef and the largest work function, which makes it easier to capture photoexcited electrons. Therefore, the photogenerated electrons migration pathway is evidenced from CdS nanosheets through GQDs to PtSAs.
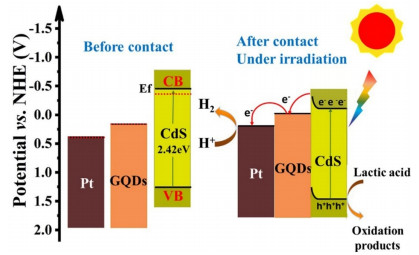
Based on the experimental results, the possible photocatalytic mechanism for photocatalytic H2 generation on CdS/GQDs/PtSAs composites is proposed in Figure 9. The energy band structure can be determined since the conduction band (CB) levels, the values of Eg and Fermi levels are obtained. Before contact, the Fermi level of GQDs is lower than that of CdS. A Schottky barrier is formed at the interface between GQDs and CdS. Upon visible light irradiation, the electrons in CdS are excited from the valence band (VB) to CB, and then cross the Schottky barrier to arrive at GQDs, whereas the holes remain in the VB of CdS. After PtSAs are anchored on the surface of the CdS/GQDs composite, photogenerated electrons will transfer from GQDs to PtSAs and combine with the protons to form hydrogen atoms. The effective electron transfer pathway is highly consistent with the XPS results. GQDs possess excellent electrical conductivity and reservoir properties, forming close contact with PtSAs and CdS nanosheets. It can be inferred that GQDs act as an effective mediator of electron transfer, and PtSAs serve as electron acceptors. The synergetic effects of PtSAs and GQDs play a vital role in upgrading the photocatalytic H2 production performance of the CdS nanosheets due to the effective electron transfer pathway among CdS, GQDs and PtSAs.
In summary, hierarchically nanostructured CdS/GQDs/PtSAs composite photocatalysts were successfully prepared through a simple microwave-hydrothermal method followed by lyophilization and in-situ photocatalytic reduction method. The resultant CdS/GQDs/PtSAs photocatalyst exhibited enhanced and durable visible-light photocatalytic H2 production performance (13488 μmol h-1 g-1) than the pure CdS, CdS/GQDs, and CdS/PtSAs samples. The CdS/GQDs/PtSAs photocatalyst also achieved apparent quantum efficiency of 35% at 420 nm and an energy conversion efficiency of 13.05%. The outstanding photocatalytic activity is mainly ascribed to the effective electron transfer among CdS, GQDs and PtSAs, as well as the collaboration of enhanced visible light absorption intensity and plentiful proton reduction sites contributed by GQDs and PtSAs. This study aims at providing new insights into the design and fabrication of single-atom photocatalysts for increasing photocatalytic activity.
Materials. Analytical reagent (AR)-grade chemicals were procured and used without further purification. Citric acid (CA), cadmium chloride hemi(pentahydrate) (CdCl2·2.5H2O), S powder, ethanol and sodium hydroxide (NaOH) were obtained from Sinopharm Chemical Reagent Co., Ltd. (Shanghai, China). Diethylenetriamine (DETA) and H2PtCl6·6H2O were purchased from Macklin. Deionized water was used in all experiments.
Synthesis of GQDs. GQDs were prepared by pyrolyzing CA as previously reported.[51] Typically, 2 g of CA was put into a 20 mL round-bottomed flask and heated to 200 ℃. After 20 mins, the white solid was liquated and changed to orange. The obtained orange products were dispersed in 20 mL of 50 mg mL-1 NaOH solution to obtain a neutral solution which was then transferred into a 50 mL Teflon-lined autoclave and heated at 180 ℃ for 12 h. After hydrothermal reaction, the reactor was naturally cooled. Then the aqueous solution of GQDs was obtained.
Synthesis of CdS. Hierarchically CdS nanosheets used herein were prepared by a facile one-step microwave-assisted solvothermal method.[66] Firstly, 1 mmol of CdCl2·2.5H2O was suspended in 25 mL of DETA and ultrasonicated for 15 mins. Then, 0.110 g of S powder was added to the above solution. After another ultrasonication treatment of 20 mins, the mixture was transferred into a 50 mL Teflon-lined autoclave, which was placed in a microwave-hydrothermal synthesis system (MDS-6, Sineo, China), and heated at 80 ℃ for 1 h. After cooling to room temperature, the resultant yellow precipitate was centrifuged with ethanol and deionized water for several times, and then dried in a vacuum drying oven at 60 ℃ for 12 h.
Synthesis of CdS/GQDs. GQDs decorated CdS nanosheets were prepared by a simple lyophilization method. Typically, 100 mg of CdS nanosheets was dispersed into 20 mL of 20 mg mL-1 GQDs aqueous solution and stirred for 4 hours to maintain uniform dispersion. Then, the well-mixed solution was frozen with liquid nitrogen, followed by a freeze-drying process for 24 h. Then CdS/GQDs nanocomposites were obtained after a freeze-drying process. Besides, a series of CdS/GQDs nanocomposites with different weight ratios of GQDs were referred to as CGx, where x represents the theoretical weight ratios of GQDs (x = 0.5, 1, 2, 3, and 5 wt%).
Synthesis of CdS/GQDs/PtSAs Nanosheets. CdS/GQDs/PtSAs nanocomposites were synthesized by a photochemical reduction method. Typically, 20 mg of CdS/GQDs nanocomposites were dispersed into 10 mL 1 wt% H2PtCl6 aqueous solution with continuous stirring for 12 h. Then, the mixture was rapidly frozen by liquid nitrogen and irradiated under a 350 W Xenon arc lamp. After 5 min irradiation, the ice layer was close to melting. After centrifu-gation, CdS/GQDs/PtSAs samples were rinsed with deionized water and ethanol for several times and dried in a vacuum drying oven at 60 ℃ for more than 12 hours. In contrast, the platinum particles were loaded by the commonly-used photoreduction method, in which a certain amount of chloro-platinic acid was added to the reaction system and illuminated for 30 min.
Fei, X.; Tan, H.; Cheng, B.; Zhu, B.; Zhang, L. 2D/2D black phosphorus/ g-C3N4 S-scheme heterojunction photocatalysts for CO2 reduction investigated using DFT calculations. Acta Phys. Chim. Sin. 2021, 37, 2010027.
Zhu, B.; Cheng, B.; Fan, J.; Ho, W.; Yu, J. g-C3N4-based 2D/2D composite heterojunction photocatalyst. Small Struct. 2021, 2, 2100086. doi: 10.1002/sstr.202100086
Jiang, Z.; Chen, Q.; Zheng, Q.; Shen, R.; Zhang, P.; Li, X. Constructing 1D/2D schottky-based heterojunctions between Mn0.2Cd0.8S nanorods and Ti3C2 nanosheets for boosted photocatalytic H2 evolution. Acta Phys. Chim. Sin. 2021, 37, 2010059.
Wang, Z.; Fan, J.; Cheng, B.; Yu, J.; Xu, J. Nickel-based cocatalysts for photocatalysis: hydrogen evolution, overall water splitting and CO2 reduction. Mater. Today Phys. 2020, 15, 100279. doi: 10.1016/j.mtphys.2020.100279
Ma, X.; Lin, H.; Li, Y.; Wang, L.; Pu, X.; Yi, X. Dramatically enhanced visible-light-responsive H2 evolution of Cd1-xZnxS via the synergistic effect of Ni2P and 1T/2H MoS2 cocatalysts. Chin. J. Struc. Chem. 2021, 40, 7-22.
Di, T.; Zhang, L.; Cheng, B.; Yu, J.; Fan, J. CdS nanosheets decorated with Ni@graphene core-shell cocatalyst for superior photocatalytic H2 production. J. Mater. Sci. Technol. 2020, 56, 170-178. doi: 10.1016/j.jmst.2020.03.032
Xiang, X.; Zhu, B.; Cheng, B.; Yu, J.; Lv, H. Enhanced photocatalytic H2-production activity of CdS quantum dots using Sn2+ as cocatalyst under visible light irradiation. Small 2020, 16, 2001024. doi: 10.1002/smll.202001024
Liu, X.; Sayed, M.; Bie, C.; Cheng, B.; Hu, B.; Yu, J.; Zhang, L. Hollow CdS-based photocatalysts. J. Materiomics 2021, 7, 419-439. doi: 10.1016/j.jmat.2020.10.010
Bai, J.; Shen, R.; Jiang, Z.; Zhang, P.; Li, Y.; Li, X. Integration of 2D layered CdS/WO3 S-scheme heterojunctions and metallic Ti3C2 MXene-based ohmic junctions for effective photocatalytic H2 generation. Chin. J. Catal. 2022, 43, 359-369. doi: 10.1016/S1872-2067(21)63883-4
Ding, C.; Zhao, C.; Cheng, S.; Yang, X. Ultrahigh photocatalytic hydrogen evolution performance of coupled 1D CdS/1T-phase dominated 2D WS2 nanoheterojunctions. Chin. J. Catal. 2022, 43, 403-409. doi: 10.1016/S1872-2067(21)63844-5
Cheng, C.; He, B.; Fan, J.; Cheng, B.; Cao, S.; Yu, J. An inorganic/ organic S-scheme heterojunction H2-production photocatalyst and its charge transfer mechanism. Adv. Mater. 2021, 33, 2100317. doi: 10.1002/adma.202100317
Wang, T.; Tao, X.; Li, X.; Zhang, K.; Liu, S.; Li, B. Synergistic Pd single atoms, clusters, and oxygen vacancies on TiO2 for photocatalytic hydrogen evolution coupled with selective organic oxidation. Small 2021, 17, 2006255. doi: 10.1002/smll.202006255
Zeng, L.; Dai, C.; Liu, B.; Xue, C. Oxygen-assisted stabilization of single-atom Au during photocatalytic hydrogen evolution. J. Mater. Chem. A 2019, 7, 24217-24221. doi: 10.1039/C9TA10290F
Zhou, P.; Zhang, Q.; Chao, Y.; Wang, L.; Li, Y.; Chen, H.; Gu, L.; Guo, S. Partially reduced Pd single atoms on CdS nanorods enable photocatalytic reforming of ethanol into high value-added multicarbon compound. Chem 2021, 7, 1033-1049. doi: 10.1016/j.chempr.2021.01.007
Wang, C.; Wang, K.; Feng, Y.; Li, C.; Zhou, X.; Gan, L.; Feng, Y.; Zhou, H.; Zhang, B.; Qu, X.; Li, H.; Li, J.; Li, A.; Sun, Y.; Zhang, S.; Yang, G.; Guo, Y.; Yang, S.; Zhou, T.; Dong, F.; Zheng, K.; Wang, L.; Huang, J.; Zhang, Z.; Han, X. Co and Pt dual-single-atoms with oxygen-coordinated Co-O-Pt dimer sites for ultrahigh photocatalytic hydrogen evolution efficiency. Adv. Mater. 2021, 33, 2003327. doi: 10.1002/adma.202003327
Gao, D.; Xu, J.; Wang, L.; Zhu, B.; Yu, H.; Yu, J. Optimizing atomic hydrogen desorption of sulfur-rich NiS1+x cocatalyst for boosting photocatalytic H2 evolution. Adv. Mater. 2022, 34, 2108475. doi: 10.1002/adma.202108475
Wageh, S.; Al-Ghamdi, A. A.; Xu, Q. Core-shell Au@NiS1+x cocatalyst for excellent TiO2 photocatalytic H2 production. Acta Phys. Chim. Sin. 2022, 38, 2202001.
Guo, Y.; Zhou, Q.; Chen, X.; Fu, Y.; Lan, S.; Zhu, M.; Du, Y. Near-infrared response Pt-tipped Au nanorods/g-C3N4 realizes photolysis of water to produce hydrogen. J. Mater. Sci. Technol. 2022, 119, 53-60. doi: 10.1016/j.jmst.2021.11.067
Tang, S.; Xia, Y.; Fan, J.; Cheng, B.; Yu, J.; Ho, W. Enhanced photocatalytic H2 production performance of CdS hollow spheres using C and Pt as bi-cocatalysts. Chin. J. Catal. 2021, 42, 743-752. doi: 10.1016/S1872-2067(20)63695-6
Wang, Z.; Wang, L.; Cheng, B.; Yu, H.; Yu, J. Photocatalytic H2 evolution coupled with furfuralcohol oxidation over Pt-modified ZnCdS solid solution. Small Methods 2021, 5, 2100979. doi: 10.1002/smtd.202100979
Gupta, S. S.; van Huis, M. A. Intermetallic differences at CdS-metal (Ni, Pd, Pt, and Au) interfaces: from single-atom to subnanometer metal clusters. J. Phys. Chem. C 2019, 123, 9298-9310.
Zhu, Y.; Wang, T.; Xu, T.; Li, Y.; Wang, C. Size effect of Pt co-catalyst on photocatalytic efficiency of g-C3N4 for hydrogen evolution. Appl. Surf. Sci. 2019, 464, 36-42. doi: 10.1016/j.apsusc.2018.09.061
Shi, X.; Mao, L.; Dai, C.; Yang, P.; Zhang, J.; Dong, F.; Zheng, L.; Fujitsuka, M.; Zheng, H. Inert basal plane activation of two-dimensional ZnIn2S4 via Ni atom doping for enhanced co-catalyst free photocatalytic hydrogen evolution. J. Mater. Chem. A 2020, 8, 13376-13384. doi: 10.1039/D0TA03992F
Cheng, L.; Zhang, P.; Wen, Q.; Fan, J.; Xiang, Q. Copper and platinum dual-single-atoms supported on crystalline graphitic carbon nitride for enhanced photocatalytic CO2 reduction. Chin. J. Catal. 2022, 43, 451-460. doi: 10.1016/S1872-2067(21)63879-2
Shi, X.; Dai, C.; Wang, X.; Hu, J.; Zhang, J.; Zheng, L.; Mao, L.; Zheng, H.; Zhu, M. Protruding Pt single-sites on hexagonal ZnIn2S4 to accelerate photocatalytic hydrogen evolution. Nat. Commun. 2022, 13, 1287. doi: 10.1038/s41467-022-28995-1
Piccolo, L.; Afanasiev, P.; Morfin, F.; Len, T.; Dessal, C.; Rousset, J. L.; Aouine, M.; Bourgain, F.; Aguilar-Tapia, A.; Proux, O.; Chen, Y.; Soler, L.; Llorca, J. Operando X-ray absorption spectroscopy investigation of photo-catalytic hydrogen evolution over ultradispersed Pt/TiO2 catalysts. ACS Catal. 2020, 10, 12696-12705. doi: 10.1021/acscatal.0c03464
Su, L.; Wang, P.; Wang, J.; Zhang, D.; Wang, H.; Li, Y.; Zhan, S.; Gong, J. Pt-Cu interaction induced construction of single Pt sites for synchronous electron capture and transfer in photocatalysis. Adv. Funct. Mater. 2021, 31, 2104343. doi: 10.1002/adfm.202104343
Xia, Y.; Sayed, M.; Zhang, L.; Cheng, B.; Yu, J. Single-atom heterogeneous photocatalysts. Chem. Catal. 2021, 1, 1173-1214. doi: 10.1016/j.checat.2021.08.009
Qiu, S.; Shen, Y.; Wei, G.; Yao, S.; Xi, W.; Shu, M.; Si, R.; Zhang, M.; Zhu, J.; An, C. Carbon dots decorated ultrathin CdS nanosheets enabling in-situ anchored Pt single atoms: a highly efficient solar-driven photocatalyst for hydrogen evolution. Appl. Catal. B-Environ. 2019, 259, 118036. doi: 10.1016/j.apcatb.2019.118036
Jeantelot, G.; Qureshi, M.; Harb, M.; Ould-Chikh, S.; Anjum, D. H.; Abou-Hamad, E.; Aguilar-Tapia, A.; Hazemann, J. -L.; Takanabe, K.; Basset, J. -M. TiO2-supported Pt single atoms by surface organometallic che-mistry for photocatalytic hydrogen evolution. Phys. Chem. Chem. Phys. 2019, 21, 24429-24440. doi: 10.1039/C9CP04470A
Thang, H. V.; Pacchioni, G.; DeRita, L.; Christopher, P. Nature of stable single atom Pt catalysts dispersed on anatase TiO2. J. Catal. 2018, 367, 104-114. doi: 10.1016/j.jcat.2018.08.025
Zhou, X. TiO2-supported single-atom catalysts for photocatalytic reactions. Acta Phys. Chim. Sin. 2021, 37, 2008064.
Lin, J.; Wang, A.; Qiao, B.; Liu, X.; Yang, X.; Wang, X.; Liang, J.; Li, J.; Liu, J.; Zhang, T. Remarkable performance of Ir1/FeOx single-atom catalyst in water gas shift reaction. J. Am. Chem. Soc. 2013, 135, 15314-15317. doi: 10.1021/ja408574m
Li, F.; Li, L.; Liu, X.; Zeng, X. C.; Chen, Z. High-performance Ru1/CeO2 single-atom catalyst for CO oxidation: a computational exploration. ChemPhysChem 2016, 17, 3170-3175. doi: 10.1002/cphc.201600540
Chen, F.; Li, T.; Pan, X.; Guo, Y.; Han, B.; Liu, F.; Qiao, B.; Wang, A.; Zhang, T. Pd1/CeO2 single-atom catalyst for alkoxycarbonylation of aryl iodides. Sci. China Mater. 2020, 63, 959-964. doi: 10.1007/s40843-019-1204-y
Wang, Q.; Zhao, Z. L.; Dong, S.; He, D.; Lawrence, M. J.; Han, S.; Cai, C.; Xiang, S.; Rodriguez, P.; Xiang, B.; Wang, Z.; Liang, Y.; Gu, M. Design of active nickel single-atom decorated MoS2 as a pH-universal catalyst for hydrogen evolution reaction. Nano Energy 2018, 53, 458-467. doi: 10.1016/j.nanoen.2018.09.003
Shi, J. Single-atom Co-doped MoS2 monolayers for highly active biomass hydrodeoxygenation. Chem 2017, 2, 468-469. doi: 10.1016/j.chempr.2017.03.005
Zhou, P.; Lv, F.; Li, N.; Zhang, Y.; Mu, Z.; Tang, Y.; Lai, J.; Chao, Y.; Luo, M.; Lin, F.; Zhou, J.; Su, D.; Guo, S. Strengthening reactive metal-support interaction to stabilize high-density Pt single atoms on electron-deficient g-C3N4 for boosting photocatalytic H2 production. Nano Energy 2019, 56, 127-137. doi: 10.1016/j.nanoen.2018.11.033
Ou, M.; Wan, S.; Zhong, Q.; Zhang, S.; Wang, Y. Single Pt atoms deposition on g-C3N4 nanosheets for photocatalytic H2 evolution or NO oxidation under visible light. Int. J. Hydrogen Energy 2017, 42, 27043-27054. doi: 10.1016/j.ijhydene.2017.09.047
Sun, S.; Zhang, G.; Gauquelin, N.; Chen, N.; Zhou, J.; Yang, S.; Chen, W.; Meng, X.; Geng, D.; Banis, M. N.; Li, R.; Ye, S.; Knights, S.; Botton, G. A.; Sham, T. -K.; Sun, X. Single-atom catalysis using Pt/graphene achieved through atomic layer deposition. Sci. Rep. 2013, 3, 1775. doi: 10.1038/srep01775
Yang, B.; Fu, Z. Comparative study of C3N- and graphene-supported single-atom Pt. J. Phys. Chem. C 2019, 123, 5731-5735. doi: 10.1021/acs.jpcc.8b12142
Yamazaki, K.; Maehara, Y.; Lee, C. -C.; Yoshinobu, J.; Ozaki, T.; Gohara, K. Atomic structure and local electronic states of single Pt atoms dispersed on graphene. J. Phys. Chem. C 2018, 122, 27292-27300. doi: 10.1021/acs.jpcc.8b04529
Yu, H.; Tian, J.; Chen, F.; Wang, P.; Wang, X. Synergistic effect of dual electron-cocatalysts for enhanced photocatalytic activity: rGO as electron-transfer mediator and Fe(III) as oxygen-reduction active site. Sci. Rep. 2015, 5, 13083. doi: 10.1038/srep13083
Liu, Y.; Xu, X.; Zheng, S.; Lv, S.; Li, H.; Si, Z.; Wu, X.; Ran, R.; Weng, D.; Kang, F. Ni single atoms anchored on nitrogen-doped graphene as H2-evolution cocatalyst of SrTiO3(Al)/CoOx for photocatalytic overall water splitting. Carbon 2021, 183, 763-773. doi: 10.1016/j.carbon.2021.07.064
Sun, J.; Li, S.; Zhao, Q.; Huang, C.; Wu, Q.; Chen, W.; Xu, Q.; Yao, W. Atomically confined calcium in nitrogen-doped graphene as an efficient heterogeneous catalyst for hydrogen evolution. iScience 2021, 24, 102728. doi: 10.1016/j.isci.2021.102728
Bie, C.; Yu, H.; Cheng, B.; Ho, W.; Fan, J.; Yu, J. Design, fabrication, and mechanism of nitrogen-doped graphene-based photocatalyst. Adv. Mater. 2021, 33, 2003521. doi: 10.1002/adma.202003521
Gao, Y.; Hou, F.; Hu, S.; Wu, B.; Wang, Y.; Zhang, H.; Jiang, B.; Fu, H. Graphene quantum-dot-modified hexagonal tubular carbon nitride for visible-light photocatalytic hydrogen evolution. ChemCatChem 2018, 10, 1330-1335. doi: 10.1002/cctc.201701823
Jeon, S. -J.; Kang, T. -W.; Ju, J. -M.; Kim, M. -J.; Park, J. H.; Raza, F.; Han, J.; Lee, H. -R.; Kim, J. -H. Modulating the photocatalytic activity of graphene quantum dots via atomic tailoring for highly enhanced photocatalysis under visible light. Adv. Funct. Mater. 2016, 26, 8211-8219. doi: 10.1002/adfm.201603803
Zhu, S.; Zhang, J.; Liu, X.; Li, B.; Wang, X.; Tang, S.; Meng, Q.; Li, Y.; Shi, C.; Hu, R.; Yang, B. Graphene quantum dots with controllable surface oxidation, tunable fluorescence and up-conversion emission. RSC Adv. 2012, 2, 2717-2720. doi: 10.1039/c2ra20182h
Guo, C. X.; Dong, Y.; Yang, H. B.; Li, C. M. Graphene quantum dots as a green sensitizer to functionalize ZnO nanowire arrays on F-doped SnO2 glass for enhanced photoelectrochemical water splitting. Adv. Energy Mater. 2013, 3, 997-1003. doi: 10.1002/aenm.201300171
Dong, Y.; Shao, J.; Chen, C.; Li, H.; Wang, R.; Chi, Y.; Lin, X.; Chen, G. Blue luminescent graphene quantum dots and graphene oxide prepared by tuning the carbonization degree of citric acid. Carbon 2012, 50, 4738-4743. doi: 10.1016/j.carbon.2012.06.002
Wang, L.; Tang, R.; Kheradmand, A.; Jiang, Y.; Wang, H.; Yang, W.; Chen, Z.; Zhong, X.; Ringer, S. P.; Liao, X.; Liang, W.; Huang, J. Enhanced solar-driven benzaldehyde oxidation with simultaneous hydrogen production on Pt single-atom catalyst. Appl. Catal. B-Environ. 2021, 284, 119759. doi: 10.1016/j.apcatb.2020.119759
Kuang, P.; Wang, Y.; Zhu, B.; Xia, F.; Tung, C. -W.; Wu, J.; Chen, H. M.; Yu, J. Pt single atoms supported on N-doped mesoporous hollow carbon spheres with enhanced electrocatalytic H2-evolution activity. Adv. Mater. 2021, 33, 2008599. doi: 10.1002/adma.202008599
Zhao, W.; Luo, C.; Lin, Y.; Wang, G. -B.; Chen, H. M.; Kuang, P.; Yu, J. Pt-Ru dimer electrocatalyst with electron redistribution for hydrogen evolution reaction. ACS Catal. 2022, 12, 5540-5548. doi: 10.1021/acscatal.2c00851
Gong, H.; Li, Y.; Li, H.; Jin, Z. 2D CeO2 and a partially phosphated 2D Ni-based metal-organic framework formed an S-scheme heterojunction for efficient photocatalytic hydrogen evolution. Langmuir 2022, 38, 2117-2131. doi: 10.1021/acs.langmuir.1c03198
Wu, Y.; Li, Y.; Zhang, L.; Jin, Z. NiAl-LDH in-situ derived Ni2P and ZnCdS nanoparticles ingeniously constructed S-scheme heterojunction for photocatalytic hydrogen evolution. ChemCatChem 2022, 14, 202101656.
Zhao, Y.; Fang, Z. -B.; Feng, W.; Wang, K.; Huang, X.; Liu, P. Hydrogen production from pure water via piezoelectric-assisted visible-light photocatalysis of CdS nanorod arrays. ChemCatChem 2018, 10, 3397-3401. doi: 10.1002/cctc.201800666
Yang, Y.; Tan, H.; Cheng, B.; Fan, J.; Yu, J.; Ho, W. Near-infrared-responsive photocatalysts. Small Methods 2021, 5, 2001042. doi: 10.1002/smtd.202001042
Sayed, M.; Zhu, B.; Kuang, P.; Liu, X.; Cheng, B.; Al-Ghamdi, A. A.; Wageh, S.; Zhang, L.; Yu, J. EPR investigation on electron transfer of 2D/3D g-C3N4/ZnO S-scheme heterojunction for enhanced CO2 photoreduction. Adv. Sustain. Syst. 2021, 6, 2100264.
Li, Y.; Li, Y.; Jin, Z.; Tsubaki, N. Etching C6CoK3N6-induced ZnCdS for improved hydrogen evolution. Sustain. Energ. Fuels 2021, 6, 408-419.
Yan, X.; Jin, Z.; Zhang, Y.; Liu, H.; Ma, X. Controllable design of double metal oxide (NiCo2O4)-modified CdS for efficient photocatalytic hydrogen production. Phys. Chem. Chem. Phys. 2019, 21, 4501-4512. doi: 10.1039/C8CP07275B
Sun, L.; Li, L.; Yang, J.; Fan, J.; Xu, Q. Fabricating covalent organic framework/CdS S-scheme heterojunctions for improved solar hydrogen generation. Chin. J. Catal. 2022, 43, 350-358. doi: 10.1016/S1872-2067(21)63869-X
Lei, Z.; Ma, X.; Hu, X.; Fan, J.; Liu, E. Enhancement of photocatalytic H2-evolution kinetics through the dual cocatalyst activity of Ni2P-NiS-decorated g-C3N4 heterojunctions. Acta Phys. Chim. Sin. 2022, 38, 2110049.
Gao, R.; Cheng, B.; Fan, J.; Yu, J.; Ho, W. ZnxCd1–xS quantum dot with enhanced photocatalytic H2-production performance. Chin. J. Catal. 2021, 42, 15-24. doi: 10.1016/S1872-2067(20)63614-2
Wageh, S.; Al-Ghamdi, A. A.; Al-Hartomy, O. A.; Alotaibi, M. F.; Wang, L. CdS/polymer S-scheme H2-production photocatalyst and its in-situ irradiated electron transfer mechanism. Chin. J. Catal. 2022, 43, 586-588. doi: 10.1016/S1872-2067(21)63925-6
He, B.; Bie, C.; Fei, X.; Cheng, B.; Yu, J.; Ho, W.; Al-Ghamdi, A. A.; Wageh, S. Enhancement in the photocatalytic H2 production activity of CdS NRs by Ag2S and NiS dual cocatalysts. Appl. Catal. B-Environ. 2021, 288, 119994. doi: 10.1016/j.apcatb.2021.119994

Figure 1 (a) XRD patterns of the CdS, CdS/GQDs, CdS/PtSAs and CdS/GQDs/PtSAs samples; (b) FTIR spectra of GQDs and CdS/GQDs.

Figure 2 (a) Synthesis of CdS/GQDs/PtSAs nanocomposites; (b) FESEM image of CdS nanosheets with flower-like spherical structure; (c) TEM image and (d) HRTEM image, (e-f) HAADF-STEM images, and (g) EDS elemental mapping of CdS/GQDs/PtSAs.

Figure 3 (a) XANES spectra of the CdS/GQDs/PtSAs, Pt foil, and PtO2 at Pt L3-edge. (b) k3-weight EXAFS spectra of the CdS/GQDs/PtSAs, Pt foil, and PtO2.

Figure 4 (a) and (b) AFM images of CdS; (c) N2 adsorption-desorption isotherms and corresponding pore size distribution curves (inset) of CdS, CdS/GQDs, CdS/PtSAs and CdS/GQDs/PtSAs samples; (d) UV/Vis diffuse reflectance spectra of samples.

Figure 5 (a) Comparison of the H2 generation rate of samples CdS and CdS/GQDs (CGx, x stands for the mass percentage of GQDs); (b) The H2 evolution rate of composite samples; (c) 12 h recycle photocatalytic H2 production performance of CdS/GQDs/PtSAs.

Figure 6 (a) XPS survey spectra, high-resolution X-ray photoelectron spectra of (b) Cd 3d regions, (c) S 2p regions, and (d) Pt 4f regions in the CdS, CdS/GQDs, CdS/PtSAs and CdS/GQDs/PtSAs samples.

Figure 7 (a) PL spectra of the CdS, CdS/GQDs, CdS/PtSAs and CdS/GQDs/PtSAs samples; (b) Time-resolved transient PL spectra; (c) Transient photocurrent response; (d) Electrochemical impedance spectra.

Figure 8 (a) CPDs of Pt, GQDs, CdS, CdS/GQDs and CdS/GQDs/PtSAs samples and (b) work functions of the above samples.

Figure 9 Energy level diagram and schematic of photogenerated carriers transfer pathway in CdS/GQDs/PtSAs composites.
Table 1. Pore Characteristics for CdS, CdS/GQDs, CdS/PtSAs and CdS/GQDs/PtSAs Samples
| Sample | SBET (m2/g) | Vp (cm3/g) | dp (nm) |
| CdS | 85 | 0.28 | 13.4 |
| CdS/GQDs | 83 | 0.21 | 11.6 |
| CdS/PtSAs | 79 | 0.20 | 10.1 |
| CdS/GQDs/PtSAs | 72 | 0.19 | 9.8 |
 下载: 导出CSV
Table 2. Double Exponential Fitting Results of the Average Lifetimes
| Sample | τ1 (ns) |
A1 (%) |
τ2 (ns) |
A2 (%) |
Average lifetime (ns) |
| CdS | 2.50 | 79.80 | 15.66 | 20.18 | 10.57 |
| CdS/GQDs | 2.38 | 82.40 | 14.41 | 17.60 | 9.16 |
| CdS/PtSAs | 2.13 | 92.26 | 12.59 | 7.74 | 5.59 |
| CdS/GQDs/PtSAs | 1.85 | 93.40 | 9.40 | 6.60 | 3.85 |
下载: 导出CSV

 扫一扫看文章

扫一扫关注我们