
Figure 1.
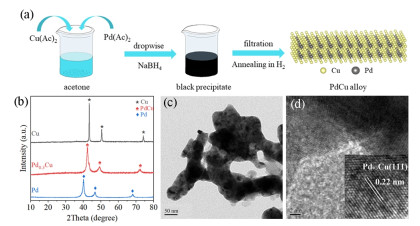
(a) Diagram of the synthesis of PdCu alloys. (b) XRD patterns of Cu nanoparticles, Pd0.3Cu and Pd nanoparticles. (c) TEM and (d) HR-STEM images of Pd0.3Cu.


Biomass conversion is becoming an effective way to alleviate the energy crisis and pollution in social development.[1] Biomass (lignin, sugar monomer, bio-oil, etc.) is the only renewable carbon source that can extract liquid fuels, chemicals, and polymeric materials in nature.[2, 3] 5-hydroxymethylfurfural (HMF), which can be produced by dehydration of either glucose or fructose, is one of the most critical intermediates of biomass conversion. 2, 5-dihydroxymethylfuran (DHMF) and 2, 5-dimethylfuran (DMF), as ideal fuel or polymer premises, can be generated from the selective hydrogenation of HMF.[4-6] The thermal hydrogenation process is usually required under high temperature, high pressure, and additional H2.[7] Meanwhile, electrochemical conversion has irreplaceable advantages: a) the replacement of petrochemical-derived molecular H2 by protons generated via water splitting, and b) the reaction rate and product selectivity can be easily controlled by tuning the potential. However, the electrochemical hydrogenation process of HMF still stuffs from high initial potential and low catalytic efficiency.[8-11]
Cu is a classical and widely used catalyst for the reaction of electrocatalytic reduction of organic compounds. For example, Koper et al. investigate the performance of electrocatalytic HMF hydrogenation (HMF ECH) on the Cu electrode in neutral and acidic electrolytes.[12, 13] Li et al. took a systematic study and proved that the electrocatalytic furfural hydrogenation on Cu electrodes has two different pathways: 1) electrocatalytic hydrogenation and (2) direct electroreduction. Since the reaction pathway of HMF ECH is complicated, the product selectivity is usually low. In order to solve this problem, bimetallic alloys were prepared to enhance product selectivity.[14] Anne et al. synthesized a CuAg alloy by electrochemically depositing Ag on the surface of nanoporous Cu precursor, which can realize the high selectivity of 92% for DHMF.[15] Furthermore, Fan et al. successfully realize the reaction of electro-catalytic reduction of HMF to synthesize DMF with the selectivity of 91.1% using CuNi alloy.[16] Compared with a single metal, the selectivity of Cu-based electrocatalyst was increased by introducing the second metal.[17] However, the conversion potential of HMF on these alloys is relatively high, and the role of different components in bimetallic alloys is not clear.[18]
Herein, we prepared a Pd0.3Cu electrocatalyst with high activity and revealed the reason for the enhanced performance. The bimetallic PdCu catalysts show superb HMF hydrogenation activities with an HMF conversion of 89%, high DHMF selectivity of 99%, and excellent stability by introducing the Pd element. The role of Pd in the ECH of HMF was studied by the electrochemical measurements and XPS. The improved adsorption capacity of HMF and H on the PdCu alloy was attributed to the enhanced electrocatalytic performance.
The PdCu alloys were prepared by NaBH4 reduction (Figure 1a).[19] Figure 1(b) shows the XRD patterns of Cu nanoparticles, Pd0.3Cu, and Pd nanoparticles. The XRD patterns of Cu and Pd nanoparticles fit well with the standard Cu (PDF#04-0836) and Pd (PDF#46-1643) crystal structure. XRD pattern of PdCu alloy displayed a single set of diffraction peaks assignable to a body-centered cubic structure.[20] Each was located between corresponding peaks of pure Pd and Cu, evidencing the formation of PdCu alloy rather than phase separation.[21] The reason for the different diffraction peak positions is that the diameter of the Pd atom is different from that of the Cu atom. After Pd is mixed into Cu, the spacing between crystal planes will increase. According to the Bragg formula (2dsinθ = 2λ), the diffraction peak position of the alloy will be smaller than that of Cu crystal.[22]
The TEM image shows that Pd0.3Cu consists of interconnected crystalline features with a particle size of about 50 nm (Figure 1c). The high-resolution TEM (HRTEM) image shows that the (111) plane of Pd0.3Cu was mainly exposed to the nanoarrays, contributing to the high surface area and reaction activity (Figure 1d). Furthermore, according to the TEM-EDS pattern and EDS elemental mapping, there are only Pd and Cu in the catalyst, and they are evenly distributed throughout the nanoparticles (Figure S1a-d). In addition, the ICP-AES result shows that the atomic ratio of Pd to Cu is 0.3:1.
In order to verify the influence of alloy composition on the surface electronic structure and electrocatalytic performance, a series of alloys with different Pd content were synthesized, and their crystal structures and microstructures were studied. The XRD patterns of PdxCu are shown in Figure S2. When the ratio of Pd to Cu is less than 0.5, the diffraction peaks are similar to pure Pd and Cu. As the atomic ratio of palladium to copper increases to 0.5 and 0.6, the XRD patterns showing some subtle changes are matched well with the ordered B2 structure (ICDD: 01-078-4406) in which alternatively arranged Cu and Pd atoms reside on neighboring sites in a bcc-based lattice.[23, 24] Bimetallic nanocrystals synthesized by solution method at room temperature usually have random alloy structures. Thermal annealing of the alloy structure, usually in a reducing or inert atmosphere, at a disordered transition temperature, can cause the two metal atoms to diffuse and arrange evenly to form intermetallic compounds, ordered alloys.[25] It indicates theordered structure formationfor the Cu and Pd atoms. The SEM images of synthetic materials are all displayed in Figure S3 and S4. Cu nanoparticles consist of spheres with a particle size of about 20 nm, while Pd nanoparticles are composed of smaller spheres with a particle size of about 5 nm. Owing to the formation of Pd-Cu alloy, PdxCu alloys consist of nanoparticles with a particle size of 20-50 nm. With the change of palladium content, the size of bimetallic nanocrystals does not change much, and they are all composed of about 50 nm nanoparticles.
The specific surface elements and their valence states of bimetallic PdxCu alloys, Cu nanoparticles, and Pd nanoparticles were further characterized by X-ray photoelectron spectroscopy (XPS) (Figure 2). All peaks were corrected to C 1s (284.8 eV). The Cu 2p3/2 XPS spectra of Cu nanoparticles (Figure 2a) can be divided into two peaks at 932.38 and 934.69 eV, respectively, assigned to Cu0 and Cu2+. The Cu2+ may be caused by the oxidation of Cu nanoparticles in air atmosphere. The peaks at ∼942.0 eV are satellite peaks of Cu2+, and the Cu0 peak is the dominant peak among them. In addition, compared with mono-metal catalysts, the binding energies of Cu 2p3/2 show a negative shift for PdCu alloys, which may be due to the charge transfer between Pd and Cu during alloying.[26] Meanwhile, as shown in Figure 2(b), the Pd 3d XPS spectrum of Pd nanoparticles and bimetallic Cu-Pd alloys demonstrated the peak of 335.3-340.7 eV (Pd 3d5/2) could be assigned to Pd0 and Pd2+ in the corresponding catalyst. Similarly, compared with Pd nanoparticles, the binding energies of Pd 3d5/2 also show a negative shift.[27]
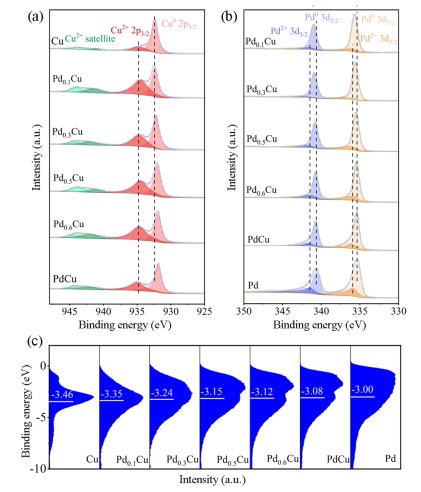
The relationship between XPS binding energy of Pd and Cu and Pd content in the alloy is shown in Figure S6. This shift of binding energy further indicates that the PdCu alloy nanoparticles were successfully formed due to the incorporation of Pd atoms into the Cu lattice, which is consistent with the results of XRD and TEM. Owing to the minor electron negativity of Cu than that of Pd, the transfer of Cu electrons to Pd leads to a positive charge of Cu, which is more conducive to the adsorption of oxygen atoms of HMF molecules on the catalyst surface.[28, 29] In addition, due to the excellent hydrogen adsorption capacity of Pd, the synthesized PdCu alloy has a high HMF hydrogenation performance.
Furthermore, the surface valence bands of those samples were calculated by the XPS data (Figure 2c). It verified the electronic interaction between the Pd and Cu since the centers of gravity gradually shifted with the growing amounts of Pd in Cu, indicating the enhanced adsorption capability of H and organic molecule for PdxCu. Therefore, the PdxCu with different compositions behaves with tunable surface properties.[30-32] The change of the d-band center further indicates that the formation of alloy can adjust the electronic structure of the catalyst surface. Previous work shows that the adsorption energy is closely related to the electronic structure of surface atoms of electrocatalysts.[33, 34] Therefore, adjusting the adsorption energy by adjusting the surface electronic structure is a practical method to improve the catalytic activity of electrocatalysts. According to Sabatier's principle, the adsorption of reactive species cannot be too strong or too weak to limit the product desorption or reactant activation, respectively. Therefore, only appropriate Pd content can maximize the catalytic activity.
The HMF ECH performance of Cu nanoparticles, Pd0.3Cu, and Pd nanoparticles was measured in PBS electrolyte. As shown in Figure 3(a), in the absence of HMF, the applied potential of HMF hydrogenation to reach the current density of 10 mA cm-2 on Pd0.3Cu is -0.47 VRHE. However, with the existence of HMF, the applied potential reduces to -0.31 VRHE to achieve the same current density, indicating that the hydrogenation of HMF on the Pd0.3Cu electrode is much easier than HER. In addition, by comparing with Cu nanoparticles (-0.3 VRHE) and Pd nanoparticles (-0.32 VRHE), Pd0.3Cu shows more positive onset potential for HMF hydrogenation and higher current response, indicating that the formation of alloys significantly improves the HMF ECH performance of Cu-based electrocatalyst. The corresponding Tafel slopes which were calculated to evaluate HMF hydrogenation kinetics are shown in Figure S7. The Tafel slope of Pd0.3Cu is 208 mV dec-1, which is smaller than that of Pd (229 mV dec-1) and Cu (226 mV dec-1), showing a faster electron-transfer rate.
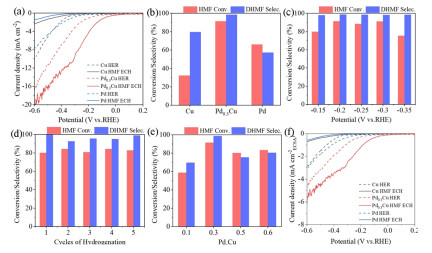
The HMF electro-hydrogenation over Pd0.3Cu was subjected to potentiostatic electrolysis in a divided cell with PBS containing HMF at different electrode potentials to identify and quantify the hydrogenation products. The potential used in this work is chosen based on the results of LSVs. After reduction, the products in electrolyte were analyzed and quantified by HPLC. As shown in Figure 3(b), the selectivity (%) of DHMF is 99% at four applied potentials, suggesting that DHMF is the primary product for electrocatalytic HMF hydrogenation on Pd0.3Cu. Other reduction products may be 2, 5-dimethylfuran, 2, 5-dihydroxymethyltetra-hydrofuran, 5-methylfurfural, 5-methylfurfuryl alcohol, etc. However, only DHMF selectivity is discussed because it has small content and is not the focus of this paper. Under the same conditions, the electrocatalytic HMF reduction performance of Pd and Cu is much lower than that of Pd0.3Cu. In addition, the electrolysis of Pd0.3Cu under different potentials was studied. As shown in Figure 3(c), the selectivity of DHMF is 99% at five applied potentials, which means DHMF is the primary product for the electrocatalytic HMF hydrogenation Pd0.3Cu. It is worth noting that the conversions of HMF at -0.2, -0.25, and -0.3 VRHE approximately approach to 89%, which decreases to 75% at -0.35 VRHE. The results of HPLC for HMF hydrogenation catalyzed by Pd0.3Cu at -0.20 VRHE are shown in Figure S18. The causes of performance degradation may be that the reaction rate of HER gradually increases as the applied potentials become negative, which may occupy more active sites on the surface of Pd0.3Cu. Meanwhile, to study the catalytic stability of the Pd0.3Cu electrode, the same Pd0.3Cu electrode was reused in the electro-catalytic hydrogenation of HMF for five continuous potentiostatic electrolysis cycles (Figure 3e). The conversion of HMF remains 81%, and the selectivity (%) of DHMF keeps 99%, suggesting excellent stability for Pd0.3Cu in electrocatalytic HMF hydrogenation. TEM characterization was performed on Pd0.3Cu after reaction in PBS solution, as shown in Figure S11. It can be found that the morphology and element distribution of the catalyst hardly change before and after the reaction, which shows that the alloy material has good stability.
To investigate the performance of electrocatalytic hydrogenation of HMF with different Pd contents, a series of comparative experiments were carried out by varying the Pd content (as shown in Figure S8). According to the data, the following conclusions can be drawn: 1) for all the catalysts used, the performance of electrocatalytic hydrogenation of HMF is superior to that of HER; 2) among the synthetic alloys with different Pd content, the onset potential of electrocatalytic hydrogenation of HMF on Pd0.3Cu is more positive than that on Pd0.1Cu, Pd0.5Cu, and Pd0.6Cu. Similarly, the potentiostatic electrolysis experiment of PdxCu was also carried out at -0.25 VRHE, as shown in Figure 3(d). The conversion of HMF and the selectivity of DHMF on the Pd0.3Cu electrode are both higher than that on other electrodes, which further suggests that Pd0.3Cu is the most excellent and economical electrocatalyst for the electrocatalytic HMF hydrogenation. Interestingly, the conversion (%) of HMF and the selectivity (%) of DHMF first increase and then decrease with the gradual increase of Pd content. The results show that adding appropriate Pd can effectively improve the hydrogenation performance of HMF, while excessive Pd content will lead to excessive HER reaction, which is not conducive to the reduction of HMF.
Moreover, the active electrochemical areas (ECSA) of Cu nanoparticles, PdxCu, and Pd nanoparticles were measured to investigate the effect of Pd content on the intrinsic activity, as shown in Figure S9 and S10. Pd0.6Cu (6.18 mF cm-2) has the highest ECSA, while the ECSA of Cu and Pd nanoparticles are the lowest. With increasing the Pd content, the ECSA of alloys first increases and then decreases, suggesting that adding appropriate content of Pd can effectively improve the ECSA of catalysts and expose more active sites on the surface. In addition, the ECSA was used to normalize the corresponding LSV, as shown in Figure 3(f). The current density of Pd0.3Cu is higher than the value for Cu and Pd nanoparticles, suggesting the intrinsic activity of Pd0.3Cu is much higher than that of the bare Cu and Pd nanoparticles. By this token, Pd0.3Cu is the most excellent and economical electrocatalyst for electrocatalytic HMF hydrogenation.
The in situ electrochemical impedance spectroscopy (EIS) measurements are performed at various potentials to investigate further the catalytic kinetics of electrochemical hydrogenation of HMF on the as-obtained electrode and the electronic transfer between electrodes and the electrolyte. The Bode phase plots (in HMF) of Cu nanoparticles, Pd0.3Cu, and Pd nanoparticles are shown in Figure 4(a-c). The phase angle in the Bode phase diagram could imply the reaction rate. Compared with Cu, the phase angle of Pd0.3Cu and Pd decreased at the potential of 0.05 VRHE, which is much earlier than that of Cu (-0.25 VRHE), indicating the reaction rate on Pd-containing electrocatalyst is much easier than on Cu electrode. The possible reason is that the Pd atom attracts H more readily than Cu, which will induce the hydrogenation reaction in a small onset potential. Moreover, the phase angle of Pd0.3Cu is smaller than that of Pd, implying the alloy electrocatalyst has a faster reaction rate. The enhanced electrocatalytic performance would be contributed to the optimized surface electronic structure of the alloy.[35-37] It is worth noting that in the Bode phase diagram of Cu, a wave appears at the x-coordinate of -0.5, which should be the reduction of Cu2+. Moreover, the Nyquist plots of Cu nanoparticles, Pd0.3Cu and Cu nanoparticle catalysts were compared in PBS with HMF at -0.15 VRHE, as shown in Figure S13.
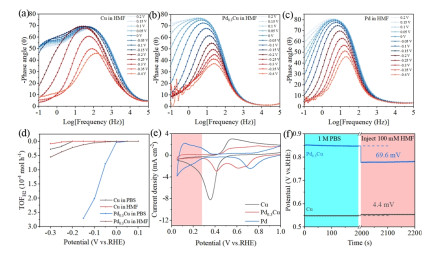
The Nyquist plot of Pd0.3Cu is a semicircle, while that of Cu nanoparticles is a straight line. Evidently, the onset potential of Pd0.3Cu is more positive than that of Cu nanoparticles and further indicates that the electrical conductivity of Pd0.3Cu is more excellent than that of Cu nanoparticles and Pd nanoparticles. Figure S14(d) shows the Nyquist plots of Pd0.3Cu catalyst at various applied potentials (from 0.2 to -0.4 VRHE) in PBS without HMF. At the potential of -0.1 VRHE, the Nyquist plots are close to the straight line. When the potential reaches -0.15 VRHE, a semicircle is observed, marking the beginning of HER. After adding HMF to the electrolyte (Figure S14e), the semicircle is observed at -0.1 VRHE, indicating that the onset potential of the electrocatalytic HMF hydrogenation is earlier than that of HER on Pd0.3Cu, which is consistent with the hydrogenation potential obtained from the LSV curve. In addition, the Nyquist plots and Bode phase plots of Cu nanoparticles in PBS with and without HMF are displayed in Figure S14a-b. A similar trend can be observed from Cu nanoparticles, except for the onset potential of HER and ECH. The Nyquist plots and Bode phase plots of Pd nanoparticles in PBS with and without HMF are displayed in Figure S15. The equivalent circuit and the parameters of the equivalent circuit are presented in Figure S12 and Table S1. According to Table S2, the R1 (Ω) of Pd0.3Cu is 151.6 Ω, which is far less than that of Cu nanoparticles (2092 Ω) and Pd nanoparticles (1469.8 Ω). Therefore, the electrical conductivity of Pd0.3Cu is more excellent than that of Cu nanoparticles.[38, 39]
Meanwhile, the rate of H2 production is measured to prove the effectiveness of the Pd atom. As shown in Figure S16, in the absence of HMF, H2 is produced at -0.1 VRHE. When HMF is added to the solution, the potential of hydrogen production correspondingly negatively shifts and the rate of hydrogen production decreases significantly. With the Pd ratio increasing to 0.3, the potential of hydrogen production is moved to 0 VRHE. The above phenomenon shows that the presence of Pd can enhance the adsorption capacity of hydrogen (Hads) on the catalyst surface. CV curves of Pd, Pd0.3Cu, and Cu were tested in PBS electrolyte, and the hydrogen region rose with Pd, indicating the ability of the electrocatalyst to adsorb hydrogen atoms increased. This result further indicated that incorporating Pd could promote the adsorption capacity of hydrogen atoms of the catalyst.[40] Moreover, the Hads significantly promoted the reaction of electrocatalytic reduction of HMF. The phenomenon of cyclic voltammetry in Figure S17 proves the Hads peak in the presence of HMF is weaker than that in the absence of HMF.[41] In addition, the open-circuit potential (OCP), which reflects the variation of absorbates in the Helmholtz layer, was recorded to evaluate the HMF adsorption behavior on the catalysts (Figure 4(f). When injecting HMF, a more significant decrease of OCP of the electrochemical cell with the Pd0.3Cu electrode (69.6 mV) was observed than that with the Cu electrode (-4.4 mV), suggesting stronger surface adsorption of HMF on Pd0.3Cu.[42]
In summary, a Pd0.3Cu alloy was successfully synthesized through a simple NaBH4 reduction method. The XRD, XPS, and TEM data show that the as-prepared catalyst has formed an alloy and the atoms of Pd and Cu are arranged evenly. Also, the LSV, EIS and ECSA data show the overpotential of the electrocatalytic HMF hydrogenation to achieve a current density of 10 mA cm-2 on the Pd0.3Cu electrode is only -0.31 V (vs. RHE). DHMF is the dominant product on the used catalysts. The conversion of HMF is 85%, while the selectivity of DHMF approximately approaches to 99%. The bimetallic Pd0.3Cu electrode shows excellent electrocatalytic activity and stability during the electrochemical hydrogenation of HMF. Moreover, the reason for its excellent properties is that the presence of Pd can enhance the adsorption capacity of hydrogen (Hads) and the surface adsorption of HMF on the catalyst surface.
Materials. 5-hydroxymethylfurfural (HMF, analytical grade), 2, 5-dihydroxymethylfuran (DHMF, analytical grade), 5-methylfurfural (5-MF, analytical grade), 5-methylfurfuryl alcohol (5-MF, analytical grade), 2, 5-dimethylfuran (DMF, analytical grade), palladium(Ⅱ) acetate (Pd(OAc)2, 99%), copper(Ⅱ) acetate (Cu(OAc)2, 99%) and 2-ethoxyethanol (99%) were purchased from Innochem. NaBH4(analytical grade), acetone (C2H6O, analytical grade) and acetonitrile (CH3CN, HPLC grade) were purchased from Sinopharm Chemical Reagent Co. Ltd. (Shanghai, China). All chemicals were used as received without further purification. Deionized water 18.2 MΩ cm was used to prepare all the solutions.
Synthesis of Pd0.3Cu. Pd0.3Cu was obtained by reducing the mixture of palladium(Ⅱ) acetate and copper(Ⅱ) acetate (with molar ratio of Cu(Ⅱ): Pd(Ⅱ) = 10:3) with NaBH4 and annealing in 0.1 MPa H2. In detail, 0.45 mmol Pd(OAc)2 and 1.5 mmol Cu(OAc)2 were added to 250 mL acetone and ethoxyethanol for stirring, respectively. After stirring for half an hour, the two solutions were mixed and stirred for another five minutes. 20 mL aqueous solution of NaBH4 (30 mmol) was added to the mixed solution, followed by stirring for five minutes at room temperature. The solution changed to brown black immediately, indicating the formation of alloy. The obtained brown black solution was filtered and washed with water for ten times and ethanol twice. And it was dried overnight under vacuum at 60 ℃.
After that, the powder obtained above was placed in a tube furnace, and heated at 573 K for 2 h with a heating speed of 5 ℃ min-1 in H2 atmosphere, thus obtaining Pd0.3Cu.
Synthesis of PdxCu (x = 0.1, 0.3, 0.5, 0.6, 1) Alloys. The PdxCu alloys with different molar ratios were synthesized following similar steps, except that the variant amount of Pd(OAc)2 was used.
Synthesis of Cu and Pd Nanoparticles. 3 mmol Cu(OAc)2 or 30 mL acetone solution of Pd(OAc)2 (3 mmol) was dissolved to 250 mL 2-ethoxyethanol for stirring 30 minutes. After that, 20 mL aqueous solution of NaBH4 (30 mmol) was added dropwise to the mixture and stirred for another 5 minutes. The resulting product was collected by filtration and washed with water for ten times and ethanol twice. Then, it was dried under vacuum overnight at 60 ℃.
Characterization. X-ray powder diffraction (XRD, Bruker D8 Advance diffractometer) was used to characterize the crystalline structures of the obtained materials. All samples were scanned from 10 degree to 80 degree (2theta angles) with a scan rate of 12 degree min-1. The morphology and microstructure were performed by transmission electron microscopy (TEM, Tecnai G2 F20) and scanning electron microscope (SEM, Hitachi, S-4800). The X-ray photoelectron spectroscopy (XPS) analysis was recorded on a Shimadzu AXIS SUPRA photoelectron spectrometer. The element contents of Pd and Cu were determined by inductively coupled plasma optical emission spectroscopy (ICP-OES, Agilent 7700).
Electrochemical Measurements. All the electrochemical measurements were performed with a CHI 760e electrochemical analyzer, expect for electrochemical impedance measurement. Electrochemical impedance measurement was tested on Autolab. Unless noted otherwise, all the tests were performed with a three-electrode system, in which a glass carbon electrode or a carbon paper (CP) was used as the working electrode (WE), a graphite rod as the counter electrode (CE) and a standard Hg/HgCl2 as the reference electrode (RE). The catalyst ink was prepared as follows: the as-prepared catalysts (5 mg) were dispersed in 500 µL isopropanol, 450 µL deionized water, 450 μL ethanol, and 50 μL Nafion solution (5 wt.%, Dupont) under sonication for 30 minutes to form a homogeneous ink. Then 10 μL of the catalyst ink was dropped onto the surface of the glass carbon electrode (diameter: 5 mm) (while 200 μL for the carbon paper (CP)). LSV was measured with the scan rate of 10 mV s-1 in a divided cell. Meanwhile, constant potential electrolysis test was measured in a divided cell, which was separated by Nafion 117 membrane. All the tests were tested in 1.0 M phosphate buffer (PBS) electrolyte solution. Except for the EIS, agitation was maintained throughout all electrochemical tests.
HPLC analysis. The products of HMF hydrogenation were analyzedy using HPLC (Shimadzu Prominence LC 2030C system, Japan) with a C18 column (4.6 mm×150 mm Shim pack GWS 5 μm) and an ultraviolet-visible detector. Specifically, 50 μL of electrolytes was sampled during the potentiostatic electrolysis and diluted to 2 mL with ultrapure water and analyzed by HPLC. The wavelength of the UV detector is set to 223 nm, mobile phase A is acetonitrile and phase B is ultrapure water, with the ratio of A: B to be 2:8. The flow rate is 0.9 mL min-1 and each separation lasts for 15 minutes.
Yang, M.; Yuan, Z.; Peng, R.; Wang, S.; Zou, Y. Recent progress on electrocatalytic valorization of biomass-derived organics. Energ. Environ. Mater. 2022, Doi: 10.1002/eem2.12295.
Dai, Y. M.; Niu, L. L.; Liu, H.; Zou, J. Q.; Yu, L. P.; Feng, Q. J. Cu-Ni alloy catalyzed electrochemical carboxylation of benzyl bromide with carbon dioxide in ionic liquid 1-butyl-3-methylimidazolium tetrafluoroborate. Int. J. Electrochem. Sci. 2018, 13, 1084-1095.
Feng, Q.; Lv, H.; Zhang, Y.; Dai, F.; Yan, W. New method for electrochemical activation of N-benzyl ideneaniline to dibutyl phthalate in the present of carbon dioxide. Int. J. Electrochem. Sci. 2016, 11, 692-699.
Demirbas, A. Biomass resource facilities and biomass conversion processing for fuels and chemicals. Energy Convers. Manage. 2001, 42, 1357-1378. doi: 10.1016/S0196-8904(00)00137-0
Kwon, Y.; Schouten, K. J. P.; van der Waal, J. C.; de Jong, E.; Koper, M. T. M. Electrocatalytic conversion of furanic compounds. ACS Catal. 2016, 6, 6704-6717. doi: 10.1021/acscatal.6b01861
Mamman, A. S.; Lee, J. M.; Kim, Y. C.; Hwang, I. T.; Park, N. J.; Hwang, Y. K.; Chang, J. S.; Hwang, J. S. Furfural: hemicellulose/xylose-derived biochemical. Biofuel Bioprod. Bior. 2008, 2, 438-454. doi: 10.1002/bbb.95
Roman-Leshkov, Y.; Barrett, C. J.; Liu, Z. Y.; Dumesic, J. A. Production of dimethylfuran for liquid fuels from biomass-derived carbohydrates. Nature 2007, 447, 982-985. doi: 10.1038/nature05923
Li, S.; Sun, X.; Yao, Z.; Zhong, X.; Coo, Y.; Liang, Y.; Wei, Z.; Deng, S.; Zhuang, G.; Li, X.; Wang, J. Biomass valorization via paired electrosynthesis over vanadium nitride-based electrocatalysts. Adv. Funct. Mater. 2019, 29, 1904780. doi: 10.1002/adfm.201904780
de Luna, G. S.; Ho, P. H.; Lolli, A.; Ospitali, F.; Albonetti, S.; Fornasari, G.; Benito, P. Ag electrodeposited on Cu open-cell foams for the selective electroreduction of 5-hydroxymethylfurfural. Chemelectrochem 2020, 7, 1238-1247. doi: 10.1002/celc.201902161
Nilges, P.; dos Santos, T. R.; Harnisch, F.; Schroeder, U. Electrochemistry for biofuel generation: electrochemical conversion of levulinic acid to octane. Energy & Environ. Sci. 2012, 5, 5231-5235.
Govind Rajan, A.; Carter, E. A. Discovering competing electrocatalytic mechanisms and their overpotentials: automated enumeration of oxygen evolution pathways. J. Phys. Chem. C 2020, 124, 24883-24898. doi: 10.1021/acs.jpcc.0c08120
Kwon, Y.; Birdja, Y. Y.; Raoufmoghaddam, S.; Koper, M. T. M. Electrocatalytic hydrogenation of 5-hydroxymethylfurfural in acidic solution. ChemSusChem 2015, 8, 1745-1751. doi: 10.1002/cssc.201500176
Kwon, Y.; de Jong, E.; Raoufmoghaddam, S.; Koper, M. T. M. Electrocatalytic hydrogenation of 5-hydroxymethylfurfural in the absence and presence of glucose. ChemSusChem 2013, 6, 1659-1667. doi: 10.1002/cssc.201300443
Chadderdon, X. H.; Chadderdon, D. J.; Matthiesen, J. E.; Qiu, Y.; Carraher, J. M.; Tessonnier, J. P.; Li, W. Mechanisms of furfural reduction on metal electrodes: distinguishing pathways for selective hydrogenation of bioderived oxygenates. J. Am. Chem. Soc. 2017, 139, 14120-14128. doi: 10.1021/jacs.7b06331
Zhang, L.; Zhang, F.; Michel, F. C. Jr.; Co, A. C. Efficient electrochemical hydrogenation of 5-hydroxymethylfurfural to 2, 5-bis(hydroxymethyl)-furan on Ag-displaced nanotextured Cu catalysts. Chemelectrochem 2019, 6, 4739-4749. doi: 10.1002/celc.201900640
Zhang, Y. R.; Wang, B. X.; Qin, L.; Li, Q.; Fan, Y. M. A non-noble bimetallic alloy in the highly selective electrochemical synthesis of the biofuel 2, 5-dimethylfuran from 5-hydroxymethylfurfural. Green Chem. 2019, 21, 1108-1113. doi: 10.1039/C8GC03689F
Alonso, D. M.; Wettstein, S. G.; Dumesic, J. A. Bimetallic catalysts for upgrading of biomass to fuels and chemicals. Chem. Soc. Rev. 2012, 41, 8075-8098. doi: 10.1039/c2cs35188a
Roylance, J. J.; Kim, T. W.; Choi, K. S. Efficient and selective electrochemical and photoelectrochemical reduction of 5-hydroxymethylfurfural to 2, 5-bis(hydroxymethyl)furan using water as the hydrogen source. ACS Catal. 2016, 6, 1840-1847. doi: 10.1021/acscatal.5b02586
Ma, S.; Sadakiyo, M.; Heima, M.; Luo, R.; Haasch, R. T.; Gold, J. I.; Yamauchi, M.; Kenis, P. J. A. Electroreduction of carbon dioxide to hydrocarbons using bimetallic Cu-Pd catalysts with different mixing patterns. J. Am. Chem. Soc. 2017, 139, 47-50. doi: 10.1021/jacs.6b10740
Li, J.; Li, F.; Guo, S. X.; Zhang, J.; Ma, J. PdCu@Pd nanocube with Pt-like activity for hydrogen evolution reaction. ACS Appl. Mater. Interfaces 2017, 9, 8151-8160. doi: 10.1021/acsami.7b01241
Huang, W.; Kang, X.; Xu, C.; Zhou, J.; Deng, J.; Li, Y.; Cheng, S. 2D PdAg alloy nanodendrites for enhanced ethanol electroxidation. Adv. Mater. 2018, 30, 1706962. doi: 10.1002/adma.201706962
He, J.; Chen, D.; Li, N.; Xu, Q.; Li, H.; He, J.; Lu, J. Controlled fabrication of mesoporous ZSM-5 zeolite-supported PdCu alloy nanoparticles for complete oxidation of toluene. Appl. Catal. B 2020, 265, 118560. doi: 10.1016/j.apcatb.2019.118560
Shan, S.; Petkov, V.; Prasai, B.; Wu, J.; Joseph, P.; Skeete, Z.; Kim, E.; Mott, D.; Malis, O.; Luo, J.; Zhong, C. J. Catalytic activity of bimetallic catalysts highly sensitive to the atomic composition and phase structure at the nanoscale. Nanoscale 2015, 7, 18936-18948. doi: 10.1039/C5NR04535E
Wang, C.; Chen, D. P.; Sang, X.; Unocic, R. R.; Skrabalak, S. E. Size-dependent disorder-order transformation in the synthesis of monodisperse intermetallic PdCu nanocatalysts. ACS Nano 2016, 10, 6345-6353. doi: 10.1021/acsnano.6b02669
Yan, Y.; Du, J. S.; Gilroy, K. D.; Yang, D.; Xia, Y.; Zhang, H. Intermetallic nanocrystals: syntheses and catalytic applications. Adv. Mater. 2017, 29, DOI: 10.1002/adma.201605997.
Cheng, Y.; Xue, J.; Yang, M.; Li, H.; Guo, P. Bimetallic PdCu nanoparticles for electrocatalysis: multiphase or homogeneous alloy? Inorg. Chem. 2020, 59, 10611-10619. doi: 10.1021/acs.inorgchem.0c01056
He, C.; Ma, Z.; Wu, Q.; Cai, Y.; Huang, Y.; Liu, K.; Wu, X. Promoting the ORR catalysis of Pt-Fe intermetallic catalysts by increasing atomic utilization and electronic regulation. Electrochim. Acta 2020, 330, 135119. doi: 10.1016/j.electacta.2019.135119
Hammer, B.; Norskov, J. K. Theoretical surface science and catalysis-calculations and concepts. Adv. Catal. 2000, 45, 71-129.
Li, F.; Li, J.; Feng, Q.; Yan, J.; Tang, Y.; Wang, H. Significantly enhanced oxygen reduction activity of Cu/CuNxCy co-decorated ketjenblack catalyst for Al-air batteries. J. Energy Chem. 2018, 27, 419-425. doi: 10.1016/j.jechem.2017.12.002
Kim, D.; Resasco, J.; Yu, Y.; Asiri, A. M.; Yang, P. Synergistic geometric and electronic effects for electrochemical reduction of carbon dioxide using gold-copper bimetallic nanoparticles. Nat. Commun. 2014, 5, 4948. doi: 10.1038/ncomms5948
Li, J.; Liu, G.; Liu, B.; Min, Z.; Qian, D.; Jiang, J.; Li, J. Fe-doped CoSe2 nanoparticles encapsulated in N-doped bamboo-like carbon nanotubes as an efficient electrocatalyst for oxygen evolution reaction. Electrochim. Acta 2018, 265, 577-585. doi: 10.1016/j.electacta.2018.01.211
Ma, M.; Hansen, H. A.; Valenti, M.; Wang, Z.; Cao, A.; Dong, M.; Smith, W. A. Electrochemical reduction of CO2 on compositionally variant Au-Pt bimetallic thin films. Nano Energy 2017, 42, 51-57. doi: 10.1016/j.nanoen.2017.09.043
Ruban, A.; Hammer, B.; Stoltze, P.; Skriver, H. L.; Nørskov, J. K. Surface electronic structure and reactivity of transition and noble metals. J. Mol. Catal. A 1997, 115, 421-429. doi: 10.1016/S1381-1169(96)00348-2
Kitchin, J. R.; Nørskov, J. K.; Barteau, M. A.; Chen, J. G. Role of strain and ligand effects in the modification of the electronic and chemical properties of bimetallic surfaces. Phys. Rev. Lett. 2004, 93, 156801. doi: 10.1103/PhysRevLett.93.156801
Solanki, B. S.; Rode, C. V. Selective hydrogenation of 5-HMF to 2, 5-DMF over a magnetically recoverable non-noble metal catalyst. Green Chem. 2019, 21, 6390-6406. doi: 10.1039/C9GC03091C
Dutta, S.; De, S.; Patra, A. K.; Sasidharan, M.; Bhaumik, A.; Saha, B. Microwave assisted rapid conversion of carbohydrates into 5-hydroxymethylfurfural catalyzed by mesoporous TiO2 nanoparticles. Appl. Catal. A 2011, 409, 133-139.
Alam, M. I.; De, S.; Singh, B.; Saha, B.; Abu-Omar, M. M. Titanium hydrogenphosphate: an efficient dual acidic catalyst for 5-hydroxy-methylfurfural (HMF) production. Appl. Catal. A 2014, 486, 42-48. doi: 10.1016/j.apcata.2014.08.019
Lyons, M. E. G.; Brandon, M. P. The significance of electrochemical impedance spectra recorded during active oxygen evolution for oxide covered Ni, Co and Fe electrodes in alkaline solution. J. Electroanal. Chem. 2009, 631, 62-70. doi: 10.1016/j.jelechem.2009.03.019
Wang, H. Y.; Hung, S. F.; Chen, H. Y.; Chan, T. S.; Chen, H. M.; Liu, B. In operando identification of geometrical-site-dependent water oxidation activity of spinel Co3O4. J. Am. Chem. Soc. 2016, 138, 36-39. doi: 10.1021/jacs.5b10525
Zhao, T.; Wang, G.; Gong, M.; Xiao, D.; Chen, Y.; Shen, T.; Lu, Y.; Zhang, J.; Xin, H.; Li, Q.; Wang, D. Self-optimized ligand effect in L12-PtPdFe intermetallic for efficient and stable alkaline hydrogen oxidation reaction. ACS Catal. 2020, 10, 15207-15216. doi: 10.1021/acscatal.0c03938
Zhou, L.; Zhu, X.; Su, H.; Lin, H.; Lyu, Y.; Zhao, X.; Chen, C.; Zhang, N.; Xie, C.; Li, Y.; Lu, Y.; Zheng, J.; Johannessen, B.; Jiang, S. P.; Liu, Q.; Li, Y.; Zou, Y.; Wang, S. Identification of the hydrogen utilization pathway for the electrocatalytic hydrogenation of phenol. Sci China-Chem. 2021, 64, 1586-1595. doi: 10.1007/s11426-021-1100-y
Heidary, N.; Kornienko, N. Operando vibrational spectroscopy for electrochemical biomass valorization. Chem. Commun. 2020, 56, 8726-8734. DOI: 10.14102/j.cnki.0254-5861.2022-0074

Figure 1 (a) Diagram of the synthesis of PdCu alloys. (b) XRD patterns of Cu nanoparticles, Pd0.3Cu and Pd nanoparticles. (c) TEM and (d) HR-STEM images of Pd0.3Cu.

Figure 2 (a) High-resolution Cu 2p and (b) Pd 3d XPS spectra of PdxCu. (c) Surface valence bands of PdxCu. All the spectra are background-corrected. The white bars indicate the center of gravity. For comparison, the upper limit of integration is fixed to -10.0 eV in binding energy.

Figure 3 (a) LSV curves and (b) the conversion of HMF and the selectivity of DHMF of Cu nanoparticles, Pd0.3Cu and Pd nanoparticles in PBS without/with HMF. The conversion of HMF and the selectivity of DHMF (c) at various potentials on Pd0.3Cu electrode. (d) Using Pd0.3Cu for five successive electrolysis cycles and (e) of PdxCu alloy with various Pd content. (f) LSV curves normalized by ECSA of Cu nanoparticles, Pd0.3Cu and Pd nanoparticles.

Figure 4 (a) Bode phase plots of (a) Cu, (b) Pd0.3Cu and (c) Pd at various applied potentials in PBS with HMF. (d) TOF of hydrogen production in PBS with and without HMF of Cu and Pd0.3Cu. (e) CV curves of Cu, Pd0.3Cu and Pd in PBS. (f) OCP curves of Cu nanoparticles and Pd0.3Cu in PBS and HMF was injected subsequently.

 扫一扫看文章


扫一扫关注我们
 DownLoad:
 下载:
下载: