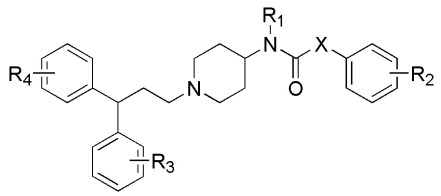
Figure 1.
Basic skeleton of 1-(3, 3-diphenylpropyl)-piperidinyl and urea derivatives

Acquired immunodeficiency syndrome (AIDS) is a fatal infectious disease caused by the human immunodeficiency virus (HIV) attacking the most important CD4+ T lymphocytes in the immune system, which seriously endangers people's lives, health and national public health security[1]. HIV is divided into HIV-1 and HIV-2 types[2]. HIV-1 is more toxic and contagious than HIV-2 and is the cause of most HIV infections in the world. So far, there is no drug that can eliminate the virus in the infected person. However, treatment programs for different stages of the virus life cycle have drastically reduced HIV infection from a fatal disease to a controllable disease. The HIV replication cycle can be divided into two stages: entry and post-entry[3]. The entry of HIV into target cells mainly includes three steps: (1) HIV trimeric envelope glycoprotein complex-mediated virus entry into susceptible target cells: surface subunit (gp120) attachment on the receptor (CD4); (2) gp120 interacts with the co-receptor, causing the gp120 envelope protein of the virus to bind to the chemokine receptor on the surface of the host cell; (3) transmembrane subunit (gp41) mediated membrane fusion. The post-entry step requires reverse transcriptase (RT), integrase (IN) and protease (PR) to complete the virus replication cycle. The current antiretroviral therapies (ARTs) for AIDS inhibit virus replication and make the AIDS a chronic infectious disease[4, 5], thereby prolonging the survival period of AIDS patients. However, this method cannot eradicate the virus from the body, and it may cause undesirable side effects and eventually infect the immune system[6].
Chemokine receptors are key regulators of cell migration in terms of immunity and inflammation. The main co-receptor of HIV involved in virus entry and cell-to-cell transmission during infection is CC chemokine receptor (CCR) 5 (CCR5), which has been identified as the best target for the design of new anti-HIV therapeutic drugs one[7]. Small molecule antagonism against CCR5 has become the focus of research by many pharmaceutical companies. Blocking the function of CCR5 can significantly reduce the activity of HIV with few side effects. Clinical trials provide evidence for this method to treat HIV infection[8]. Therefore, elucidating the mechanism by which HIV uses CCR5 to invade the target cell will help to develop new anti-HIV drugs more effectively. The drugs currently used to treat HIV are mainly divided into reverse transcriptase inhibitors, protease inhibitors, integrase inhibitors, fusion inhibitors and CCR5 antagonists[9]. But currently, the only CCR5 antagonist approved by FDA is Maraviroc, so CCR5 antagonists still have great potential. 1-(3, 3-diphenylpropyl)-piperidinyl and urea derivatives have been identified as a successful inhibitor of CCR5 and have attracted extensive attention from researchers.
The establishment of a quantitative structure-activity relationship (QSAR) model can guide the modification of compound structures, design new and more active compounds, and predict their activity. Commonly used QSAR models include 2D QSAR and 3D QSAR[10]. 3D-QSAR is a method that combines theoretical or semi-empirical calculation with mathematical statistics to model the correlation between the molecular structure descriptors of a compound and its physicochemical properties, thereby revealing the structural factors that affect the action of a compound. The techniques most commonly used in 3D QSAR are comparative molecular field analysis (CoMFA) and comparative molecular similarity index analysis (CoMSIA)[11]. However, CoMFA has many limitations, which can be limited if the molecular structure is not three-dimensional and does not stack reasonably with other molecules in the database. Topomer comparative molecular field analysis (Topomer CoMFA)[12] is the second-generation CoMFA method that overcomes many limitations of CoMFA, and can predict the bioactivity of compounds in just a few minutes, making it more repeatable. 2D QSAR is a method to quantitatively describe the relationship between the physicochemical properties and other measurable properties of a compound structure and its activity through a linear model or a nonlinear model[13]. Holographic quantitative structure-activity relationship (HQSAR) is a relatively new 2D QSAR method, which realizes the need of molecular arrangement and conformation specification by converting the chemical representation of the molecule into its corresponding molecular hologram[14]. In this study, Topomer CoMFA and HQSAR were used to model 75 1-(3, 3-diphenylpropyl)-piperidinyl and urea derivatives.
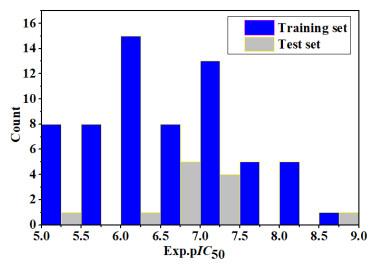
A total of 75 molecules and their biological activity (IC50) were gathered from the studies[15, 16] as the data set. SYBYL-X 2.0 software was used to draw their molecular structures, and finally they were stored in the format of Mol 2. The basic skeleton of 75 1-(3, 3-diphenylpropyl)-piperidinyl and urea derivatives is shown in Fig. 1, and the activity data are shown in Table S1. The formula〔pIC50=lg(1/IC50)〕was used to convert the IC50 values of 75 inhibitors into pIC50 values, so as to provide a larger value as the dependent variable of the model construction, and the pIC50 value range was obtained from 5.14 to 8.77. In order to obtain the best prediction results, the proper distribution of attributes and activity values in the test set is critical. The chemical composition of the test set must be quite similar to the chemical composition of some training sets. Fig. 2 shows the distribution of pIC50 values for all inhibitors, indicating that the diversity of activities in the data set is sufficient to construct a stable QSAR model. According to the pIC50 value and molecular structure characteristics, the entire data set was divided into two parts. 63 training sets were used to construct QSAR model, and 12 test sets (molecules marked with "*") to detect and evaluate the QSAR model constructed by the training set. The ratio of training set to test set was 5.25.
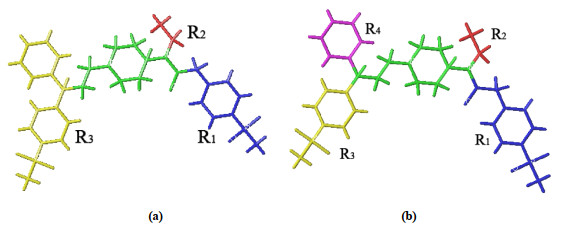
Topomer CoMFA can quickly and efficiently describe the changes of the electrostatic field around the molecule, and comprehensively reveal the molecular structure information that affects the biological activity, so as to determine the properties of groups that affect the molecular activity[17]. The quality of the model is closely related to the choice of cutting method, and the splitting mode of R group. The most active compounds and other compounds in the data set were arranged according to the common structure. We chose compound No. 67, which had the lowest energy and highest activity, as the cutting template to obtain the best model results through different cutting methods (Fig. 3). The template molecule was cut into 4 groups R1 (blue), R2 (red), R3 (yellow) and R4 (purple), and the green fragment was the common skeleton. After cutting, the program will automatically identify other molecules in the training set and cut in the same way. The remaining few molecules that cannot be automatically identified will be manually broken until all molecules are cut, and the resulting structural fragments will be used for subsequent model analysis and virtual screening research.
HQSAR is a fragment-based modeling method, which does not require the determination of 3D structure, molecular alignment and assumed conformation[18]. As a new QSAR technology with high predictive ability, it has irreplaceable advantages in molecular design. Each compound is divided into structural fragments defined by fragment discrimination (FD) parameters: atomic number (A) can distinguish atom types, bond type (B) can distinguish chemical bonds formed between atoms, and atomic connections (C) can distinguish the hybridization state of the atoms inside the fragment, hydrogen (H), chirality (Ch) can distinguish the chirality of the atom in the fragment and the stereochemical information of the chemical bond, and the donor/acceptor (DA) distinguishes the hydrogen bond donor or acceptor of the fragment. The cyclic redundancy check (CRC) algorithm is used to assign a specific positive integer to each segment. Each of these integers was in correspondence with a bin in an integer array of fixed hologram length (HL, ranging from 53 to 401). The bin occupancies of the molecular hologram are structural descriptors (independent variables)[19]. In HQSAR studies, there is a partial least-squares (PLS) relationship between these descriptors and attribute values. According to the same rules as Topomer CoMFA, we divided 75 compounds into the same 63 training sets and 12 test sets for HQSAR modeling, which is more conducive to comparing the two models.
In building the HQSAR model, we selected all 12 holographic lengths (HL: 53, 59, 61, 71, 83, 97, 151, 199, 257, 307, 353 and 401), and the default fragment size (FS: 4~7) and different combinations FD are used to generate the initial model. We analyzed 42 HQSAR models, studied the influence of different FD combinations on the model, and initially screened out better models. Then we selected different FS on the basis of the selected better models, and analyzed the influence of different FS on the HQSAR analysis results to obtain the optimal HQSAR model.
The PLS method[20] is an extension of multiple regression analysis and is used to analyze the relationship between quantitative descriptors and biological activity in the model. The established model descriptors (electrostatic field and stereo field parameters) were used as independent variables, and pIC50 was used as the dependent variable for PLS regression analysis[21]. Leave one out (LOO) cross-validation is one of the simplest methods for internal model verification. PLS method was used for model fitting, and the prediction ability of the internal verification of the model is evaluated by the LOO method interactively, and the optimal number of components (N) is determined. At the same time, the cross-validation correlation coefficient (q2), the standard error of estimation (SEE), the non-cross-validation correlation coefficient (r2) and the Fischer ratio value (F) are calculated to verify the stability of the constructed model. Among them, r2 and SEE are automatically generated by the system. The larger the r2 and F values, the smaller the SEE value, which proves that the model's fitting ability is stronger, q2 < 0 (the model predictive ability is poor), 0.4~0.5 (the model can be considered), ˃ 0.5 (a statistically significant prediction model); high q2 and r2 (q2 > 0.5, r2 > 0.6) value can prove that the established 3D QSAR model and HQSAR model have high predictive ability[22]. The q2, r2, SEE and F are calculated for the data set as equations (1)~(4):
|
|
(1) |
|
|
(2) |
|
|
(3) |
|
|
(4) |
Where Yexp is the experimental value of biological activity; Ycal is the simulated fitting value of biological activity; n is the number of samples; k is the number of parameters used in modeling; Ypred is the predicted activity of the test set compounds; Ymean is the calculated average activity of the training set compounds.
Studies have shown that there is no correlation between internal prediction ability (q2) and external prediction ability (rpred2). The q2 obtained by the LOO method cannot be used to evaluate the external predictive ability of the model[23]. Good internal verification results only prove that the q2 value of the compounds training set is high, but it does not indicate that the established model has high predictive ability. Therefore, the QSAR model must pass effective external verification to ensure the model's ability to predict external samples. The best way to verify the model externally is to use a representative and large enough test set to verify, and the predicted value of the test set can be compared with the experimental value. The prediction correlation coefficient rpred2 (rpred2 > 0.6)[24] based on the test set is calculated according to equation (5):
|
|
(5) |
Where
Topomer Search technology is a virtual screening tool that can specify template molecules for cutting to obtain molecular structural fragments. It can quickly and reliably search for chemical structures of similar shapes in the database based on the R group search technology. In this study, by searching the compound database of ZINC (2015)[25] (a source of molecular structure fragments), combining topomer distance (TOPDIST) and substituent contribution values, the established Topomer CoMFA model was used to score these fragments, thus obtaining R1, R2, R3 and R4 with higher contribution values substituents, and then through splicing design to obtain more active CCR5 inhibitor small molecules.
The principle of molecular docking is the "lock-and-key model"[26]. The lock is a macromolecular receptor with different structures and the key is a small molecule ligand with a specific structure, which is used to explore the functional and mechanism of action of drugs and macromolecular proteins[27]. Compounds and receptor active pockets are mainly combined through hydrogen bonds, van der waals forces and hydrophobic interactions. The formation of hydrogen bonds is crucial to the stability of the composite system. It is considered to be one of the most important interactions in the biorecognition process, and it has an important influence on the affinity of the compound and the receptor macromolecule. Due to the directional requirements of hydrogen bonds, the parameters that consider the formation of hydrogen bonds are: the distance between the hydrogen acceptor and the donor center is less than 3.5 Å. Through the research and analysis of the compound's hydrogen bond mode and receptor activity pocket, the inhibitory mechanism of the compound can be understood at the molecular or atomic level.
SYBYL-X 2.0 (Surflex-dock method)[28] was used to conduct molecular docking studies on the data set reported in previous experimental studies on compound 67 with the highest activity and the four optimal designed molecules and the 4RZ8 protein. The relationship between the structure of side chain substituents of 1-(3, 3-diphenylpropyl)-piperidinyl and urea derivatives and their inhibitory activity was further analyzed. By comparing the docking results, the reasons for the high inhibitory activity of compound 67 against HIV were expounded, and the antiviral mechanism of the designed compound was also understood.
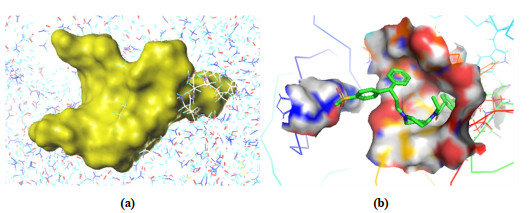
The crystal structure used in the docking process comes from the RSCB PDB database (http://www.rcsb.org; PDB ID: 4RZ8)[29], and the docking mode is set to Surflex-dock (SFXC) and all amino acid residues in the ligand molecule 5 Å were set as superposed active pockets. Before molecular docking, protein macromolecules need to be pretreated to remove protein ligands, metal ions, water molecules and other residues and terminal residues[30], and add polar hydrogens and Gastelger-Hückel charges. Then the required small molecule ligand was extracted from the macromolecular protein, exposing the binding pocket (represented by the prototype molecule) (Fig. 4a). The binding pocket is filled with three molecular probes: NH (hydrogen bond donor), CH4 (hydrogen bond acceptor) and CO (hydrophobic site).
Computer simulation of ADME/T prediction can not only improve the overall quality of drug candidates, but also improve the success rate of drug development and reduce the overall cost of drug development, which has become the preferred method in early drug discovery. In silico absorption, distribution, metabolism, excretion (ADME) and toxicity (T) modeling are highly valued by pharmaceutical scientists as tools for rational drug design, and various predictive models related to ADME/T have been reported. Absorption is the process by which the drug enters the blood circulation from the site of use. Distribution is the redistribution of drugs through blood to various tissues by oral and subcutaneous injection to react with the corresponding target molecules. Metabolic stability describes the speed and extent of compound metabolism, and is one of the main factors affecting the pharmacokinetic properties. Toxicity is the extent to which a substance damages the body or organs.
In this study, pharmacokinetic properties (absorption, distribution, metabolism and excretion) and toxicity (T) parameters were evaluated through the preADMET online server[31]: human intestinal absorption (HIA), skin permeability (SP, log P), in vitro caco-2 cell permeability, in vitro Madin-Darby Canine Kidney (MDCK) cell permeability, plasma protein binding (PPB), blood brain binding (BBB), p-glycoprotein (Pgp), cytochrome p450 isoforms inhibition data, total clearance, and toxicity (Ames test, rodent carcinogenicity assay and hERG-inhibition).
The modeling statistical parameters are shown in Table 1 (model 1: r2 = 0.789, q2 = 0.681, rpred2 = 0.610; model 2: r2 = 0.868, q2 = 0.687, rpred2 = 0.623). The two models q2 are both greater than 0.5, and r2 and rpred2 are both greater than 0.6. The results show that the QSAR models constructed by the two cutting methods have good correlation and strong predictive ability, and they are ideal Topomer CoMFA models. Based on the comprehensive analysis, model 2 has better internal and external predictive capabilities, and better retains the core skeleton of the inhibitor in the cutting method, which is conducive to the selection of R groups, so it is selected for subsequent research and molecular design.
 DownLoad:
CSV
DownLoad:
CSV
| Model | R1 | R2 | R3 | R4 | N | q2 | r2 | rpred2 | F | SEE | qstderr2 | rstderr2 |
| 1 | 0.71 | 1.21 | 1.53 | 0.10 | 2 | 0.681 | 0.789 | 0.610 | 112.052 | 0.423 | 0.61 | 0.47 |
| 2 | 0.63 | 0.95 | 1.39 | 0.01 | 5 | 0.687 | 0.868 | 0.623 | 174.745 | 0.344 | 0.53 | 0.45 |
| R1, R2, R3 and R4: the contribution value of R1, R2, R3 and R4 groups; N: the optimal number of principal components; q2: the LOO cross-validation correlation coefficient; r2: the non-cross-validation correlation coefficient; rpred2: the prediction correlation coefficient of the test set; F: the Fischer ratio value; SEE: the standard error of estimate; qstderr2: the standard error of cross-validation coefficient; rstderr2: the standard error of non-cross-validation coefficient. | ||||||||||||
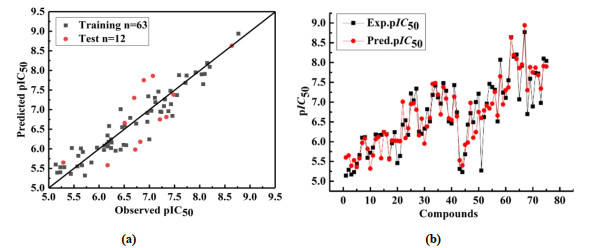
The linear regression diagram between the experimental and predicted values of the Topomer CoMFA model is shown in Fig. 5a, and all samples are evenly distributed around the 45° line. Fig. 5b shows that the predicted pIC50 values of these compounds are highly similar to the experimental values, indicating that the Topomer CoMFA model has shown satisfactory predictive power in the entire data set, for compounds with lower activity (5, 6, 8, 13, 15, 16) and more active compounds (34, 53, 56, 62, 63, 72) have good predictive power. These results confirm that the Topomer CoMFA model has good predictive power for 1-(3, 3-diphenylpropyl)-piperidinyl and urea derivatives, and further proves that the constructed QSAR model is relatively reliable with good fitting power. Therefore, the obtained 3D QSAR model can be used to screen and design new compounds.
According to model 2, the three-dimensional equipotential map constructed with the most active molecule No. 67 as the template is shown in Fig. 6. Figs. 6a, 6c, 6e, and 6g are steric field maps of R1, R2, R3 and R4 accordingly. The green part shows that increasing the volume of substituents is beneficial to the improvement of compound activity, while the yellow part exhibits the opposite. Figs. 6b, 6d, 6f, and 6h are electrostatic fields of R1, R2, R3 and R4 correspondingly; the red area indicates that introducing a negatively charged substituent is beneficial to the improvement of compound activity, and the blue area suggests that introducing a positively charged substituent is beneficial to increase the activity of the compound.
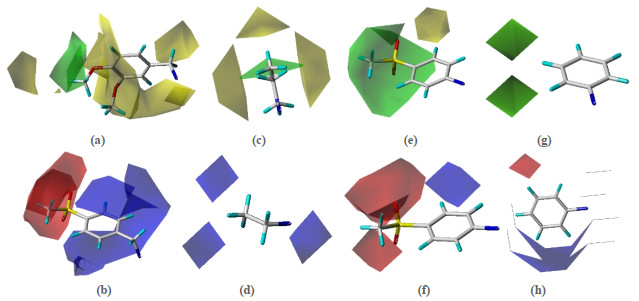
The position of the R1 substituent in Fig. 6a is covered by a large yellow area, indicating that it is not suitable to introduce bulky substituents here. For example, the -benzyloxy, -phenyl, -2, 4, 5-OMe, -NHCOMe and -CO2Me substituents on R1 of compounds 20, 21, 18, 24 and 29 (pIC50 = 5.46, 5.64, 5.96, 6.17, 6.20) are substituted by compound 25 (pIC50 = 7.22) with -CN substituent, and the activity is obviously improved. In Fig. 6c, a smaller -CH3 group is introduced on the No. 31 molecule (pIC50 = 6.82) at the R2 substituent position to replace the larger-allyl substituent on compound 42 (pIC50 = 6.74), and the activity also increased. From Fig. 6e, it can be seen that there is a large green area at the position of the R3 substituent, indicating that the introduction of a bulky group at this position is beneficial to the molecular inhibitory activity, such as molecule 67 (pIC50 = 8.77) which introduces a larger -SO2Me group at the R3 position to replace the smaller ones on compounds 57, 68, 65, 61 and 66 (pIC50 = 6.51, 6.7, 7.07, 7.55, 7.92) -F, -NH2, -Ph, -CH3 and -SMe substituents, thus significantly increasing the activity; molecule 73 (pIC50 = 6.98) replaces the larger -NHCOMe substituent on compound 74 (pIC50 = 8.10) with the -NH2 group at the R3 position, and the activity is remarkably reduced.
Fig. 6b shows a large blue area near the benzene ring of the R1 substituent, indicating that the electronegativity of the group can be reduced in this area or the introduction of electron withdrawing groups is beneficial to the compound inhibitory activity increase. No. 4 substituent position of the benzene ring compound 30 (R2 = hydroxyl, pIC50 = 6.33) > compound 19 (R2 = bromo, pIC50 = 6.24) > compound 7 (R2 = chloro, pIC50 = 6.10), compound 25 (R2 = cyano, pIC50 = 7.22) > compound 31 (R2 = nitro, pIC50 = 6.82), compound 54 (R2 = methyl, pIC50 = 7.46) > compound 50 (R2 = hydrogen, pIC50 = 7.21). In Fig. 6f, for example, compound 64 (R3 = methoxy, pIC50 = 8.20) > compound 58 (R3 = chlorine, pIC50 = 8.07) > compound 57 (R3 = fluorine, pIC50 = 6.51). In Fig. 6d, there is a large red area near the R2 substituent, indicating that increasing the electronegativity of the group at this substituent position helps improve the activity of the compound. For example, compound 23 (R2 = methyl, pIC50 = 6.54) > compound 32 (R2 = ethyl, pIC50 = 6.51), compound 25 (R2 = methyl, pIC50 = 7.22) > compound 33 (R2 = ethyl, pIC50 = 6.51).
The performance of the HQSAR model is affected by parameters such as HL (hologram length), FD (fragment discrimination type) and FS (fragment size), and these parameters need to be refined and optimized. We initially used the default FS (4~7) and all HLs and different combinations of FD (atoms, bonds, chirality, connection, H-bond donor and H-bond acceptor) to generate the model. It can be seen from Table S2 that when the combination of fragment distinguishing parameters is A/B/C/H/Ch/DA, a better model can be obtained: 4~7 for fragment size and 199 for hologram length, showing the highest q2(0.772) and r2(0.907) with 6 components and the standard error of 0.290.
Based on the better fragment parameters A/B/C/H/Ch/DA, different FS were selected to study the influence of FS on the HQSAR analysis results (Table S3). The results show that when FD is "A/B/C/H/Ch/DA" and FS is "6~7", the generated model is the best HQSAR model: 6~7 for fragment size and 199 for hologram length, showing the highest q2 (0.781) and r2 (0.921) with 6 components and the standard error of 0.293.
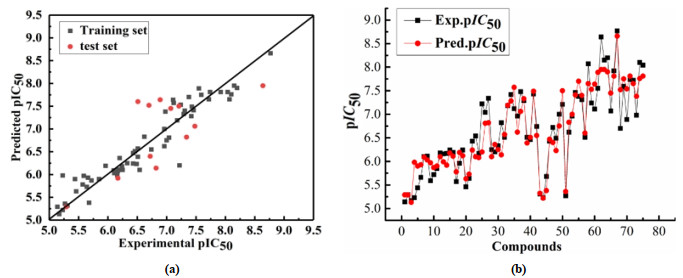
Fig. 7a depicts the pIC50 correlation diagram of the experimental and predicted value activities of the HQSAR model data set. All samples are evenly distributed near the y = x line, showing a good linear relationship. Fig. 7b shows that the predicted pIC50 values of these compounds are almost consistent with the experimental values. The compounds with lower activity (2, 7, 11, 43, 44) and those with higher activity (33, 38, 41, 53) have good predictive ability, indicating that the HQSAR model has satisfactory prediction ability. These results confirm that the HQSAR model has a good predictive ability for CCR5 inhibitors, and also prove that the constructed QSAR model is relatively reliable, with good fit and robustness. Therefore, the obtained HQSAR model can be used to screen and design new compounds.
The HQSAR model contribution graph of the most active compound No. 67 is shown in Fig. 8 and each atom reflects its contribution to the overall activity of the molecule. The atomic color code is white, indicating that the atom or group has a neutral contribution to the biological activity of the molecule. Atomic color code from orange, orange-red to red indicates that the adverse effect on the activity increases in sequence, and the atomic color code from yellow, cyan to green means that the beneficial contribution of the molecular biological activity value increases in sequence. We can visually determine the potential impact of fragments or atoms on the activity, and derive which fragments or atoms may be the key contributors to the activity value of CCR5 inhibitors based on different colors.
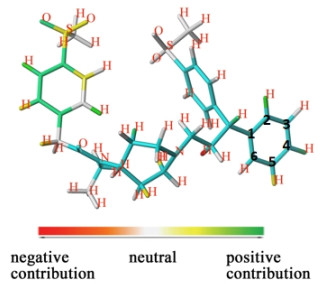
The color code analysis of Fig. 8 shows large areas of cyan appearing in the R3 and R4 groups and the positions of the public skeleton in the picture, indicating that the groups and atoms at these positions have a greater influence on the activity of the compound, and also verify that the selection of the public skeleton is correct. The contribution of the H atom of the R3 group C–2 > C–4 > C–5 > C–3 = C–6. The R1 group C–2, C–3, C–4 near the white to yellow to green color changes, which proves that the atoms and groups at such positions gradually increase the biological activity value of the compound, indicating this substitution pattern is advantageous to the compound. The introduction of the -SO2Me group at the C–4 position of the R1 group has a positive contribution to the activity of the compound. But the introduction of the -SO2Me group at the C–4 position of the R4 group has no special contribution to the activity, and can be substituted by a more effective substituent.
According to the constructed 3D QSAR model, HQSAR model and the results of correlation analysis, compound 67 was used as the template for molecular structure optimization. In the ZINC database, Topomer search was used to select the topomer distance close to 185, and the contribution value of each group exceeded that of the R group of the template molecule. 4 R1, 5 R2, 1 R3 and 2 R4 groups were selected for molecular design according to the permutation and combination principle. A total of 40 new 1-(3, 3-diphenyl-propyl)-piperidinyl and urea derivatives were designed, and the three-dimensional structures of the new molecules were constructed in SYBYL-X 2.0 and then model 2 was used to predict its activity. It can be seen from Table S4 that the predicted activity values of the 40 newly designed inhibitor molecules are higher than those of the template molecule, and the activity is increased by 10.82%~15.17%, which can be used as candidate compounds for new anti-AIDS drugs. The 40 compounds designed can be further studied by ADMET to predict whether they have a good inhibitory effect on HIV.
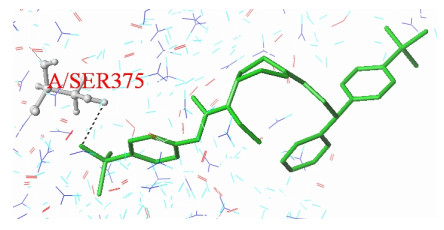
The interaction patterns of the most active compound (67) and the newly designed compound with 4RZ8 protein were studied using the Surflex-dock program of SYBYL-X 2.0 software and Discovery Studio Visual 2017. The docking scoring results of the compounds are listed in Table S5. The scoring function was used to select the best ligand and predict its binding mode. The higher the scoring function value of total score, the better the affinity between the small molecule ligand extracted from the macromolecular protein and the receptor; the closer the absolute value of crash to zero, the smaller the degree of inappropriateness between the ligand and the receptor extracted from the macromolecular protein. Polar is the score of the polarity function, which can be divided into binding sites located on the surface (the higher the score, the better) and the interior of the molecule (the lower the score, the better)[32]. Fig. 9 shows a molecular docking diagram of compound 67 that acts as a ligand to provide hydrogen bond receptors for forming one hydrogen bond with amino acid residues A/SER375, The total score, crash and polar are 5.27, –1.74, and 1.21, respectively.
The hydrogen bonding action is shown as a green dotted line, and the hydrophobic action as a pink one. In Fig. 10a, the ligand (7-35) mainly forms four hydrogen bonds with A/ILE475, A/GLY198, A/TRP427 and A/GLY429 residues in the protein crystal, and forms hydrophobic interaction with amino acid residues such as A/PRO238 and A/ILE371. The total score, crash and polar are 10.07, –2.94, and 3.97, respectively. It can be seen that the selection of ligands and protein crystals is more appropriate, and the docking method is reasonable and reliable. As shown in Fig. 10b, compound 7-33 mainly formed hydrogen bonding interactions with A/ILE475, A/ASN425, A/GLN432 and A/TRP427 residues in the crystal structure and hydrophobic interactions with amino acid residues like A/ILE371, B/ALA60 and A/GLY473, with the total score, crash, and polar of 7.34, –2.93, and 2.22, respectively.
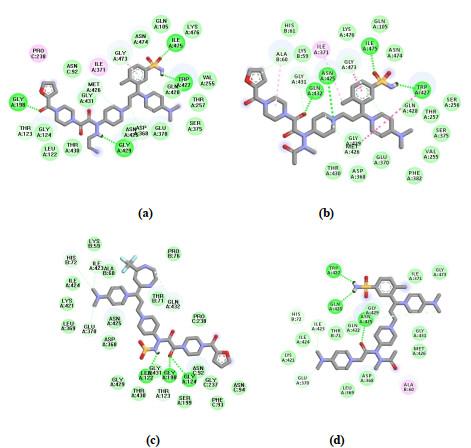
Fig. 10c shows that the newly designed compound 3~12 formed a total of three hydrogen bonding interactions with residues A/LEU122, A/GLY198 and A/GLY124, with the total score, crash, and polar of 7.78, –2.52 and 1.43, respectively. Fig. 10d shows that the newly designed compounds 6~28 formed a total of three hydrogen bonding interactions with residues A/TRP427, A/GLN428 and A/ASN425, and formed hydrophobic interactions with amino acid residues such as B/ALA60, with the total score, crash, and polar of 8.34, –1.51, 1.85, respectively. The results showed that the newly designed compounds formed strong hydrogen bonding interactions with amino acid residues such as A/TRP427, A/ASN425, A/GLY198, and these interactions enhanced the binding strengths of the ligands and receptors, so the docking results of the designed compounds were reliable and beneficial.
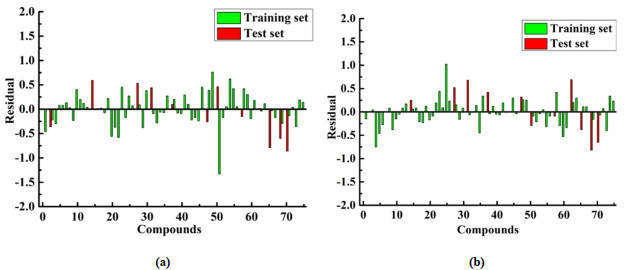
The residual values of the QSAR model of CCR5 inhibitors are shown in Figs. 11a and 11b, respectively. Compounds 8, 15, 16, 32, 40, 53, 56 and 72 have the best predicted activity in Topomer CoMFA and HQSAR analysis (residual error < 0.1). The comparison of the predicted activity value and the residual value of the Tomoper CoMFA and HQSAR models is shown in Table S6, and the comparison of the model results is listed in Table 2.
 DownLoad:
CSV
DownLoad:
CSV
| Model | N | q2 | r2 | rpred2 | SEE | HL | F |
| HQSAR | 6 | 0.781 | 0.921 | 0.636 | 0.293 | 199 | - |
| Topomer CoMFA | 6 | 0.687 | 0.868 | 0.623 | 0.344 | - | 174.745 |
The three-dimensional contour map, color code map, and experimental activity value of each compound are combined to analyze compound 67, which shows the area that affects the activity of CCR5 inhibitor. The introduction and optimization of functional groups improved the inhibitory activity of 1-(3, 3-diphenylpropyl)-piperidinyl and urea derivatives, and the identification of the protein 4RZ8 binding pocket provided clues to its inhibitory mechanism.
Although there are obvious differences between the two models in structure, the experimental results are consistent with the predicted bioactivity, which indicates that the two models have reliable predictive ability for the modification of 1-(3, 3-diphenylpropyl)-piperidinyl and urea derivative inhibitors. By comparison, the HQSAR model analysis results were consistent with the Topomer CoMFA model analysis results. From the molecular docking results, we believe that the formation of hydrogen bonds between the newly designed molecule and amino acid residues A/TRP427, A/ASN425, and A/GLY198 has a positive effect on the inhibitory activity. In terms of the structure-activity relationship, the following conclusions can be drawn: R1 should be a small volume electron-withdrawing group, R2 should be a small volume group with positive charge, and R3 should be a large volume group with high electronegativity. This also explains why the template molecule 67 is the most active of all the compounds.
The ADMET properties of a compound are considered to be important criteria for determining whether a small compound can be used as a drug. Table S7 and Table S8 show the ADMET properties of the newly designed compound. We can see that all compound molecules show good intestinal absorption, indicating that these drugs can be well absorbed by the body. All compounds show strong PPB values; the compounds have low BBB values and low permeability to prevent drugs from entering the central nervous system (CNS). Determination of glycoprotein (P-gp) inhibition rate can predict the excretion performance of the target compound. The test compound has a good inhibitory effect on CYP3A4 and P-gp, but has no inhibitory effect on CYP2C19. Most of the compounds have no inhibitory effect on CYP2C19 and CYP2D6.
In AMES test, 14 test compounds showed mutagenic behavior, and the remaining compounds all showed non-mutagenic behavior. Except for compounds 06~15 which have carcinogenic effect on rat, the other compounds have negative carcinogenic effect on mouse and rat, and the risk of being a cardiotoxic drug is moderate. It shows that the designed drug has high molecular safety and obvious pharmacological effects. The prediction of the ADMET properties of newly synthesized compounds proves that they have good lead compound properties. According to the prediction results of ADMET, theoretically, we can consider them to be promising CCR5 inhibitors.
In this study, Topomer CoMFA and HQSAR were used to model 75 1-(3, 3-diphenylpropyl)-piperidinyl and urea derivatives as CCR5 inhibitors, and two models with good statistical parameters and reliable predictive ability were obtained. The two methods used different descriptors to obtain different modeling results. Although there were significant differences in structure, the experimental results were consistent with the predicted biological activity, and the obtained model results could be verified with each other. The contour map and color code map of the model show the effect of substituent structure on the biological activity of the compound. In addition, 40 new compounds were designed by virtual screening and their pIC50 were predicted, further verifying the accuracy of QSAR results. Molecular docking was used to study the binding mode between ligand and protein receptor. It was found that the amino acid residues formed the hydrogen bonding interaction between ligand and crystal structure. The newly designed compounds and amino acid residues A/GLY124, A/GLY198, A/ASN425, A/TRP427 and A/ILE475 can form strong hydrogen bonding interactions, which enhance the ligand-receptor binding strength. The ADMET prediction results are also satisfactory. We have designed a series of highly active CCR5 inhibitors using simple and efficient computer-aided design method. This work provides structural basis and theoretical guidance for rational design of CCR5 inhibitors.
Qian, Y. J.; Wu, Z. Y.; Chen, C.; Du, K. F.; Wei, W. B. Detection of HIV-1 viral load in tears of HIV/AIDS patients. Infection 2020, 48, 929–933. doi: 10.1007/s15010-020-01508-2
Gao, R.; Fang, Q. J.; Zhang, X.; Xu, Q.; Ye, H. H.; Guo, W. Y.; He, J.; Chen, Y. H.; Wang, R. X.; Wu, Z. J; Yu, J. R5 HIV-1 gp120 activates p38 MAPK to induce rat cardiomyocyte injury by the CCR5 coreceptor. Pathobiology 2019, 86, 274–284. doi: 10.1159/000502238
Hemkens, L. G.; Bucher, H. C. HIV infection and cardiovascular disease. Eur. Heart. J. 2014, 35, 1373–1381. doi: 10.1093/eurheartj/eht528
Moore, J. P.; Stevenson, M. New targets for inhibitors of HIV-1 replication. Nat. Rev. Mol. Cell Bio. 2000, 1, 40–49. doi: 10.1038/35036060
Wells, T. N. C.; Proudfoot, A. E.; Power, C. A. Chemokine receptors-the new frontier for AIDS research. Cell Chem. Biol. 1996, 3, 603−609.
Palani, A.; Shapiro, S.; Clader, J. W. Biological evaluation and interconversion studies of rotamers of SCH 351125, an orally bioavailable CCR5 antagonist. Bioogr. Med. Chem. Lett. 2003, 13, 705–708. doi: 10.1016/S0960-894X(02)01062-4
Shahlaei, M.; Fassihi, A. QSAR analysis of some 1-(3, 3-diphenylpropyl)-piperidinyl amides and ureas as CCR5 inhibitors using genetic algorithm-least square support vector machine. Med. Chem. Res. 2013, 22, 4384–4400. doi: 10.1007/s00044-012-0430-2
Heravi, Y. E.; Sereshti, H.; Saboury, A. A. 3D QSAR studies, pharmacophore modeling, and virtual screening of diarylpyrazole-benzenesulfonamide derivatives as a template to obtain new inhibitors, using human carbonic anhydrase II as a model protein. J. Enzyme Inhib. Med. Chem. 2017, 32, 688−700. doi: 10.1080/14756366.2016.1241781
Zheng, X.; He, M. X.; Tan, X.; Zheng, J.; Wang, F. Y.; Liu, S. 3D-quantitative structure-activity relationship and docking studies of coumarin derivatives as tissue kallikrein 7 inhibitors. J. Pharm. Pharmacol. 2017, 69, 1136−1144. doi: 10.1111/jphp.12751
Li, S. L.; Bao, X. F.; Lu, C. H.; Ren, C. R.; Liu, G. C.; Du, H. G. Essential structural profile of novel adenosine derivatives as antiplatelet aggregation inhibitors based on 3D-QSAR analysis using CoMFA, CoMSIA, and SOMFA. Russ. J. Bioorg. Chem+. 2020, 46, 448−457. doi: 10.1134/S1068162020030103
Fu, L.; Chen, Y.; Xu, C. M. 3D-QSAR, HQSAR, molecular docking, and new compound design study of 1, 3, 6-trisubstituted 1, 4-diazepan-7-ones as human KLK7 inhibitors. Med. Chem. Res. 2020, 29, 1012–1029. doi: 10.1007/s00044-020-02542-3
Tong, J. B.; Shan, L.; Qin, S. S. QSAR studies of TIBO derivatives as HIV-1 reverse transcriptase inhibitors using HQSAR, CoMFA and CoMSIA. J. Mol. Struct. 2018, 1168, 56–64. doi: 10.1016/j.molstruc.2018.05.005
Cheng, Y.; Mei, Z.; Tung, C. H. Studies on two types of PTP1β inhibitors for the treatment of type 2 diabetes: hologram QSAR for OBA and BBB analogues. Bioorg. Med. Chem. Lett. 2010, 20, 3329–3337. doi: 10.1016/j.bmcl.2010.04.033
Castilho, M. S.; Postigo, M. P.; Montanari, C. A.; Oliva, G.; Andricopulo, A. D. Two- and three-dimensional quantitative structure-activity relationships for a series of purine nucleoside phosphorylase inhibitors. Bioorgan. Med. Chem. 2006, 14, 516−527. doi: 10.1016/j.bmc.2005.08.055
Cumming, J. G.; Cooper, A. E.; Grime, K.; Logan, C. J.; McLaughlin, S.; Oldfield, J.; Shaw, J. S.; Tucker, H.; Winter, J.; Whittaker, D. Modulators of the human CCR5 receptor. Part 2: SAR of substituted 1-(3, 3-diphenylpropyl)-piperidinyl phenylacetamides. Bioorg. Med. Chem. Lett. 2005, 15, 5012–5015. doi: 10.1016/j.bmcl.2005.08.014
Burrows, J. N.; Cumming, J. G.; Fillery, S. M.; Hamlin, G. A.; Hudson, J. A.; Jackson, R. J.; McLaughlin, S.; Shaw, J. S. Modulators of the human CCR5 receptor. Part 1: discovery and initial SAR of 1-(3, 3-diphenylpropyl)-piperidinyl amides and ureas. Bioorg. Med. Chem. Lett. 2005, 15, 25–28. doi: 10.1016/j.bmcl.2004.10.044
Niu, B.; Lu, Y.; Wang, J. Y.; Hu, Y.; Chen, J. H.; Chen, Q.; He, G. W.; Zheng, L. F. 2D-SAR, Topomer CoMFA and molecular docking studies on avian influenza neuraminidase inhibitors. Comput. Struct. Biotec. 2019, 17, 39–48. doi: 10.1016/j.csbj.2018.11.007
Zhu, W. L.; Chen, G.; Hu, L. H.; Luo, X. M.; Gui, C. S.; Luo, C.; Puah, C. M.; Chem, K. X.; Jiang, H. L. QSAR analyses on ginkgolides and their analogues using CoMFA, CoMSIA, and HQSAR. Bioorg. Med. Chem. 2005, 13, 313−322. doi: 10.1016/j.bmc.2004.10.027
Huang, D. D.; Liu, Y. L.; Shi, B. Z.; Li, Y. T.; Wang, G. X.; Liang, G. Z. Comprehensive 3D-QSAR and binding mode of BACE-1 inhibitors using R-group search and molecular docking. J. Mol. Graph. Model. 2013, 45, 65−83. doi: 10.1016/j.jmgm.2013.08.003
Shirmohammadi, M.; Mohammadinasab, E.; Bayat, Z. Prediction of lipophilicity of some quinolone derivatives by using quantitative structure-activity relationship. Curr. Drug. Discov. Technol. 2021, 18, 83–94. doi: 10.2174/1570163816666191108145026
Xiang, Y. H.; Hou, Z. Y.; Zhang, Z. Y. Pharmacophore and QSAR studies to design novel histone deacetylase 2 inhibitors. Chem. Biol. Drug Des. 2012, 79, 760–770. doi: 10.1111/j.1747-0285.2012.01341.x
Kiralj, R.; Ferreira, M. Basic validation procedures for regression models in QSAR and QSPR studies: theory and application. J. Brazil. Chem. Soc. 2009, 20, 770–787. doi: 10.1590/S0103-50532009000400021
Aynur, O. A.; Nina, G. J.; Terry, W. S.; Mark, T. D. C. The better predictive model: high q2 for the training set or low root mean square error of prediction for the test set? Mol. Inform. 2010, 24, 385–396.
Golbraikh, A.; Tropsha, A. Beware of q2! J. Mol. Graph. Model. 2002, 20, 269–276. doi: 10.1016/S1093-3263(01)00123-1
Sterling, T.; Irwin, J. J. ZINC 15-ligand discovery for everyone. J. Chem. Inf. Model. 2015, 55, 2324-2337. doi: 10.1021/acs.jcim.5b00559
Tripathi, A.; Bankaitis, V. A. Molecular docking: from lock and key to combination lock. J. Mol. Med. Clin. App. 2017, 2, 1–9. doi: 10.1016/j.nhccr.2017.03.001
Dudutiene, V.; Zubriene, A.; Kairys, V.; Smirnov, A.; Smirnoviene, J.; Leitans, J.; Kazaks, A.; Tars, K.; Manakova, L.; Grazulis, S.; Matulis, D. Isoform-selective enzyme inhibitors by exploring pocket size according to the lock-and-key Principle. Biophys. J. 2020, 119, 1513–1524. doi: 10.1016/j.bpj.2020.08.037
Liu, J.; Li, Y.; Zhang, H. X.; Zhang, S. W.; Yang, L. Studies of H4R antagonists using 3D-QSAR, molecular docking and molecular dynamics. J. Mol. Model. 2012, 18, 991–1001. doi: 10.1007/s00894-011-1137-x
Cleves, A. E.; Jain, A. N. Knowledge-guided docking: accurate prospective prediction of bound configurations of novel ligands using Surfex-Dock. J. Comput. Aided. Mol. Des. 2015, 29, 485–509. doi: 10.1007/s10822-015-9846-3
Tong, J. B.; Luo, D.; Bian, S.; Zhang, X. Structural investigation of tetrahydropteridin analogues as selective PLK1 inhibitors for treating cancer through combined QSAR techniques, molecular docking, and molecular dynamics simulations. J. Mol. Liq. 2021, 335, 116235–17. doi: 10.1016/j.molliq.2021.116235
Zhang, X. Z.; Xu, Y.; Jian, M. M.; Yang, K.; Ma, Z. Y. Synthesis, in vitro assays, molecular docking, theoretical ADMET prediction, and evaluation of 4-methoxy-phenylthiazole-2-amine derivatives as acetylcholinesterase inhibitors. Med. Chem. Res. 2019, 28, 1683–1693. doi: 10.1007/s00044-019-02405-6
Jain, A. N. Surfex-Dock 2.1: robust performance from ligand energetic modeling, ring flexibility, and knowledge-based search. J. Comput. Aided. Mol. Des. 2007, 21, 281–306. doi: 10.1007/s10822-007-9114-2

Figure 4 (a) Prototype molecular generation diagram (yellow area represents prototype molecule); (b) Interaction of compound 67 at the active site of the enzyme (PDB ID: 4RZ8)

Figure 5 Plots of experimental versus predicted pIC50 values for the training and test set molecules for Topomer CoMFA model

Figure 7 Plots of the experimental versus predicted pIC50 values for the training and test set molecules for HQSAR model

Figure 10 Results of the newly designed molecular docking. (a) 7-35, (b) 7-33, (c) 3-12 and (d) 6-28

Figure 11 Residual plots between experimental and predicted values for (a) Topomer CoMFA model and (b) HQSAR model
Table 1. Comparison of Modeling Results of Topomer CoMFA
| Model | R1 | R2 | R3 | R4 | N | q2 | r2 | rpred2 | F | SEE | qstderr2 | rstderr2 |
| 1 | 0.71 | 1.21 | 1.53 | 0.10 | 2 | 0.681 | 0.789 | 0.610 | 112.052 | 0.423 | 0.61 | 0.47 |
| 2 | 0.63 | 0.95 | 1.39 | 0.01 | 5 | 0.687 | 0.868 | 0.623 | 174.745 | 0.344 | 0.53 | 0.45 |
| R1, R2, R3 and R4: the contribution value of R1, R2, R3 and R4 groups; N: the optimal number of principal components; q2: the LOO cross-validation correlation coefficient; r2: the non-cross-validation correlation coefficient; rpred2: the prediction correlation coefficient of the test set; F: the Fischer ratio value; SEE: the standard error of estimate; qstderr2: the standard error of cross-validation coefficient; rstderr2: the standard error of non-cross-validation coefficient. | ||||||||||||
 下载: 导出CSV
Table 2. Comparison Results of HQSAR and Topomer CoMFA Models
| Model | N | q2 | r2 | rpred2 | SEE | HL | F |
| HQSAR | 6 | 0.781 | 0.921 | 0.636 | 0.293 | 199 | - |
| Topomer CoMFA | 6 | 0.687 | 0.868 | 0.623 | 0.344 | - | 174.745 |
下载: 导出CSV

 扫一扫看文章

扫一扫关注我们


