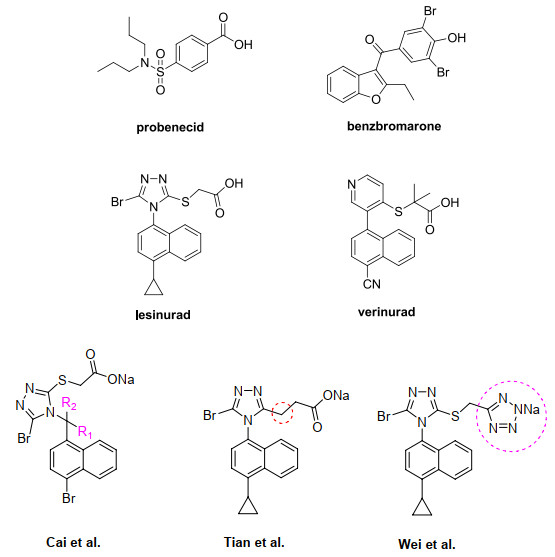
Figure 1.
Representative URAT1 inhibitors and current design strategies

Gout is the most common inflammatory arthritis affected by the deposition of monosodium urate (MSU) in joints and surrounding tissues, characterized by repeated swelling, redness and severe pain in the joints[1]. Hyperuricemia, commonly caused by overproduction and/or under-excretion of urate, is a condition necessary for MSU formation and deposition[2]. Reports to date show that more than 90% of patients with hyperuricemia are due to insufficient uric acid secretion, supporting the regulation of uric acid excretion as a potentially effective therapeutic strategy[3]. In humans, the level of sUA is primarily controlled by a complex transporter system expressed in the proximal tubules of the renal. In short, uric acid is freely filtered in glomerulus, and > 90% of the urate that passed through the kidney is reabsorbed back into the bloodstream, while < 10% of the remained is excreted in urine[4]. The reabsorption process is primarily mediated by uric acid transporter 1 (URAT1, SLC22A12), also referred to as urate transporter 1 or urate-anion exchanger. URAT1 was firstly certified as a 12-transmembrane protein in 2002, which is mainly expressed in the apical side of renal cortical proximal tubular epithelial cells, and is considered to be an important target for the management of hyperuricemia[5].
Benzbromarone was the first URAT1 inhibitor approved by US FDA in 1976 for the treatment of gout but subsequently withdrawn from the market in 2003 due to its hepatotoxicity[5]. Next, lesinurad (RDEA594, developed by Ardea Biosciences) was granted restricted approval by the US FDA in 2015 (Fig. 1)[6]. The drug bears a relatively rigid molecular scaffold structure consisting of naphthalene and 1, 2, 4-triazole rings as well as carboxylic acid, a functional group commonly present in URAT1 inhibitors. Due to its outstanding potency and favorable toxicology profile, diverse lesinurad analogs, for example, verinurad (RDEA3170, developed by AstraZeneca), have advanced through clinical trials[7-12]. Cai et al.[13] introduced substituents into the CH2 linker that resulted in a marked decrease in bioactivity. Tian and co-workers reported that the S atom could be replaced with CH2 for the enhancement of URAT1 inhibitory activity[14] while studies by Wei et al.[15] suggested that tetrazole is a satisfactory bioisostere of carboxylic acid in lesinurad.
However, currently, there is no report of URAT1 protein structure, which is not conducive to the drug design based on receptor structure. Docking studies have been recently performed on a homology model of hURAT1[16]. As hURAT1 is a flexible transmembrane protein, the docking results are not reliable enough to design new compounds because of the uncertain binding conformations. On the other hand, the wide application of Topomer comparative molecular field analysis (CoMFA) with the objective of establishing generic structure-activity relationships (SAR) can be used for virtual screening due to its rapid and high efficiency[17-19]. To our knowledge, Topomer CoMFA was reported for the study of SARs of URAT1 inhibitors, which is mainly studied on benzbromarone and its analogues to explain whether the methylene linker between triazole and naphthalene can increase the inhibitory activity of those compounds to hURAT1[20].
For our studies, the structures we collected were targeted lesinurad with the structural skeleton of naphthyltriazole in order to find URAT1 inhibitors with better activity. The data obtained may be effectively applied to clarify the mechanisms underlying URAT1 inhibition by these compounds and provide critical information for designing novel inhibitors with expected activities.
In total, 68 inhibitors targeting URAT1 were identified from the literature[14, 15]. The inhibitory activities (IC50, μM) were converted to reciprocal logarithmic values (pIC50 = –log(IC50/106) ranging from 4.44 to 8.03. All analyses of URAT1 inhibitor compounds were carried out using SYBYL-X 2.0 (Tripos Software, Saint Louis, MO, USA) and MOE 2010.10 software.
Based on the pIC50 values and structural diversity, the compounds were grouped into two sets at a ratio of ~3:1, among which 51 compounds are the training set and 17 are the test set (Table 1)[21].
 DownLoad:
CSV
DownLoad:
CSV
 |
|||||
| No. | R1 | R2 | R3 | IC50(μM) | Exp.pIC50 |
| 1 | -H | -Br |  |
10.50 | 4.98 |
| 2 | -CH3 | -Br |  |
12.60 | 4.90 |
| 3 | -CH2CH3 | -Br |  |
8.40 | 5.08 |
| 4 | -(CH2)2CH3 | -Br |  |
8.30 | 5.08 |
| 5 |  |
-Cl |  |
6.30 | 5.20 |
| 6 |  |
-Br |  |
2.40 | 5.62 |
| 7* |  |
-I |  |
8.80 | 5.06 |
| 8 |  |
-OCH2CH3 |  |
9.10 | 5.04 |
| 9* | -OCH2CH3 | -Br |  |
11.20 | 4.95 |
| 10 | -H | -Br |  |
6.87 | 5.16 |
| 11 | -CH3 | -Br |  |
6.16 | 5.21 |
| 12 | -CH2CH3 | -Br |  |
5.37 | 5.27 |
| 13 | -(CH2)2CH3 | -Br |  |
2.03 | 5.69 |
| 14 | -CH(CH3)2 | -Br |  |
2.21 | 5.66 |
| 15* |  |
-Br |  |
3.52 | 5.45 |
| 16 | -OCH3 |
-Br |  |
8.90 | 5.05 |
| 17 | -OCH2CH3 | -Br |  |
11.49 | 4.94 |
| 18 | -H | -Br |  |
0.0338 | 7.47 |
| 19* | -CH3 | -Br |  |
0.0267 | 7.57 |
| 20 | -CH2CH3 | -Br |  |
0.0274 | 7.56 |
| 21 | -CH(CH3)2 | -Br |  |
0.0259 | 7.59 |
| 22 | -C(CH3)3 | -Br |  |
0.0211 | 7.68 |
| 23 |  |
-Br |  |
0.0165 | 7.78 |
| 24 | -F | -Br |  |
0.0251 | 7.60 |
| 25* | -Cl | -Br |  |
0.0228 | 7.64 |
| 26 | -Br | -Br |  |
0.0197 | 7.71 |
| 27 | -I | -Br |  |
0.029 | 7.54 |
| 28 | -OH |
-Br |  |
0.0341 | 7.47 |
| 29 | -OCH3 |
-Br |  |
0.0192 | 7.72 |
| 30 | -OCH2CH3 | -Br |  |
0.024 | 7.62 |
| 31 | -OCH(CH3)2 | -Br |  |
0.0275 | 7.56 |
| 32* | -OC(CH3)3 | -Br |  |
0.0283 | 7.55 |
| 33 |  |
-Br |  |
0.0316 | 7.50 |
| 34 | -CN | -Br |  |
0.0209 | 7.68 |
| 35* | -H | -Br |  |
0.0307 | 7.51 |
| 36 | -F | -Br |  |
0.0241 | 7.62 |
| 37 | -Cl | -Br |  |
0.0173 | 7.76 |
| 38* | -Br | -Br |  |
0.0209 | 7.70 |
| 39 | -I | -Br |  |
0.0294 | 7.53 |
| 40 | -OH |
-Br |  |
0.0295 | 7.53 |
| 41* | -OCH3 |
-Br |  |
0.0177 | 7.75 |
| 42 | -OCH2CH3 | -Br |  |
0.0206 | 7.69 |
| 43 | -OCH(CH3)2 | -Br |  |
0.0231 | 7.64 |
| 44 | -OC(CH3)3 | -Br |  |
0.0258 | 7.59 |
| 45 |  |
-Br |  |
0.0262 | 7.58 |
| 46 | -CN | -Br |  |
0.0140 | 7.85 |
| 47* | -H | -Br |  |
0.0328 | 7.48 |
| 48 | -CH3 | -Br |  |
0.0257 | 7.59 |
| 49 | -CH2CH3 | -Br |  |
0.0282 | 7.55 |
| 50 | -CH(CH3)2 | -Br |  |
0.0215 | 7.67 |
| 51 | -C(CH3)3 | -Br |  |
0.0167 | 7.78 |
| 52 |  |
-Br |  |
0.0131 | 7.88 |
| 53* | -F | -Br |  |
0.0239 | 7.62 |
| 54 | -Cl | -Br |  |
0.0186 | 7.73 |
| 55* | -Br | -Br |  |
0.0194 | 7.71 |
| 56 | -I | -Br |  |
0.0317 | 7.50 |
| 57 | -OH |
-Br |  |
0.0328 | 7.48 |
| 58* | -OCH3 |
-Br |  |
0.0149 | 7.83 |
| 59 | -OCH2CH3 | -Br |  |
0.0181 | 7.74 |
| 60 | -OCH(CH3)2 | -Br |  |
0.0215 | 7.67 |
| 61 | -OC(CH3)3 | -Br |  |
0.0242 | 7.62 |
| 62 |  |
-Br |  |
0.0257 | 7.59 |
| 63 | -CN | -Br |  |
0.0116 | 7.94 |
| 64* | -NO2 | -Br |  |
0.0094 | 8.03 |
| *Compounds belonging to the test set | |||||
To generate the most stable conformation, energy minimization was conducted using a Tripos force field with a distance-dependent dielectric and the energy gradient convergence criterion and maximum iterations set to 0.005 kcal/mol Å and 100, respectively[22-24]. The independent variables were the Topomer CoMFA descriptors and the dependent variables were the pIC50 values[25, 26].
The cross-validated correlation coefficient (q2) and the non-cross-validated correlation coefficient (r2) values were used to optimize the numbers of components in the partial least-squares (PLS) models, which were obtained by the leave-one-out (LOO) cross-validation procedure[27]. The internal quality of the models was measured using q2[28] obtained according to Eq. (1):
|
|
Where Ypred, Yexp, and Ymean represent the predicted, experimental and mean biological activities of the training set, respectively.
The predictive ability of the 3D-QSAR models was evaluated using the predicted correlation coefficient rpred2[29] calculated from Eq. (2):
|
|
Where SD represents the total of the squared deviation scores between the bioactivity of the test set and the average bioactivity of the training set, and PRESS is the total of squares between the predicted and experimental bioactivities of the test set[30].
The optimal 3D-QSAR model was graphically represented by field contour maps, and coefficients were formed by the CoMFA StDev * Coeff field type.
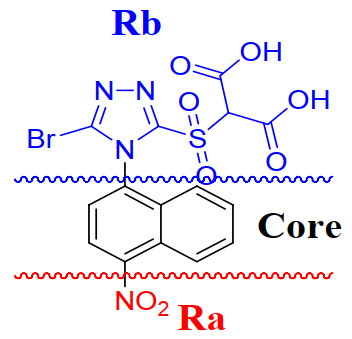
Empirically, the naphthalene ring was used as the common skeleton and a compound was randomly selected as the cut template to acquire Ra (red), Rb (blue) and core (black) groups, as presented in Fig. 2. Other training molecules were certified automatically and cut as above. The q2 and r2 values were determined as 0.976 and 0.990, respectively. Statistical analyses validated the precise predictive predictability of the QSAR model of Topomer CoMFA. The root mean square error (RMSE) values calculated using Excel 2007 were 0.111 and 0.168 for the training and test sets, respectively. The difference in RMSE between the two sets was not significant, indicative of good external prediction ability of the model and no overfitting phenomenon.
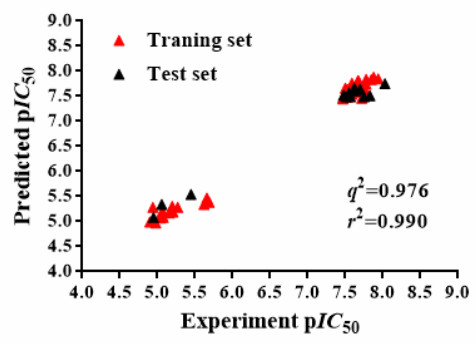
A graphical plot of the predicted versus experimental pIC50 values for all the compounds is presented in Fig. 3, and the corresponding data are specified in Table 2. Our results exhibited that the predicted values of the molecules were consistent with the experimental ones. Based on comparison of the fragment contribution values of Ra and Rb, we speculate that substitution of Ra has a greater impact on URAT1 inhibitory activity than the substitution of Rb.
 DownLoad:
CSV
DownLoad:
CSV
| No. | Exp.pIC50 | Pred.pIC50 | Res. | Ra contribution | Rb contribution |
| 1 | 4.98 | 4.97 | 0.01 | –0.34 | 0.00 |
| 2 | 4.90 | 4.99 | –0.09 | –0.34 | 0.03 |
| 3 | 5.08 | 5.08 | 0.00 | –0.34 | 0.11 |
| 4 | 5.08 | 5.18 | –0.10 | –0.34 | 0.21 |
| 5 | 5.20 | 5.30 | –0.10 | –0.38 | 0.37 |
| 6 | 5.62 | 5.34 | 0.28 | –0.34 | 0.37 |
| 7* | 5.06 | 5.34 | –0.28 | –0.34 | 0.20 |
| 8 | 5.04 | 5.07 | –0.03 | –0.61 | 0.37 |
| 9* | 4.95 | 5.08 | –0.13 | –0.34 | 0.12 |
| 10 | 5.16 | 5.17 | –0.01 | –0.15 | 0.00 |
| 11 | 5.21 | 5.19 | 0.02 | –0.15 | 0.03 |
| 12 | 5.27 | 5.28 | –0.01 | –0.15 | 0.11 |
| 13 | 5.69 | 5.38 | 0.31 | –0.15 | 0.21 |
| 14 | 5.66 | 5.47 | 0.19 | –0.15 | 0.30 |
| 15* | 5.45 | 5.54 | –0.09 | –0.15 | 0.37 |
| 16 | 5.05 | 5.16 | –0.11 | –0.15 | –0.00 |
| 17 | 4.94 | 5.28 | –0.34 | –0.15 | 0.12 |
| 18 | 7.47 | 7.47 | 0.00 | 2.15 | 0.00 |
| 19* | 7.57 | 7.49 | 0.08 | 2.15 | 0.03 |
| 20 | 7.56 | 7.58 | –0.02 | 2.15 | 0.11 |
| 21 | 7.59 | 7.76 | –0.17 | 2.15 | 0.30 |
| 22 | 7.68 | 7.70 | –0.02 | 2.15 | 0.23 |
| 23 | 7.78 | 7.84 | –0.06 | 2.15 | 0.37 |
| 24 | 7.60 | 7.62 | –0.02 | 2.15 | 0.15 |
| 25* | 7.64 | 7.61 | 0.03 | 2.15 | 0.15 |
| 26 | 7.71 | 7.62 | 0.09 | 2.15 | 0.16 |
| 27 | 7.54 | 7.62 | –0.08 | 2.15 | 0.15 |
| 28 | 7.47 | 7.45 | 0.02 | 2.15 | –0.01 |
| 29 | 7.72 | 7.46 | 0.26 | 2.15 | –0.00 |
| 30 | 7.62 | 7.58 | 0.04 | 2.15 | 0.12 |
| 31 | 7.56 | 7.60 | –0.04 | 2.15 | 0.14 |
| 32* | 7.55 | 7.57 | –0.02 | 2.15 | 0.10 |
| 33 | 7.50 | 7.56 | –0.06 | 2.15 | 0.10 |
| 34 | 7.68 | 7.80 | –0.12 | 2.15 | 0.34 |
| 35* | 7.51 | 7.49 | 0.02 | 2.18 | 0.00 |
| 36 | 7.62 | 7.64 | –0.02 | 2.18 | 0.15 |
| 37 | 7.76 | 7.64 | 0.12 | 2.18 | 0.15 |
| 38* | 7.70 | 7.64 | –0.06 | 2.18 | 0.16 |
| 39 | 7.53 | 7.64 | –0.11 | 2.18 | 0.15 |
| 40 | 7.53 | 7.48 | 0.05 | 2.18 | –0.01 |
| 41* | 7.75 | 7.49 | 0.26 | 2.18 | –0.00 |
| 42 | 7.69 | 7.60 | 0.09 | 2.18 | 0.12 |
| 43 | 7.64 | 7.62 | 0.02 | 2.18 | 0.14 |
| 44 | 7.59 | 7.59 | 0.00 | 2.18 | 0.10 |
| 45 | 7.58 | 7.59 | –0.01 | 2.18 | 0.10 |
| 46 | 7.85 | 7.83 | 0.02 | 2.18 | 0.34 |
| 47* | 7.48 | 7.52 | –0.04 | 2.20 | 0.00 |
| 48 | 7.59 | 7.54 | 0.05 | 2.20 | 0.03 |
| 49 | 7.55 | 7.62 | –0.07 | 2.20 | 0.11 |
| 50 | 7.67 | 7.81 | –0.14 | 2.20 | 0.30 |
| 51 | 7.78 | 7.74 | 0.04 | 2.20 | 0.23 |
| 52 | 7.88 | 7.88 | 0.00 | 2.20 | 0.37 |
| 53* | 7.62 | 7.66 | –0.04 | 2.20 | 0.15 |
| 54 | 7.73 | 7.66 | 0.07 | 2.20 | 0.15 |
| 55 | 7.71 | 7.67 | 0.04 | 2.20 | 0.16 |
| 56 | 7.50 | 7.66 | –0.16 | 2.20 | 0.15 |
| 57 | 7.48 | 7.50 | –0.02 | 2.20 | –0.01 |
| 58* | 7.83 | 7.51 | 0.32 | 2.20 | –0.00 |
| 59 | 7.74 | 7.63 | 0.11 | 2.20 | 0.12 |
| 60 | 7.67 | 7.65 | 0.02 | 2.20 | 0.14 |
| 61 | 7.62 | 7.61 | 0.01 | 2.20 | 0.10 |
| 62 | 7.59 | 7.61 | –0.02 | 2.20 | 0.10 |
| 63 | 7.94 | 7.85 | 0.09 | 2.20 | 0.34 |
| 64* | 8.03 | 7.75 | 0.28 | 2.20 | 0.24 |
| * Compounds belonging to the test set | |||||
Furthermore, the parameter rm2 proposed by Roy et al.[31] and the Golbraikh-Tropsha statistical method[24] were applied for external verification of the test set. The relevant formulae are as follows:
Eq. (3):
|
|
(R2: correlation coefficient between the activity test and predicted values)
Eq. (4):
|
|
(k: slope of the regression line between the experimental activity value (y-axis) and predicted value (x-axis) when the intercept is 0)
Eq. (5):
|
|
(k': slope of the regression line between the predicted activity value (y-axis) and experimental value (x-axis) when the intercept is 0)
Eq. (6):
|
|
(R02: correlation coefficient between the experimental activity value (y-axis) and predicted value (x-axis))
Eq. (7):
|
|
(R'02: correlation coefficient between the predicted activity value (y-axis) and experimental value (x-axis))
Eq. (8):
|
|
(rm2: statistics of the external prediction ability of the evaluation model proposed by Roy)
Eq. (9):
|
|
(r'm2: statistics of the external prediction ability of the evaluation model proposed by Roy)
Yobs: experimental value of the test sets
Ypred: predictive value of the test sets
Yobs: mean experimental value of the test sets
Yobs: mean predicted activity value of the test sets
All statistical parameters were within the ranges of the reference values, indicating that the model has sufficient prediction ability for external samples (Table 3).
DownLoad:
CSV
| Statistical parameter | Value | Reference value |
| R2 | 0.987 | > 0.6 |
| k | 1.007 | 0.85≤k≤1.15 |
| k' | 0.993 | 0.85≤k'≤1.15 |
| R02 | 0.998 | – |
| R'02 | 0.972 | – |
| rm2 | 0.891 | – |
| r'm2 | 0.867 | – |
| rm2 – r'm2 | 0.024 | < 0.2 |
| (rm2 + r'm2)/2 | 0.879 | > 0.5 |
| (R2 – R02)/R2 | 0.010 | (R2 – R02)/R2 < 0.1 |
| (R2 – R'02)/R2 | 0.015 | (R2 – R'02)/R2 < 0.1 |
To facilitate analyses, a molecule was randomly chosen as a reference for the 3D coefficient contour map. The results obtained using Topomer CoMFA models were graphically interpreted by field contribution maps. The calculated Topomer CoMFA steric and electrostatic contour maps are presented in Fig. 4.
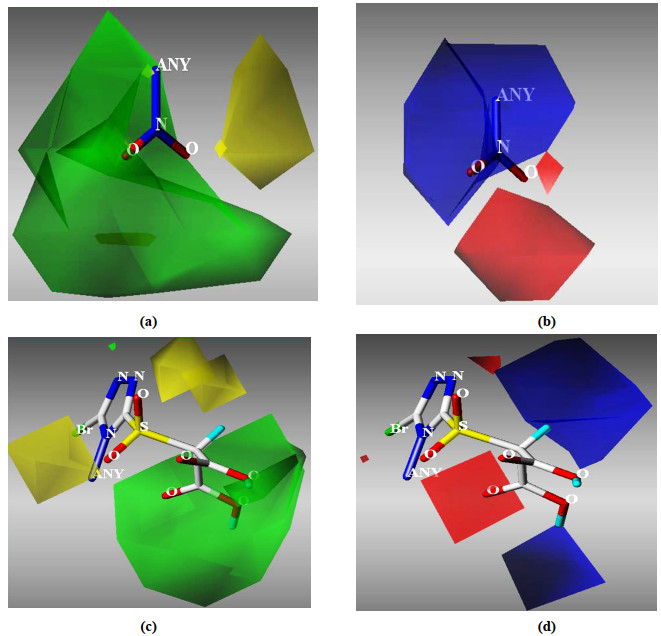
In the steric field, the green contours located at Ra showed a degree of closure, suggesting that only moderate bulky substituents would be favorable, and the yellow contours indicated that bulky substituents would not be tolerated (Fig. 4a). These features could account for the higher activity of compound 58 (pIC50 = 7.83) with -OCH3 as Ra and the relatively lower activities of compounds 59 (pIC50 = 7.74), 60 (pIC50 = 7.67) and 61 (pIC50 = 7.62) with -OCH2CH3, -OCH(CH3)2 and -OC(CH3)3 Ra groups, respectively, despite the same Rb for these compounds. In the electrostatic field (Fig. 4b), the advantage of electron-withdrawing groups is expressed by red contours of the R1 group and that of electrondonating substituents by blue contours. This phenomenon could explain the higher activity of compounds 64 (pIC50 = 8.03) and 63 (pIC50 = 7.94) with -NO2 and -CN as Ra, respectively, and lower activity of compound 52 (pIC50 = 7.88) with a -cyclopropyl Ra group.
As shown in Fig. 4c, Rb can be divided into two regions, specifically, a substituted triazole ring (triazole−R2) and long chain carboxyl group (R3). CH2-, S atom, sulphinyl and sulphonyl groups are commonly used for linkage between the triazole and carboxyl groups. The yellow contours located at the S atom of R3 suggested that oversized bridge linkage groups (larger than the sulphonyl group) would not be tolerated here. In fact, the activity of sulphonyl groups was generally higher than that of sulphinyl and single S atom groups, as observed for compounds 58 (pIC50 = 7.83), 41 (pIC50 = 7.75) and 29 (pIC50 = 7.72). Finally, the large green area and blue contours around the end of R3 indicate that the substituent of two carboxylic acids would be favorable in this region, as observed for compounds 23 (pIC50 = 7.78) and 6 (pIC50 = 5.62).
The SARs for URAT1 inhibitors summarized in Fig. 5 provide useful references for the optimization of current molecular activities and the design of effective inhibitors with novel scaffolds.
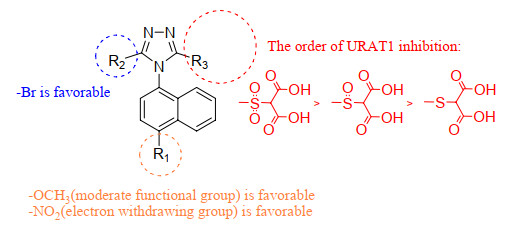
Based on intimate contour analyses of 3D-QSAR models and further SAR assessments, pivotal structural features of ligands beneficial for URAT1 inhibitory activity were included in the "naphthyl triazole" scaffold to design seven new URAT1 inhibitors a~g (Table 4). In these compounds, R3 was retained as "sulfinyl-two carboxyl" or "sulfonyl-two carboxyl" groups. The main alteration was substitution at the R1 group. For example, N(CH3)3- was introduced as an electron-donating group and CF3-, CN-, NO2-, Cl- and furan were introduced as electron-withdrawing groups. Similar modifications were introduced at the R2 group. The predicted IC50 values of the novel compounds using the Topomer CoMFA model and ADMET properties predicted with Discovery Studio 3.5 software are shown in Table 5. Notably, the predicted pIC50 values of these compounds were not markedly different from those of compound 64, supporting their potential as URAT1 inhibitors. Moreover, compounds a and c displayed higher water solubility than compound 64, and the absorption of all compounds, except c and f, was better. The efficacy of these compounds as URAT1 inhibitors will be validated in future experiments.
DownLoad:
CSV
 |
||||
| Compd. | Structure | Compd. | Structure | |
| a |  |
e |  |
|
| b |  |
f |  |
|
| c |  |
g |  |
|
| d |  |
|||
DownLoad:
CSV
| Compd. | Pred. IC50 (μM) | Solubility | Solubility _levela |
BBB_ levelb |
EXT_ CYP2D6c |
EXT_ Hepatotoxicd |
Absorption _levele |
EXT_ PPBf |
AlogP98 | PSA_2D |
| 64 | 0.018 | –4.267 | 2 | 4 | False | True | 3 | True | 2.143 | 181.527 |
| a | 0.024 | –3.014 | 3 | 4 | False | True | 1 | True | 0.961 | 138.704 |
| b | 0.019 | –5.349 | 2 | 4 | False | True | 2 | True | 3.191 | 138.704 |
| c | 0.016 | –3.711 | 3 | 4 | False | True | 3 | False | 1.579 | 204.462 |
| d | 0.025 | –4.367 | 2 | 4 | False | True | 1 | True | 2.708 | 121.403 |
| e | 0.023 | –4.714 | 2 | 4 | False | True | 2 | True | 2.804 | 138.704 |
| f | 0.018 | –4.847 | 2 | 4 | False | True | 3 | True | 2.871 | 151.258 |
| g | 0.019 | –4.519 | 2 | 4 | False | True | 1 | True | 2.775 | 133.957 |
| a0: practically insoluble, 1: very slightly soluble, 2: slightly soluble, 3: soluble, 4: freely soluble, 5: very soluble b0: very high permeability, 1: high permeability, 2: medium permeability, 3: low permeability, 4: not within the predicted range ctrue: CYP2D6 enzyme inhibitor, false: non-CYP2D6 enzyme inhibitor dtrue: with hepatotoxicity, false: without hepatotoxicity e0: high absorption, 1: moderate absorption, 2: low absorption, 3: very low absorption ftrue: > 90% plasma protein binding rate, false: < 90% plasma protein binding rate |
||||||||||
In this study, 3D-QSAR was employed to identify the structural determinants of URAT1 inhibitors. The high statistical values (q2 = 0.976; r2 = 0.990) support the Topomer CoMFA model with strong reliability and predictive ability. The results obtained using the 3D-QSAR models indicate that medium-sized electron-withdrawing groups are suitable for introduction into R1 and "sulfinyl-two carboxyl" or "sulfonyl-two carboxyl" groups appropriate for R3. Furthermore, seven novel compounds were designed with the predicted pIC50 and ADMET properties. In summary, the models developed using 3D-QSAR provide valuable information that should facilitate the design of efficient innovative URAT1 inhibitor compounds.
Perez-Ruiz, F.; Marimon, E.; Chinchilla, S. P. Hyperuricaemia with deposition: latest evidence and therapeutic approach. Ther. Adv. Musculoskelet Dis. 2015, 7, 225−233. doi: 10.1177/1759720X15599734
Punzi, L.; Scanu, A.; Ramonda, R.; Oliviero, F. Gout as autoinflammatory disease: new mechanisms for more appropriated treatment targets. Autoimmun Rev. 2012, 12, 66−71. doi: 10.1016/j.autrev.2012.07.024
Terkeltaub, R.; Bushinsky, D. A.; Becker, M. A. Recent developments in our understanding of the renal basis of hyperuricemia and the development of novel antihyperuricemic therapeutics. Arthritis Res. Ther. 2006, 8, 1−4.
Tan, P. K.; Farrar, J. E.; Gaucher, E. A.; Miner, J. N. Coevolution of URAT1 and uricase during primate evolution: implications for serum urate homeostasis and gout. Mol. Biol. Evol. 2016, 33, 2193−2200. doi: 10.1093/molbev/msw116
Forcet, C.; Stein, E.; Pays, L.; Corset, V.; Llambi, F.; Tessier-Lavigne, M.; Mehlen, P. Netrin-1 mediated axon outgrowth requires deleted in colorectal cancer-dependent MAPK activation. Nature 2002, 417, 443−447. doi: 10.1038/nature748
Hoy, S. M. Lesinurad: first global approval. Drugs 2016, 76, 509−516. doi: 10.1007/s40265-016-0550-y
Tan, P. K.; Liu, S.; Gunic, E.; Miner, J. N. Discovery and characterization of verinurad, a potent and specific inhibitor of URAT1 for the treatment of hyperuricemia and gout. Sci. Rep. 2017, 7, 665−676. doi: 10.1038/s41598-017-00706-7
Poiley, J.; Steinberg, A. S.; Choi, Y. J.; Davis, C. S.; Martin, R. L.; McWherter, C. A.; Boudes, P. F. A randomized, double-blind, active- and placebo-controlled efficacy and safety study of arhalofenate for reducing flare in patients with gout. Arthritis Rheumatol. 2016, 68, 2027−2034. doi: 10.1002/art.39684
Edwards, N. L.; So, A. Emerging therapies for gout. Rheum. Dis. Clin. N. Am. 2014, 40, 375−387. doi: 10.1016/j.rdc.2014.01.013
Mandal, A. K.; Mercado, A.; Foster, A.; Zandi-Nejad, K.; Mount, D. B. Uricosuric targets of tranilast. Pharmacol Res. Perspect. 2017, 5, 291−301.
Pan, Y.; Kong, L. D. Urate transporter URAT1 inhibitors: a patent review (2012-2015). Expert Opin. Ther. 2016, 26, 1129−1138. doi: 10.1080/13543776.2016.1213243
Peng, J.; Hu, Q.; Gu, C.; Liu, B.; Jin, F.; Yuan, J.; Feng, J.; Zhang, L.; Lan, J.; Dong, Q.; Cao, G. Discovery of potent and orally bioavailable inhibitors of human uric acid transporter 1 (hURAT1) and binding mode prediction using homology model. Bioorg. Med. Chem. Lett. 2016, 26, 277−282. doi: 10.1016/j.bmcl.2015.12.040
Cai, W.; Liu, W.; Zhang, S.; Wang, J.; Zhao, G. Design, synthesis and bioactivity of highly sterically congested flexible uric acid transporter 1 (URAT1) inhibitors. Chin. J. Org. Chem. 2017, 37, 2303−2314. doi: 10.6023/cjoc201704038
Tian, H.; Liu, W.; Zhou, Z.; Shang, Q.; Liu, Y.; Xie, Y.; Liu, C.; Xu, W.; Tang, L.; Wang, J.; Zhao, G. Discovery of a flexible triazolylbutanoic acid as a highly potent uric acid transporter 1 (URAT1) inhibitor. Molecules 2016, 21, 1543−1548. doi: 10.3390/molecules21111543
Cai, W.; Liu, W.; Xie, Y.; Wu, J.; Liu, Y.; Liu, C.; Xu, W.; Tang, L.; Wang, J.; Zhao, G. Design, synthesis and biological activity of tetrazole-bearing uric acid transporter 1 inhibitors. Chem. Res. Chin. U. 2017, 33, 49−60. doi: 10.1007/s40242-017-6351-3
Peng, J.; Hu, Q.; Gu, C.; Liu, B.; Jin, F.; Yuan, J.; Feng, J.; Zhang, L.; Lan, J.; Dong, Q. Discovery of potent and orally bioavailable inhibitors of human uric acid transporter 1 (hURAT1) and binding mode prediction using homology model. Bioorg. Med. Chem. Lett. 2016, 26, 277−282. doi: 10.1016/j.bmcl.2015.12.040
Cramer, R. D. Topomer CoMFA: a design methodology for rapid lead optimization. J. Med. Chem. 2003, 46, 374−388. doi: 10.1021/jm020194o
Xu, C.; Ren, Y. Molecular modeling studies of [6, 6, 5] tricyclic fused oxazolidinones as fxa inhibitors using 3D-QSAR, topomer CoMFA, molecular docking and molecular dynamics simulations. Bioorg. Med. Chem. Lett. 2015, 25, 4522−4528. doi: 10.1016/j.bmcl.2015.08.070
Halder, A. K.; Amin, S. A.; Jha, T.; Gayen, S. Insight into the structural requirements of pyrimidine-based phosphodiesterase 10A (PDE10A) inhibitors by multiple validated 3D-QSAR approaches. SAR QSAR Environ. Res. 2017, 28, 253−273. doi: 10.1080/1062936X.2017.1302991
Zhao, T. T.; Zhao, Z. A.; Lu, F. T.; Chang, S.; Zhang, J. J.; Pang, J. X.; Tian, Y. X. Two- and three-dimensional QSAR studies on hURAT1 inhibitors with flexible linkers: topomer CoMFA and HQSAR. Mol. Divers. 2019.https://doi.org/10.1007/s11030-019-09936-5 doi: 10.1007/s11030-019-09936-5
Leonard, J. T.; Roy, K. On Selection of training and test sets for the development of predictive QSAR models. QSAR Comb. Sci. 2006, 25, 235−251. doi: 10.1002/qsar.200510161
Li, S.; Li, M.; Chao, R.; Dong, C.; Jun, M.; Jing, C.; Tai, L.; Qing, L. 3D-QSAR studies on 4-([1, 2, 4]triazolo[1, 5-α]pyridin-6-yl)-5(3)-(6-methylpyridin-2-yl)imidazole analogues as potent inhibitors of transforming growth factor-β typeⅠreceptor kinase. Chin. J. Struct. Chem. 2018, 37, 517−530.
Xiao, C.; Yu, M.; Zhong, Z.; Ling, Z.; Ying, L. Molecular docking, 3D-QSAR and molecular dynamics simulation studies of substituted pyrimidines as selective covalent janus kinase 3 inhibitors. Chin. J. Struct. Chem. 2018, 37, 839−853.
Lu, W.; Yan, Z.; Shuai, L.; Ya, C.; Tao, L.; Hai, L. Molecular docking and 3D-QSAR studies on a series of fused heterocyclic amides as B-Raf inhibitors. Chin. J. Struct. Chem. 2017, 36, 1568−1585.
Xiang, Y.; Hou, Z.; Zhang, Z. Pharmacophore and qsar studies to design novel histone deacetylase 2 inhibitors. Chem. Biol. Drug Des. 2012, 79, 760−770. doi: 10.1111/j.1747-0285.2012.01341.x
Yang, Q.; Zhang, S. P.; Zhao, S. P. 3D-QSAR studies on a series of indoleamide derivatives as antiplasmodial drugs. Chin. J. Struct. Chem. 2018, 37, 1015−1024.
Cramer, R. D. 3rd. Patterson, D. E.; Bunce, J. D. Recent advances in comparative molecular field analysis (CoMFA). Pro. Clin. Biol. Res. 1989, 291, 161−165.
Golbraikh, A.; Tropsha, A. Beware of q2. J. Mol. Grap. Model. 2002, 20, 269−276. doi: 10.1016/S1093-3263(01)00123-1
Vrontaki, E.; Melagraki, G.; Mavromoustakos, T.; Afantitis, A. Searching for anthranilic acid-based thumb pocket 2 HCV NS5B polymerase inhibitors through a combination of molecular docking, 3D-QSAR and virtual screening. J. Enzym Inhib. Med. Ch. 2016, 31, 38−52.
Hao, C. Z.; Xia, S. W.; Wang, H.; Xue, J.; Yu, L. M. Using 3D-QSAR and molecular docking insight into inhibitors binding with complex-associated kinases CDK8. J. Mol. Struct. 2018, 1173, 498−511. doi: 10.1016/j.molstruc.2018.05.072
Roy, K.; Kar, S. The rm2 metrics and regression through origin approach: reliable and useful validation tools for predictive QSAR models (commentary on 'is regression through origin useful in external validation of QSAR models?'). Eur. J. Pharm. Sci. 2014, 62, 111−114. doi: 10.1016/j.ejps.2014.05.019

Figure 3 Scatter plot of experimental versus predicted pIC50 values of the training and test sets in our 3D-QSAR model using Topomer CoMFA

Figure 4 Topomer CoMFA contour maps for URAT1 inhibitors. (a) and (b) depict steric and electrostatic field maps of the Ra fragment, respectively; (c) and (d) depict steric and electrostatic field maps of the Rb fragment

Figure 5 Important structural requirements of lesinurad-based analogues determined via ligand-based 3D-QSAR
Table 1. Chemical Structures and IC50 Values of URAT1 Inhibitors
|
|||||
| No. | R1 | R2 | R3 | IC50(μM) | Exp.pIC50 |
| 1 | -H | -Br | |
10.50 | 4.98 |
| 2 | -CH3 | -Br | |
12.60 | 4.90 |
| 3 | -CH2CH3 | -Br | |
8.40 | 5.08 |
| 4 | -(CH2)2CH3 | -Br | |
8.30 | 5.08 |
| 5 | |
-Cl | |
6.30 | 5.20 |
| 6 | |
-Br | |
2.40 | 5.62 |
| 7* | |
-I | |
8.80 | 5.06 |
| 8 | |
-OCH2CH3 | |
9.10 | 5.04 |
| 9* | -OCH2CH3 | -Br | |
11.20 | 4.95 |
| 10 | -H | -Br | |
6.87 | 5.16 |
| 11 | -CH3 | -Br | |
6.16 | 5.21 |
| 12 | -CH2CH3 | -Br | |
5.37 | 5.27 |
| 13 | -(CH2)2CH3 | -Br | |
2.03 | 5.69 |
| 14 | -CH(CH3)2 | -Br | |
2.21 | 5.66 |
| 15* | |
-Br | |
3.52 | 5.45 |
| 16 | -OCH3 |
-Br | |
8.90 | 5.05 |
| 17 | -OCH2CH3 | -Br | |
11.49 | 4.94 |
| 18 | -H | -Br | |
0.0338 | 7.47 |
| 19* | -CH3 | -Br | |
0.0267 | 7.57 |
| 20 | -CH2CH3 | -Br | |
0.0274 | 7.56 |
| 21 | -CH(CH3)2 | -Br | |
0.0259 | 7.59 |
| 22 | -C(CH3)3 | -Br | |
0.0211 | 7.68 |
| 23 | |
-Br | |
0.0165 | 7.78 |
| 24 | -F | -Br | |
0.0251 | 7.60 |
| 25* | -Cl | -Br | |
0.0228 | 7.64 |
| 26 | -Br | -Br | |
0.0197 | 7.71 |
| 27 | -I | -Br | |
0.029 | 7.54 |
| 28 | -OH |
-Br | |
0.0341 | 7.47 |
| 29 | -OCH3 |
-Br | |
0.0192 | 7.72 |
| 30 | -OCH2CH3 | -Br | |
0.024 | 7.62 |
| 31 | -OCH(CH3)2 | -Br | |
0.0275 | 7.56 |
| 32* | -OC(CH3)3 | -Br | |
0.0283 | 7.55 |
| 33 | |
-Br | |
0.0316 | 7.50 |
| 34 | -CN | -Br | |
0.0209 | 7.68 |
| 35* | -H | -Br | |
0.0307 | 7.51 |
| 36 | -F | -Br | |
0.0241 | 7.62 |
| 37 | -Cl | -Br | |
0.0173 | 7.76 |
| 38* | -Br | -Br | |
0.0209 | 7.70 |
| 39 | -I | -Br | |
0.0294 | 7.53 |
| 40 | -OH |
-Br | |
0.0295 | 7.53 |
| 41* | -OCH3 |
-Br | |
0.0177 | 7.75 |
| 42 | -OCH2CH3 | -Br | |
0.0206 | 7.69 |
| 43 | -OCH(CH3)2 | -Br | |
0.0231 | 7.64 |
| 44 | -OC(CH3)3 | -Br | |
0.0258 | 7.59 |
| 45 | |
-Br | |
0.0262 | 7.58 |
| 46 | -CN | -Br | |
0.0140 | 7.85 |
| 47* | -H | -Br | |
0.0328 | 7.48 |
| 48 | -CH3 | -Br | |
0.0257 | 7.59 |
| 49 | -CH2CH3 | -Br | |
0.0282 | 7.55 |
| 50 | -CH(CH3)2 | -Br | |
0.0215 | 7.67 |
| 51 | -C(CH3)3 | -Br | |
0.0167 | 7.78 |
| 52 | |
-Br | |
0.0131 | 7.88 |
| 53* | -F | -Br | |
0.0239 | 7.62 |
| 54 | -Cl | -Br | |
0.0186 | 7.73 |
| 55* | -Br | -Br | |
0.0194 | 7.71 |
| 56 | -I | -Br | |
0.0317 | 7.50 |
| 57 | -OH |
-Br | |
0.0328 | 7.48 |
| 58* | -OCH3 |
-Br | |
0.0149 | 7.83 |
| 59 | -OCH2CH3 | -Br | |
0.0181 | 7.74 |
| 60 | -OCH(CH3)2 | -Br | |
0.0215 | 7.67 |
| 61 | -OC(CH3)3 | -Br | |
0.0242 | 7.62 |
| 62 | |
-Br | |
0.0257 | 7.59 |
| 63 | -CN | -Br | |
0.0116 | 7.94 |
| 64* | -NO2 | -Br | |
0.0094 | 8.03 |
| *Compounds belonging to the test set | |||||
 下载: 导出CSV
Table 2. Experimental and Predicted pIC50 Values of URAT1 Inhibitors with Ra and Rb Fragment Contributions
| No. | Exp.pIC50 | Pred.pIC50 | Res. | Ra contribution | Rb contribution |
| 1 | 4.98 | 4.97 | 0.01 | –0.34 | 0.00 |
| 2 | 4.90 | 4.99 | –0.09 | –0.34 | 0.03 |
| 3 | 5.08 | 5.08 | 0.00 | –0.34 | 0.11 |
| 4 | 5.08 | 5.18 | –0.10 | –0.34 | 0.21 |
| 5 | 5.20 | 5.30 | –0.10 | –0.38 | 0.37 |
| 6 | 5.62 | 5.34 | 0.28 | –0.34 | 0.37 |
| 7* | 5.06 | 5.34 | –0.28 | –0.34 | 0.20 |
| 8 | 5.04 | 5.07 | –0.03 | –0.61 | 0.37 |
| 9* | 4.95 | 5.08 | –0.13 | –0.34 | 0.12 |
| 10 | 5.16 | 5.17 | –0.01 | –0.15 | 0.00 |
| 11 | 5.21 | 5.19 | 0.02 | –0.15 | 0.03 |
| 12 | 5.27 | 5.28 | –0.01 | –0.15 | 0.11 |
| 13 | 5.69 | 5.38 | 0.31 | –0.15 | 0.21 |
| 14 | 5.66 | 5.47 | 0.19 | –0.15 | 0.30 |
| 15* | 5.45 | 5.54 | –0.09 | –0.15 | 0.37 |
| 16 | 5.05 | 5.16 | –0.11 | –0.15 | –0.00 |
| 17 | 4.94 | 5.28 | –0.34 | –0.15 | 0.12 |
| 18 | 7.47 | 7.47 | 0.00 | 2.15 | 0.00 |
| 19* | 7.57 | 7.49 | 0.08 | 2.15 | 0.03 |
| 20 | 7.56 | 7.58 | –0.02 | 2.15 | 0.11 |
| 21 | 7.59 | 7.76 | –0.17 | 2.15 | 0.30 |
| 22 | 7.68 | 7.70 | –0.02 | 2.15 | 0.23 |
| 23 | 7.78 | 7.84 | –0.06 | 2.15 | 0.37 |
| 24 | 7.60 | 7.62 | –0.02 | 2.15 | 0.15 |
| 25* | 7.64 | 7.61 | 0.03 | 2.15 | 0.15 |
| 26 | 7.71 | 7.62 | 0.09 | 2.15 | 0.16 |
| 27 | 7.54 | 7.62 | –0.08 | 2.15 | 0.15 |
| 28 | 7.47 | 7.45 | 0.02 | 2.15 | –0.01 |
| 29 | 7.72 | 7.46 | 0.26 | 2.15 | –0.00 |
| 30 | 7.62 | 7.58 | 0.04 | 2.15 | 0.12 |
| 31 | 7.56 | 7.60 | –0.04 | 2.15 | 0.14 |
| 32* | 7.55 | 7.57 | –0.02 | 2.15 | 0.10 |
| 33 | 7.50 | 7.56 | –0.06 | 2.15 | 0.10 |
| 34 | 7.68 | 7.80 | –0.12 | 2.15 | 0.34 |
| 35* | 7.51 | 7.49 | 0.02 | 2.18 | 0.00 |
| 36 | 7.62 | 7.64 | –0.02 | 2.18 | 0.15 |
| 37 | 7.76 | 7.64 | 0.12 | 2.18 | 0.15 |
| 38* | 7.70 | 7.64 | –0.06 | 2.18 | 0.16 |
| 39 | 7.53 | 7.64 | –0.11 | 2.18 | 0.15 |
| 40 | 7.53 | 7.48 | 0.05 | 2.18 | –0.01 |
| 41* | 7.75 | 7.49 | 0.26 | 2.18 | –0.00 |
| 42 | 7.69 | 7.60 | 0.09 | 2.18 | 0.12 |
| 43 | 7.64 | 7.62 | 0.02 | 2.18 | 0.14 |
| 44 | 7.59 | 7.59 | 0.00 | 2.18 | 0.10 |
| 45 | 7.58 | 7.59 | –0.01 | 2.18 | 0.10 |
| 46 | 7.85 | 7.83 | 0.02 | 2.18 | 0.34 |
| 47* | 7.48 | 7.52 | –0.04 | 2.20 | 0.00 |
| 48 | 7.59 | 7.54 | 0.05 | 2.20 | 0.03 |
| 49 | 7.55 | 7.62 | –0.07 | 2.20 | 0.11 |
| 50 | 7.67 | 7.81 | –0.14 | 2.20 | 0.30 |
| 51 | 7.78 | 7.74 | 0.04 | 2.20 | 0.23 |
| 52 | 7.88 | 7.88 | 0.00 | 2.20 | 0.37 |
| 53* | 7.62 | 7.66 | –0.04 | 2.20 | 0.15 |
| 54 | 7.73 | 7.66 | 0.07 | 2.20 | 0.15 |
| 55 | 7.71 | 7.67 | 0.04 | 2.20 | 0.16 |
| 56 | 7.50 | 7.66 | –0.16 | 2.20 | 0.15 |
| 57 | 7.48 | 7.50 | –0.02 | 2.20 | –0.01 |
| 58* | 7.83 | 7.51 | 0.32 | 2.20 | –0.00 |
| 59 | 7.74 | 7.63 | 0.11 | 2.20 | 0.12 |
| 60 | 7.67 | 7.65 | 0.02 | 2.20 | 0.14 |
| 61 | 7.62 | 7.61 | 0.01 | 2.20 | 0.10 |
| 62 | 7.59 | 7.61 | –0.02 | 2.20 | 0.10 |
| 63 | 7.94 | 7.85 | 0.09 | 2.20 | 0.34 |
| 64* | 8.03 | 7.75 | 0.28 | 2.20 | 0.24 |
| * Compounds belonging to the test set | |||||
下载: 导出CSV
Table 3. Statistical Parameters for External Validation of the QSAR Model
| Statistical parameter | Value | Reference value |
| R2 | 0.987 | > 0.6 |
| k | 1.007 | 0.85≤k≤1.15 |
| k' | 0.993 | 0.85≤k'≤1.15 |
| R02 | 0.998 | – |
| R'02 | 0.972 | – |
| rm2 | 0.891 | – |
| r'm2 | 0.867 | – |
| rm2 – r'm2 | 0.024 | < 0.2 |
| (rm2 + r'm2)/2 | 0.879 | > 0.5 |
| (R2 – R02)/R2 | 0.010 | (R2 – R02)/R2 < 0.1 |
| (R2 – R'02)/R2 | 0.015 | (R2 – R'02)/R2 < 0.1 |
下载: 导出CSV
Table 4. Structures of Newly Designed Molecules a~g
|
||||
| Compd. | Structure | Compd. | Structure | |
| a | |
e | |
|
| b | |
f | |
|
| c | |
g | |
|
| d | |
|||
下载: 导出CSV
Table 5. Predicted IC50 Values and ADMET Properties of the Newly Designed Molecules a~g
| Compd. | Pred. IC50 (μM) | Solubility | Solubility _levela |
BBB_ levelb |
EXT_ CYP2D6c |
EXT_ Hepatotoxicd |
Absorption _levele |
EXT_ PPBf |
AlogP98 | PSA_2D |
| 64 | 0.018 | –4.267 | 2 | 4 | False | True | 3 | True | 2.143 | 181.527 |
| a | 0.024 | –3.014 | 3 | 4 | False | True | 1 | True | 0.961 | 138.704 |
| b | 0.019 | –5.349 | 2 | 4 | False | True | 2 | True | 3.191 | 138.704 |
| c | 0.016 | –3.711 | 3 | 4 | False | True | 3 | False | 1.579 | 204.462 |
| d | 0.025 | –4.367 | 2 | 4 | False | True | 1 | True | 2.708 | 121.403 |
| e | 0.023 | –4.714 | 2 | 4 | False | True | 2 | True | 2.804 | 138.704 |
| f | 0.018 | –4.847 | 2 | 4 | False | True | 3 | True | 2.871 | 151.258 |
| g | 0.019 | –4.519 | 2 | 4 | False | True | 1 | True | 2.775 | 133.957 |
| a0: practically insoluble, 1: very slightly soluble, 2: slightly soluble, 3: soluble, 4: freely soluble, 5: very soluble b0: very high permeability, 1: high permeability, 2: medium permeability, 3: low permeability, 4: not within the predicted range ctrue: CYP2D6 enzyme inhibitor, false: non-CYP2D6 enzyme inhibitor dtrue: with hepatotoxicity, false: without hepatotoxicity e0: high absorption, 1: moderate absorption, 2: low absorption, 3: very low absorption ftrue: > 90% plasma protein binding rate, false: < 90% plasma protein binding rate |
||||||||||
下载: 导出CSV

 扫一扫看文章

扫一扫关注我们

