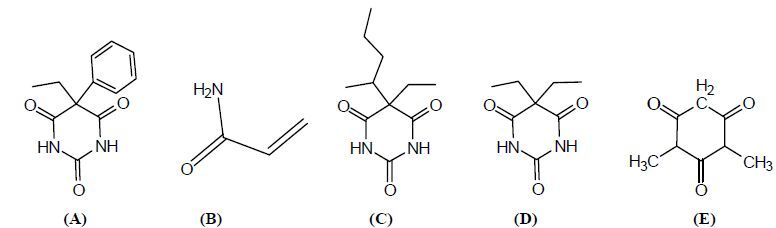
Figure 1.
Chemistry structures of PHN (A), AM (B), PNT (C), BAR (D), and DMBA (E)
Computer Simulation and Experimental Investigations of Phenobarbital Molecular Imprinting System
Jun-Bo LIU , Shan-Shan TANG , Zheng-Qiang DAI , Yan WANG , Qian GAO , Rui-Fa JIN

The molecular Imprinting technique added the template into the polymeric materials to construct the selective binding sites in the molecular impRinted polymers (MIPs). Thus the MIPs had a broad range of applications[1-4] as they owned selective recognition ability for the Imprinting molecules. While the functional monomers were the keys to synthesize high selective MIPs, the selection of functional monomers and the optimization of molar ratios for template with the functional monomers became a hot topic of research in the field of MIPs. At present, computer simulation has been used to replace some parts of experiments to improve the experimental efficiency[5-8], such as the optimization of functional monomers, solvents, and molar ratios. It not only reduced the blindness of synthesis, but also reduced the consumption for experiments.
Phenobarbital (PHN) was abused for the animal feed additives accelerating the growth of animal. However, the animal food like this might contain carcinogen and teratogen[9]. The general detection methods need separate the PHN from the mixed samples through the pretreatment process. There were lots of interference factors and these detection methods lacked of selective adsorption materials. MIPs belonged to the better selective adsorption material owning to their specific adsorption for targets. In the past, the synthesis of PHN-MIPs mainly adopted the two-step swelling method and the particle size of polymers was at the micro level[10, 11]. In contrast, the nano-MIPs possess large surface area, high adsorption capacity, and selectivity[12].
In current researches, methacrylic acid (MAA)[13-15] was the most common functional monomer for the preparation of MIPs, nonetheless, several researches using acrylamide (AM)[16, 17] as functional monomer also showed good Imprinting effect. In addition, there are no reports of establishing the molecular methods of PHN and AM at the molecular levels to simulate the interaction between them. Here, the molecular Imprinting system com- posed of PHN and AM was studied at the M062X/6- 31g (d, p) level. The active reaction sites of PHN and AM were researched with the help of molecular electrostatic potential (MEP). We also discussed the configuration, bonding situation, and reactive binding energy of the stable complexes. The nature action and interacting mechanism of PHN and AM were characterized subsequently, and the optimization of molar ratios for the template with the functional monomers was also analyzed. On the basis of the theoretical calculation results, the nano-MIPs were synthesized by the precipitation polymerization and characterized via adsorption experiments.
PHN, pentobarbital (PNT), barbital (BAR), and 1, 3-dimethylbarbituric acid (DMBA) were purchased from Chinese control of pharmaceutical and biological products (Beijing, China), Shanghai Pubos Biological Technology Inc (Beijing, China), Shanghai Pan Ke Biological Technology Inc (Shanghai, China), and Chengdu Gray Asia Chemical Technology Inc (Chengdu, China), respectively. The purity was over 98%. AM was obtained from Sinopharm Chemical Reagent Co. Ltd. (Beijing, China). The chemistry structures of PHN, AM, PNT, BAR, and DMBA are shown in Fig. 1. Ethylene glycol dimethacrylate (EGDMA) was bought from Shanghai Jing pure reagent Inc (Shanghai, China). Azobisisobutyronitrile (AIBN) was purchased from Tianjin Guangfu fine Chemical Research Institute (Tianjin, China). Acetonitrile (ACN), methanol, and acetic acid were the products of Fuchen Chemical Reagent Factory (Tianjin, China). All reagents were of analytical grade except PHN, BAR, PNT, and DMBA.
The constant temperature environment for the fabrication of PHN-MIPs was provided with a THZ-82A constant temperature oscillator purchased from Jintan medical instrument factory (Jintan, China). Scanning electron microscopy (SEM) images of the PHN-MIPs microspheres were carried out on a JSM-5600 Scanning Electron Microscope obtained from Japan JEOL Electronics Corporation (Tokyo, Japan). The DZF-6062 vacuum drying box purchased from Shanghai Hengke Instrument Inc. (Shanghai, China) was used to dry the polymers. The absorbance value was measured via a TU-1901 double beam UV spectrophotometer obtained from Beijing Purkinje General Instrument (Beijing, China).
The geometry structures of PHN and AM were optimized and their molecular orbitals were calculated at the M062X/6-31G (d, p) level with the Gaussian 09 software[18]. Adopting the self-consistent reaction field (SCRF) approach with the polarizable continuum model (PCM), we simulated the interaction process between the PHN and AM in the acetonitrile solvent at 333 K. To reveal the impRinted mechanism, we calculated the electron densities (ρ(r)) and the laplacians (▽2ρ(r)) of all action sites by the atoms in molecules theory[19]. The counter poise (CP) was employed to eliminate the basis set superposition error (BSSE) for calculating the binding energy. Finally, the binding energy (ΔEbinding) was calculated through the equation (1) as follows:
|
|
In the equation, ΔEbinding is the binding energy between PHN and AM. Ecompelx, EPHN, and EAM are the single point energy of PHN-AM complexes, PHN, and AM, respectively.
1 mmol of PHN and 0.6 mmol of AM were first dissolved into a round-bottomed flask containing 40 mL of ACN. The mixture solution was stewed at room temperature for 24 h to make the PHN react with AM completely. The EGDMA (3.0 mmol) and AIBN (0.050 g) were added into the above solution. This solution was then processed for 15 min via ultrasound and purged with nitrogen to remove the oxygen. At last the flask was sealed and immersed into the constant temperature (333 K) water bath for 48 h. The MIPs were collected through centrifugation and elution. The methanol/acetic acid (8/2, v/v) mixture was used as the elution solvent. In contrast, the non-impRinted microspheres (NIPs) were prepared as a blank sample under the same procedure only without the addition of PHN.
20 mg of MIPs (NIPs) was added into an Erlenmeyer flask containing 10 mL of PHN methanol solution, and the concentration of this solution was 100 mg/L. The mixture was slightly shaken in a constant temperature (298 K) oscillator for 20 h. After the centrifugation of the mixture, the supernatant was filtered through the membrane filter (0.22 μm). The absorbance value of the filtrate was measured by ultraviolet-visible spectrophotometer determination. The equilibrium adsorption quantity (Q, mg/g) of MIPs (NIPs) to PHN was calculated according to the following Eq. 2:
|
|
where Q is the maximum adsorption capacity (mg/g), and C0 (mg/L) and C (mg/L) are the initial and equilibrium concentration of PHN, respectively. V (mL) is used to describe the total volume of the solution, and W (mg) to describe the weight of MIPs (NIPs).
20 mg of MIPs (NIPs) was added into an Erlenmeyer flask containing 10 mL PHN or its analogues (PNT, BAR, and DMBA) methanol solution, in which the concentration of this solution was 100 mg/L. The Erlenmeyer flasks were emerged and shaken in a water bath oscillator for 20 h at 298 K. The concentrations of PHN, PNT, BAR, and DMBA in the filtrate were measured using the ultravioletvisible spectrophotometer after adsorption experiments. The selectivity property of MIPs (NIPs) to targets was evaluated depending on the adsorption quantity.
A mass of 20 mg MIPs was placed in an Erlenmeyer flask containing 10 mL PHN methanol solution at a concentration of 100 mg/L. The mixture was incubated for 20 h at 293, 303, and 313 K, respectively. The calculation step of adsorption quantity was the same as the "Adsorption experiments" section. The MIPs should be recycled and washed with the methanol/acetic acid (8/2, v/v) mixture solution to remove the PHN. The repeated utilization rate and service life of MIPs at different temperature can be researched through evaluating the adsorption quantity of the recycled MIPs to PHN.
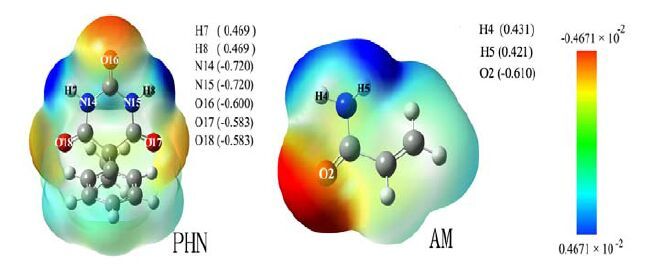
The molecular electrostatic potential (MEP) maps generally can provide information to study the relationship between the structure and activity. In the color scheme of MEP, the preferred site for electrophilic attack symptoms in the negative region was in red color; while that for nucleophilic attack indications in the positive region was in blue color. The MEP surfaces of PHN and AM under investigation were constructed by using the M062X/6-31G (d, p) method. From Fig. 2, one can find that atoms H (7) and H (8) of PHN hold significant positive charges, which serve as the proton donor. The atoms N (14), N (15), O (16), O (17), and O (18 ) of PHN hold obvious negative charges, which act as the proton acceptor. Similarly, for AM, atoms H (4) and H (5) hold signi- ficant positive charges, which are the proton donor. The atom O (2) holds obvious negative charge, which is the proton acceptor.
The interaction process between the template molecule and functional monomer in different molar ratios was performed on the basis of the distribution of molecular electrostatic potential. The most stable complexes were regarded as the research objects and cheered out depending on the interaction sites. The models of PHN-AM complexes in different molar ratios (1:1, 1:2, 1:3, 1:4, 1:5, and 1:6) are shown in Fig. 3. The relevant parameters of the molecular Imprinting systems of PHN and AM are listed in Table 1. As shown in Fig. 3, the numbers of their reaction sites are 2, 4, 5, 6, and 7, respectively. The order of the binding energy for complexes is ΔE1:1 > ΔE1:2 > ΔE1:3 > ΔE1:4 > ΔE1:5 > ΔE1:6 (Table 1). The results indicate that the stabilities of PHN-AM complexes increase gradually along with the molar ratios. When the molar ratio is 1:7, the functional monomers begin to self-polymerize because of the steric hindrance effect. Thus the number of reaction sites of the complex (1:7) decreases to 6. Namely, the complex (1:6) owns the highest stability and is expected to prepare MIPs with high stability and selectivity proprieties. We also optimized the complex of two AM molecules to react with the same active site of the PHN molecule. The calculated results are shown in Fig. S1 and Table S1 (Supporting Information). The results indicate that the complex only forms three hydrogen bonds when two AM molecules react with the same active site of the PHN molecule due to the space hindrance, and the hydrogen bonds are longer, the binding energy is larger, and the complex is less stable than the complex of two AM molecules reacting with the different active site of the PHN molecule.
The interaction mechanism between PHN and AM was studied by means of the electronic density topological methods. The values of ρ(r) and ▽2ρ(r) of all action sites (Table 1) are in the ranges of 0.0105 ~ 0.0374 and 0.0325 ~ 0.1172 a.u., respectively. All of the values are in line with the criteria for ordinary hydrogen bonds proposed by Popelie[21]. Thereby, the PHN mainly interacts with AM via hydrogen bonds.
 DownLoad:
CSV
DownLoad:
CSV
| N(32)–H(33)⋅⋅⋅O(16) | 0.1968 | 0.0261 | 0.0836 | ||
| 1:2 | O(31)⋅⋅⋅H(8)–N(15) | 0.1735 | 0.0361 | 0.1133 | –100.2 |
| N(32)–H(33)⋅⋅⋅O(16) | 0.1967 | 0.0263 | 0.0826 | ||
| O(41)⋅⋅⋅H(7)–N(14) | 0.1731 | 0.0363 | 0.1139 | ||
| N(42)–H(43)⋅⋅⋅O(18) | 0.1966 | 0.0267 | 0.0858 | ||
| 1:3 | O(31)…H(8)–N(15) | 0.18 | 0.0305 | 0.0929 | –141.2 |
| N(32)–H(33)⋅⋅⋅O(17) | 0.2092 | 0.0211 | 0.0655 | ||
| O(41)⋅⋅⋅H(7)–N(14) | 0.1734 | 0.0365 | 0.1145 | ||
| N(42)–H(43)⋅⋅⋅O(18) | 0.1955 | 0.0265 | 0.0829 | ||
| N(52)–H(53)⋅⋅⋅O(16) | 0.2145 | 0.0212 | 0.0628 | ||
| 1:4 | O(31)⋅⋅⋅H(8)–N(15) | 0.1778 | 0.0328 | 0.1002 | –180.3 |
| N(32)–H(33)⋅⋅⋅O(17) | 0.211 | 0.019 | 0.0591 | ||
| O(41)⋅⋅⋅H(7)–N(14) | 0.1768 | 0.0346 | 0.1092 | ||
| N(42)–H(43)⋅⋅⋅O(18) | 0.1971 | 0.026 | 0.0803 | ||
| N(52)–H(53)⋅⋅⋅O(16) | 0.2195 | 0.0197 | 0.0584 | ||
| N(62)–H(63)⋅⋅⋅O(16) | 0.2173 | 0.0137 | 0.0494 | ||
| 1:5 | O(31)⋅⋅⋅H(8)–N(15) | 0.1751 | 0.0341 | 0.1045 | –218.7 |
| N(32)–H(33)⋅⋅⋅O(17) | 0.206 | 0.0193 | 0.0597 | ||
| O(41)⋅⋅⋅H(7)–N(14) | 0.1759 | 0.0348 | 0.1097 | ||
| N(42)–H(43)⋅⋅⋅O(18) | 0.1972 | 0.0261 | 0.0815 | ||
| N(52)–H(53)⋅⋅⋅O(16) | 0.2078 | 0.0192 | 0.0566 | ||
| N(62)–H(63)⋅⋅⋅O(16) | 0.2182 | 0.0134 | 0.0483 | ||
| N(72)–H(73)⋅⋅⋅O(17) | 0.2026 | 0.0234 | 0.0749 | ||
| 1:6 | O(31)⋅⋅⋅H(8)–N(15) | 0.1763 | 0.0343 | 0.105 | –249.1 |
| N(32)–H(33)⋅⋅⋅O(17) | 0.2089 | 0.0194 | 0.0599 | ||
| O(41)⋅⋅⋅H(7)–N(14) | 0.175 | 0.0359 | 0.1131 | ||
| N(42)–H(43)⋅⋅⋅O(18) | 0.1986 | 0.0249 | 0.0772 | ||
| O(51)⋅⋅⋅H(23)–C(20) | 0.2247 | 0.0196 | 0.0548 | ||
| N(52)–H(53)⋅⋅⋅O(16) | 0.209 | 0.0185 | 0.0547 | ||
| N(62)–H(63)⋅⋅⋅O(16) | 0.2215 | 0.013 | 0.0472 | ||
| N(72)–H(73)⋅⋅⋅O(17) | 0.2058 | 0.0228 | 0.0733 | ||
| O(81)⋅⋅⋅H(25)–C(21) | 0.2326 | 0.0194 | 0.0553 | ||
| N(82)–H(83)⋅⋅⋅O(18) | 0.198 | 0.0211 | 0.071 | ||
| 1:7 | O(31)⋅⋅⋅H(8)–N(15) | 0.1896 | 0.0285 | 0.0849 | –321.3 |
| N(32)–H(33)⋅⋅⋅O(17) | 0.2021 | 0.0219 | 0.067 | ||
| O(41)⋅⋅⋅H(7)–N(14) | 0.1784 | 0.0362 | 0.1141 | ||
| N(42)–H(43)⋅⋅⋅O(18) | 0.1916 | 0.0265 | 0.0822 | ||
| N(72)–H(73)⋅⋅⋅O(17) | 0.2046 | 0.0105 | 0.0325 | ||
| Notes: The H(7), H(8), N(14), N(15), O(16), O(17), and O(18) represent the atoms of PHN, and the others represent the atoms of AM | |||||
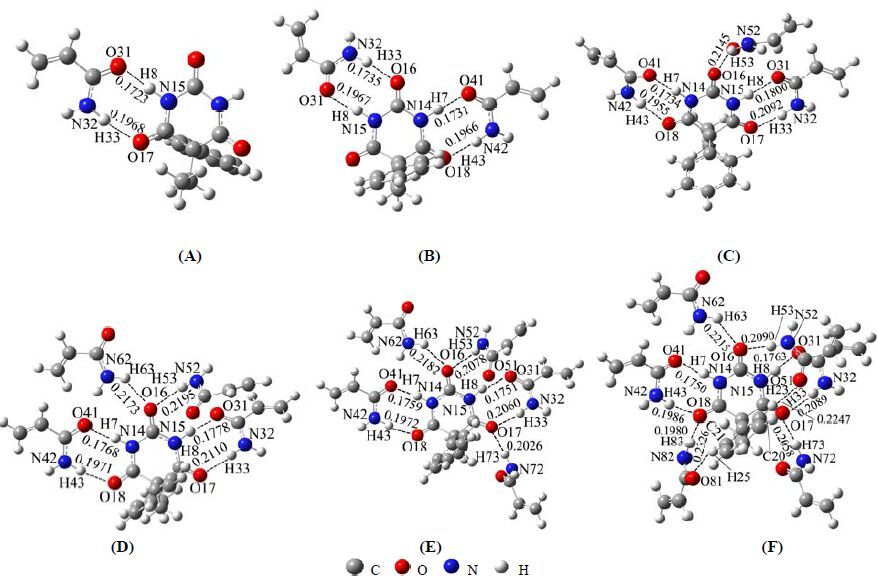
As shown in Fig. 3F, the reaction sites and hydrogen bond lengths (in parentheses) of PHN-AM complex (1:6) are O (31)⋅⋅⋅H (8)-N (15) (0.1763 nm), O (32)-H (33)⋅⋅⋅O (17) (0.2089 nm), O (41)⋅⋅⋅H (7)-N (14) (0.1750 nm), O (42)-H (43)⋅⋅⋅O (18) (0.1986 nm), O (51)⋅⋅⋅H (23)-C (20) (0.2247 nm), O (52)-H (53)⋅⋅⋅ O (16) (0.2090 nm), O (62)-H (63)⋅⋅⋅O (16) (0.2215 nm), O (72)-H (73)⋅⋅⋅O (17) (0.2058 nm), O (81)⋅⋅⋅ H (25)-C (21) (0.2326 nm), and O (82)-H (83)⋅⋅⋅O (18) (0.1980 nm), respectively. The H (7) and H (8) atoms of PHN, which are viewed as the electron acceptors, react with the O (41) and O (31) atoms of AM considered as the electron donors via hydrogen bonds. The O (16), O (17), and O (18) of PHN, which are regarded as the electron donors, react with the hydrogen atoms (H (53), H (33), H (44) or H (63), H (73), H (83), which are considered as the electron acceptors. These results are consistent with the analysis of HOMO and LUMO distributions.
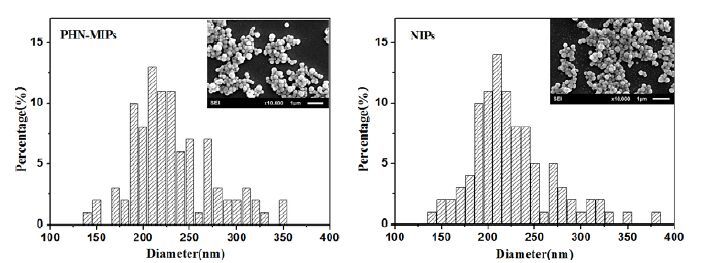
The surface morphologies of MIPs and NIPs were characterized through the scan electron microscopy (SEM), as shown in Fig. 4, from which one can find that the MIPs and NIPs prepared in acetonitrile solvent are roughly uniform microspheres. The distribution analysis of the microspheres particle size was studied with the help of Nano Measure 1.2 software. The results indicate that the particle sizes of MIPs and NIPs are in the ranges of 150~390 and 140 ~380 nm, respectively. Their mean particle sizes are 230 and 190 nm, respectively. The diameter distribution and particle size are better than those of MIPs synthesized via the two-step swelling methods[12].
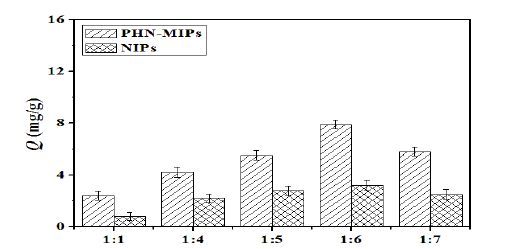
The MIPs and NIPs with different molar ratios of PHN and AM (1:1, 1:4, 1:5, 1:6, and 1:7) were prepared and their adsorption performances were studied under the guidance of computer simulation. The initial concentration of methanol solution of PHN was 100 mg/L. The adsorption quantities of MIPs and NIPs in different molar ratios are plotted in Fig. 5. As shown in Fig. 5, the adsorption quantities of MIPs and NIPs increase along with the molar ratios of PHN and AM. When the molar ratio increases to 1:7, the adsorption quantity of PHNMIPs decreases slightly. Thus, the MIPs synthesized by PHN and AM with the molar ratio of 1:6 show the highest desorption capacity. The specific adsorption capacity for MIPs is higher than the nonspecific adsorption capacity for NIPs, indicating that the recognition cavities of MIPs play a main role in the impRinted adsorption proprieties.
In order to investigate the selectivity adsorption properties of MIPs (the molar ratio of PHN and AM is 1:6), 20 mg of MIPs (NIPs) was used to study the adsorption properties in 100 mg/L of PHN and its analogues solutions. The selectivity properties of MIPs and NIPs are listed in Table 3. As shown in Table 3, the selective factors of MIPs to PNT, BAR, and DMBA are 1.19, 1.25, and 3.29, respectively. The adsorption quantity of MIPs to PHN is larger than those of MIPs to the others due to that MIPs containing the functional groups play a complementary role with the PHN and own the particular cavities matching the stereo structures of PHN completely. The differences of PNT, BAR, DMBA, and PHN in structures cause the impRinted cavities not to match the analogues, thus the adsorption capacities of MIPs to analogues decrease. This result suggests that the adsorption quantity of MIPs to PHN is the largest when the PNT, BAR, AND, and DMBA exist all at once. The selective factors of NIPs to PNT, BAR, and DMBA are 1.14, 1.23, and 1.45, respectively. The values are similar and obviously lower than that of MIPs. Thus, the adsorptions of NIPs toward the objects are the general adsorption.
DownLoad:
CSV
| PNT | 6.6 | 1.19 | 2.8 | 1.14 |
| BAR | 6.3 | 1.25 | 2.6 | 1.23 |
DownLoad:
CSV
| 303K | 92.52 | 91.35 | 89.34 | 88.61 | 90.45 | 1.97 |
| Notes: RSD is the abbreviation of relative standard deviation | ||||||
The recycling of PHN-MIPs is an important indicator to measure their properties. The performance is evaluated mainly through the repeated processes, such as elution, washing, drying, and adsorption until adsorption equilibrium for MIPs. The elution solvent is the methanol-acetic acid (v/v, 8:2). As shown in Table 3, the recovery rate of MIPs is 93.70% at 293 K after reusing 5 times. The recovery rates of MIPs at 303 and 313 K are both lower than that at 293 K. Consequently, the stability of MIPs decreases along with the increasing temperature. In addition, the general recovery rates are all larger than 88.91%, and the MIPs are expected to detect the PHN in the samples.
In this paper, the PHN and AM were regarded as the template molecule and functional monomer, respectively. The configuration, action sites, and interaction essence of the PHN-AM complexes were all simulated with the help of quantum chemistry calculation simulation at 333 K. The impRinted mechanism was researched, and the interactions between PHN and AM were the hydrogen bonding interactions. The optimized impRinted ratio of PHN and AM was 1:6. The PHN-MIPs with the molar ratio to be 1:6 was prepared by the precipitation polymerization. The PHN-MIPs presented the microsphere shape, and their diameter was in the range of 150~390 nm. The saturation adsorption capacity of PHN-MIPs was 7.9 mg/g. The recycling rate was higher than 88.91% after the MIPs had been used 5 times at different temperature. This study could provide the theoretical and experimental references for the selective adsorption detection of PHN.
Moein M. M, Javanbakht M, Karimi M, Akbari-Adergani B. Molecularly imprinted sol-gel nanofibers based solid phase microextraction coupled on-line with high performance liquidchromatography for selective determination of acesulfame[J]. Talanta, 2015, 134: 340-347. doi: 10.1016/j.talanta.2014.11.011
Zhang Y. Q, Shan X, Gao X. Q. Development of a molecularly imprinted membrane for selective separation of flavonoids[J]. Sep. Purif. Technol, 2011, 76: 337-344. doi: 10.1016/j.seppur.2010.10.024
Ji J, Zhou Z, Zhao X. L, Sun J. D, Sun X. L. Electrochemical sensor based on molecularly imprinted film at Au nanoparticles-carbon nanotubes modified electrode for determination of cholesterol[J]. Biosens. Bioelectron, 2015, 66: 590-595. doi: 10.1016/j.bios.2014.12.014
Zhai H. Y, Su Z. H, Chen Z. G, Liu Z. P, Yuan K S, Huang L. Molecularly imprinted coated graphene oxide solid-phase extraction monolithic capillary column for selective extraction and sensitive determination of phloxine B in coffee bean[J]. Anal. Chim. Acta, 2015, 865: 16-21. doi: 10.1016/j.aca.2015.01.028
Wyszomirski M, Prus W. Molecular modelling of a template substitute and monomers used in molecular imprinting for aflatoxin B1 micro-HPLC analysis[J]. Mol. Simulat, 2012, 38: 892-895. doi: 10.1080/08927022.2012.667876
Luo D, Zhao Z, Zhang L, Wang Q, Wang J. On the structure of molecularly imprinted polymers by modifying charge on functional groups through molecular dynamics simulations[J]. Mol. Simulat, 2013, 40: 431-438.
Su T. T, Liu J. B, Tang S. S, Chang H. B, Jin R. F. Theoretical study on the structures and properties of phenobarbital imprinted polymers.Chin[J]. J. Struct. Chem, 2014, 33: 1421-1430.
Liu J. B, Shi Y, Tang S. S, Jin R. F. Theoretical and experimental research on the self-assembled system of molecularly imprinted polymers formed by salbutamol and methacrylic acid[J]. J. Sep. Sci, 2015, 38: 1065-1071. doi: 10.1002/jssc.201401309
Mujahid A, Iqbal N, Afzal A. Bioimprinting strategies: from soft lithography to biomimetic sensors and beyond[J]. Biotechnol. Adv, 2013, 31: 1435-1447. doi: 10.1016/j.biotechadv.2013.06.008
Hua K. C, Zhang L, Zhang Z. H, Guo Y, Guo T. Y. Surface hydrophilic modification with a sugar moiety for a uniform-sized polymer molecularly imprinted for phenobarbital in serum[J]. Acta Biomater, 2011, 7: 3086-3093. doi: 10.1016/j.actbio.2011.05.006
Hu S. G, Wang S. W, He X. W. An amobarbital molecularly imprinted microsphere for selective solid-phase extraction of phenobarbital from human urine and medicines and their determination by high-performance liquid chromatography[J]. Analyst, 2003, 128: 1485-1489. doi: 10.1039/b310775b
Yoshimatsu K, Reimhult K, Krozer A, Mosbacha K, Sodeb K, Yea L. Uniform molecularly imprinted microspheres and nanoparticles prepared by precipitation polymerization: the control of particle suitable for different analytical applications[J]. Anal. Chim. Acta, 2007, 584: 112-121. doi: 10.1016/j.aca.2006.11.004
Sun J. N, Liu J. B, Tang S. S, Jin R. F. Theoretical researches on the self-assembly system of ciprofloxacin imprinted polymers[J]. Chin. J. Struct. Chem, 2013, 32: 1204-1210.
Siripairoj W, Kaewchada A, Jaree A. Synthesis of molecularly imprinted polymers for the separation of gamma-oryzanol by using methacrylic acid as functional monomer[J]. J. Taiwan. Inst. Chem. E, 2014, 45: 338-346. doi: 10.1016/j.jtice.2013.06.035
Gohary N. A. E, Madbouly A, Nashar R. M. E, Mizaikoff B. Synthesis and application of a molecularly imprinted polymer for the voltammetric determination of famciclovir[J]. Biosens. Bioelectron, 2015, 65: 108-114. doi: 10.1016/j.bios.2014.10.024
Bai J. W, Zhong F. C, Liu X. Y, Zhang J. H. Preparation and evaluation of magnetic imprinted polymers for 2,4,6-trinitrotoluene by surface imprinting[J]. Poly. Int, 2014, 63: 1487-1493. doi: 10.1002/pi.2014.63.issue-8
Wen Z, Ni T, Jia X, Wang G. P, Long W, Li X. L, Liao S, Hou D. Synthesis, recognition characteristics and properties of l-3-n-butylphthalide molecularly imprinted polymers as sorbent for solid-phase extraction through precipitation polymerization[J]. Mat. Sci. Eng. C, 2015, 53: 166-174. doi: 10.1016/j.msec.2015.04.034
Frisch, M. J.; Trucks, G. W.; Schlegel, H. B.; Scuseria, G. E.; Robb, M. A.; Cheeseman, J. R.; Zakrzewski, V. G.; Montgomery, J. A.; Stratmann, R. E.; Burant, J. C.; Dapprich, S.; Millam, J. M.; Daniels, A. D.; Kudin, K. N.; Strain, M. C.; Farkas, O.; Tomasi, J.; Baroe, V.; Cossi, M.; Cammi, R.; Mennucci, B.; Pomelli, C.; Adamo, C.; Clifford, S.; Ochterski, J.; Petersson, G. A.; Ayala, P. Y.; Cui, Q.; Morokuma, K.; Malick, D. K.; Rabuck, A. D.; Raghavachari, K.; Foresman, J. B.; Cioslowski, J.; Ortiz, J. V.; Baboul, A. G.; Stefanov, B. B.; Liu, G.; Liashenko, A.; Piskorz, P.; Komaromi I.; Gomperts R.; Martin R. L.; Fox D. J, Keith T, Al-Laham M. A, Peng C. Y, Nanayakkara A, Gonzalez C, Challacombe M, Gill P. M. W, Johnson B, Chen W, Wong M. W, Andres J. L, Gonzalez C, Head-Gordon M, Replogle E. S, Pople J. A.Gaussian 09, Revision A.2 Pittsburgh PA: Gaussian Inc, 2009.
Bader R. F. W. A quantum theory of molecular structure and its applications[J]. Chem. Rev, 1991, 91: 893-928. doi: 10.1021/cr00005a013
Bhawani Datt J, Anubha S, Poonam T, Sudha J. Molecular structure, vibrational spectra and HOMO, LUMO analysis of yohimbine hydrochloride by density functional theory and ab initio Hartree-Fock calculations[J]. Spectrochim. Acta Part A, 2011, 82: 270-278. doi: 10.1016/j.saa.2011.07.047
Popelier P. L. A. Characterization of a dihydrogen bond on the basis of the electron density[J]. J. Phys. Chem. A, 1998, 102: 1873-1878. doi: 10.1021/jp9805048

Figure 3 Models of the complexes formed from PHN and AM molar ratios of PHN-AM: (A) 1:1, (B) 1:2, (C)1:3, (D)1:4, (E) 1:5, and (F) 1:6
Table 1. Relevant Parameters of the Molecular Imprinting Systems of PHN and AM
| N(32)–H(33)⋅⋅⋅O(16) | 0.1968 | 0.0261 | 0.0836 | ||
| 1:2 | O(31)⋅⋅⋅H(8)–N(15) | 0.1735 | 0.0361 | 0.1133 | –100.2 |
| N(32)–H(33)⋅⋅⋅O(16) | 0.1967 | 0.0263 | 0.0826 | ||
| O(41)⋅⋅⋅H(7)–N(14) | 0.1731 | 0.0363 | 0.1139 | ||
| N(42)–H(43)⋅⋅⋅O(18) | 0.1966 | 0.0267 | 0.0858 | ||
| 1:3 | O(31)…H(8)–N(15) | 0.18 | 0.0305 | 0.0929 | –141.2 |
| N(32)–H(33)⋅⋅⋅O(17) | 0.2092 | 0.0211 | 0.0655 | ||
| O(41)⋅⋅⋅H(7)–N(14) | 0.1734 | 0.0365 | 0.1145 | ||
| N(42)–H(43)⋅⋅⋅O(18) | 0.1955 | 0.0265 | 0.0829 | ||
| N(52)–H(53)⋅⋅⋅O(16) | 0.2145 | 0.0212 | 0.0628 | ||
| 1:4 | O(31)⋅⋅⋅H(8)–N(15) | 0.1778 | 0.0328 | 0.1002 | –180.3 |
| N(32)–H(33)⋅⋅⋅O(17) | 0.211 | 0.019 | 0.0591 | ||
| O(41)⋅⋅⋅H(7)–N(14) | 0.1768 | 0.0346 | 0.1092 | ||
| N(42)–H(43)⋅⋅⋅O(18) | 0.1971 | 0.026 | 0.0803 | ||
| N(52)–H(53)⋅⋅⋅O(16) | 0.2195 | 0.0197 | 0.0584 | ||
| N(62)–H(63)⋅⋅⋅O(16) | 0.2173 | 0.0137 | 0.0494 | ||
| 1:5 | O(31)⋅⋅⋅H(8)–N(15) | 0.1751 | 0.0341 | 0.1045 | –218.7 |
| N(32)–H(33)⋅⋅⋅O(17) | 0.206 | 0.0193 | 0.0597 | ||
| O(41)⋅⋅⋅H(7)–N(14) | 0.1759 | 0.0348 | 0.1097 | ||
| N(42)–H(43)⋅⋅⋅O(18) | 0.1972 | 0.0261 | 0.0815 | ||
| N(52)–H(53)⋅⋅⋅O(16) | 0.2078 | 0.0192 | 0.0566 | ||
| N(62)–H(63)⋅⋅⋅O(16) | 0.2182 | 0.0134 | 0.0483 | ||
| N(72)–H(73)⋅⋅⋅O(17) | 0.2026 | 0.0234 | 0.0749 | ||
| 1:6 | O(31)⋅⋅⋅H(8)–N(15) | 0.1763 | 0.0343 | 0.105 | –249.1 |
| N(32)–H(33)⋅⋅⋅O(17) | 0.2089 | 0.0194 | 0.0599 | ||
| O(41)⋅⋅⋅H(7)–N(14) | 0.175 | 0.0359 | 0.1131 | ||
| N(42)–H(43)⋅⋅⋅O(18) | 0.1986 | 0.0249 | 0.0772 | ||
| O(51)⋅⋅⋅H(23)–C(20) | 0.2247 | 0.0196 | 0.0548 | ||
| N(52)–H(53)⋅⋅⋅O(16) | 0.209 | 0.0185 | 0.0547 | ||
| N(62)–H(63)⋅⋅⋅O(16) | 0.2215 | 0.013 | 0.0472 | ||
| N(72)–H(73)⋅⋅⋅O(17) | 0.2058 | 0.0228 | 0.0733 | ||
| O(81)⋅⋅⋅H(25)–C(21) | 0.2326 | 0.0194 | 0.0553 | ||
| N(82)–H(83)⋅⋅⋅O(18) | 0.198 | 0.0211 | 0.071 | ||
| 1:7 | O(31)⋅⋅⋅H(8)–N(15) | 0.1896 | 0.0285 | 0.0849 | –321.3 |
| N(32)–H(33)⋅⋅⋅O(17) | 0.2021 | 0.0219 | 0.067 | ||
| O(41)⋅⋅⋅H(7)–N(14) | 0.1784 | 0.0362 | 0.1141 | ||
| N(42)–H(43)⋅⋅⋅O(18) | 0.1916 | 0.0265 | 0.0822 | ||
| N(72)–H(73)⋅⋅⋅O(17) | 0.2046 | 0.0105 | 0.0325 | ||
| Notes: The H(7), H(8), N(14), N(15), O(16), O(17), and O(18) represent the atoms of PHN, and the others represent the atoms of AM | |||||
 下载: 导出CSV
Table 2. Selective Factor α of MIPs and NIPs for PHN, PNT, BAR, and DMBA
| PNT | 6.6 | 1.19 | 2.8 | 1.14 |
| BAR | 6.3 | 1.25 | 2.6 | 1.23 |
下载: 导出CSV
Table 3. Adsorption Rate (%) of MIPs in Different Temperature and Times
| 303K | 92.52 | 91.35 | 89.34 | 88.61 | 90.45 | 1.97 |
| Notes: RSD is the abbreviation of relative standard deviation | ||||||
下载: 导出CSV

 扫一扫看文章

扫一扫关注我们


