Table 1.
Structures and PMIC Values of Derivatives Used for Modeling
Citation:
Jian-Bo TONG, Xu CAO. 3D-QSAR Studies on the Imidazopyrimidine Derivatives[J]. Chinese Journal of Structural Chemistry,
2020, 39(11): 1985-1989.
doi:
10.14102/j.cnki.0254–5861.2011–2696

3D-QSAR Studies on the Imidazopyrimidine Derivatives
English
3D-QSAR Studies on the Imidazopyrimidine Derivatives
Abstract:
Comparative molecular field analysis (CoMFA) and comparative molecular similarity indices analysis (CoMSIA) for imidazopyrimidine derivatives were performed to get the molecular active conformation selection, molecular alignment, as well as the establishment of corresponding 3D-QSAR model. The model established by this method has good ability to predict such compounds. For CoMFA model, the cross-validated q2 and non-cross-validated r2 values are 0.665 and 0.872, respectively. The best q2 value for CoMSIA model is 0.632 and r2 value is 0.923. Using this information and the three-dimensional equipotential map for molecular design can theoretically obtain some new antibacterial drugs with higher activity. There are two newly designed molecules with activity values of 7.921 and 7.872, which are higher than that of the template molecule No. 12 with an activity value of 7.850, and the QSAR research results can provide a theoretical reference for the synthesis of new drugs.
-
Key words:
- 3D-QSAR
- / comparative molecular force field analysis
- / molecular design
-
1. INTRODUCTION
Imidazopyrimidines are a very important class of heterocyclic compounds. A large number of studies have shown that such compounds have better biological activities like insecticidal, bactericidal, herbicidal, antiviral, and anticancer agents[1-3]. Because imidazopyridine has a novel structure and a unique mechanism of action with a broad spectrum of bactericidal activity, low toxicity, and high efficiency, it is highly concerned in the fields of medicine, pesticides, and the like. Therefore, the use of the Quantitative Structure-Activity Relationship (QSAR) method to study and develop novel imidazopyridinium bactericides is of paramount importance. The imidazopyrimidine derivatives selected herein have been tested to show that they have a latent pharmacological activity or biological activity and are a class of well-selective cox-2 inhibitors. We investigated the antibacterial activity of 2, 3-dihydroimidazopyrimidine compounds for the design.
The three-dimensional quantitative structure-activity relationship (3D-QSAR) study is a method that combines the three-dimensional structural information of a molecule with the physical and chemical properties, structural parameters and activity relationships by statistical methods, which indirectly reflects the drug molecules. Compared with the traditional two-dimensional quantitative structure-activity relationship (2D-QSAR), 3D-QSAR has more clear physical meaning and more abundant information than the traditional one. Representative methods are CoMFA[4] and CoMSIA[5], which are considered to be receptors. The force varies with the change of the force field around the molecule. Therefore, the quantitative molecular field information parameter can be used as a variable to calculate the drug activity, and to explore the mode of action between the drug activity and the molecules, which is further selective and targeted to carry out the design of new drugs.
2. MATERIALS AND METHODS
2.1 Translocation body comparison molecular field
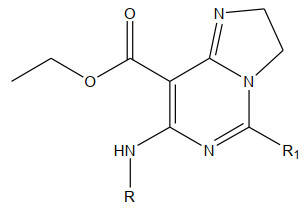
The 26 imidazopyrimidines in this paper are taken from the literature[5] which uses the nonlinear method of genetic algorithm to study the quantitative structure-activity relationship of the bioactivity of imidazopyrimidines, while CoMFA and CoMSIA are applied here. Quantitative structure-activity relationship modeled 26 imidazopyrimidines, established a stable 3D-QSAR model, examined the relationship between compound structure and biological activity, and designed a new high activity. Besides, the basic skeleton of imidazopyrimidines is shown below. The inhibition of E. coli by all compounds is expressed as MIC/(μmol·dm-3), and the MIC values are converted to the PMIC ones. The chemical structure is as follows. The activity data are shown in Table 1. The entire data set is divided into two parts using the principle of 4 picks, and 20 training sets build the model while 6 test sets verify the model thus built. The basic skeleton is shown in Fig. 1.
Table 1

 DownLoad:
CSV
DownLoad:
CSV
No. R R1 PMIC CoMFAPre CoMSIApre 1* C6H5CH2- H 7.328 7.342 7.268 2 -C6H5 H 7.374 7.218 7.234 3 3-CH3-C6H4 H 7.298 7.263 7.192 4 4-CH3-C6H4 H 7.270 6.942 7.037 5 2-OCH3-C6H4 H 6.952 7.015 6.973 6* 4-OCH3-C6H4 H 7.195 7.115 7.231 7 2-F-C6H4 H 7.082 7.234 7.198 8 4-F-C6H4 H 7.333 7.338 7.369 9 3-CF3-C6H4 H 7.245 7.269 7.321 10 4-Cl-C6H4 H 7.247 7.213 7.198 11* 4-Br-C6H4 H 7.161 6.987 7.178 12 -C6H5 C6H5 7.850 7.742 7.542 13 4-CH3-C6H4 C6H5 7.493 7.421 7.342 14 2-OCH3-C6H4 C6H5 7.193 7, 086 7.235 15 4-OCH3-C6H4 C6H5 7.591 7.389 7.435 16* 2-F-C6H4 C6H5 7.498 7.327 7.432 17 4-F-C6H4 C6H5 7.498 7.389 7.337 18 4-Cl-C6H4 C6H5 7.294 7.183 6.982 19 4-Br-C6H4 C6H5 7.244 6.936 7.185 20 -CH3 H 7.045 6.823 6.943 21* -C2H5 H 6.895 7.234 7.182 22 2-CH3-C6H4 H 7.167 7.218 7.183 23 2-Cl-C6H4 C6H5 7.197 7.162 7.082 24 3-Cl-C6H4 H 6.958 7.032 6.972 25 -CH3 C6H5 6.872 6.732 7.212 26* 3-Cl-C6H4 C6H5 7.118 7.124 7.113 Figure 1
 Figure 1. Structure of the compound
The compounds were divided into two groups, with molecules 1, 6, 11, 16, 21 and 25 used as the training sets by the method of four-pick one, and those remained as the test sets. The inhibitory effect of all compounds on E.coli was expressed as MIC, and the MIC values were converted to the PMIC ones, as shown in Table 1.
2.2 Molecular folding
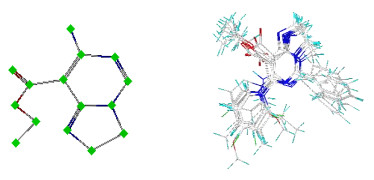
Molecular overlay is a crucial step in QSAR modeling. The superposition results have a great influence on the prediction accuracy of the model and the reliability of the isotope analysis[6]. In this paper, we selected the No.12 compound with the highest activity and the lowest energy molecular superposition as the template molecule. The common superimposed skeleton and superposed molecules are shown in Fig. 2, where white represents the carbon atom, red the oxygen atom, and blue the nitrogen atom. Powell energy gradient method was adopted in the optimization process to optimize the compound molecules[7].
Figure 2
 Figure 2. Basic molecular skeleton and molecular overlap
2.3 Establishment of the QSAR model
CoMFA analyzes the stereoscopic field and electrostatic field to characterize the structure and uses partial least-squares PLS to explore the relationship between the three-dimensional structure of the compound and its biological activity[8]. CoMSIA is an improvement of the CoMFA method. The model can select the stereo field, electrostatic field, hydrophobic field, hydrogen bond donor field and hydrogen bond acceptor field to consider the receptor about the relationship with the compound[9, 10]. A molecular force field with a good cross-validation coefficient is obtained by calculating various force field combinations. Molecular force fields with good cross-validation coefficients can be obtained by calculating various force field combinations. In this paper, calculations are performed using a combination of Tripos standard force field, Lennard Jones, and Coulomb energy function, and the distance of each molecule in the x, y, and z directions is set to 0.3 nm. In addition, the superimposed molecules are placed in a 3D grid in a certain step to obtain relevant cross-validation coefficients[11-14]. Studies have shown that when the cross-validation correlation coefficient q2 is greater than 0.5 and the non-interactive verification correlation coefficient r2 is higher than 0.6, the model has better predictive power[15-18].
3. RESULTS
3.1 Prediction capability of the QSAR model
The statistical results of the QSAR model are shown in Table 1, in which the contributions of the stereo and electrostatic fields of the CoMFA model are 0.563 and 0.396, respectively, indicating the stereo field is slightly larger than the electrostatic field in this model. For the CoMFA model, q2 = 0.665 and r2 = 0.872. It is known from Table 2 that the stereo and hydrophobic field contributions of the model are 0.387 and 0.613, q2 = 0.632, r2 = 0.923.
Table 2
Table 2. New Molecular DesignDownLoad:
CSV
No. Structure pMIC(Pred) No. Structure pMIC(Pred)
1
7.921
2
7.872
3
7.542
4
7.6313.2 Three-dimensional equipotential map of the CoMFA model
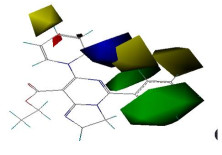
Fig. 3 is a three-dimensional equipotential map of the CoMFA model with the lowest energy molecule 13 as a template. The green and yellow areas indicate that the increase and decrease of steric hindrance are respectively beneficial to the improvement of compound activity; while the red and blue regions show that the introduction of negatively and positively charged substituents both favor the improvement of the activity of the compound[19-21].
Figure 3
 Figure 3. Contour maps of the CoMFA model
As can be seen from Fig. 3, there is a large green area at the position of the R1 substituent, indicating that the introduction of a substituent at a large group here facilitates an increase in activity. For example, compound 12 (R1 = C6H5, pMIC = 7.850) has higher activity compound 2 (R1 = H, pMIC = 7.374); compound 16 (R1 = C6H5, pMIC = 7.498) has greater activity than compound 7 (R1 = H, pMIC = 7.082); compound 18 (R1 = C6H5, pMIC = 7.294) has larger activity than compound 10 (R1 = C6H5 pMIC = 7.247). There is a large yellow area at the position of the base, indicating that the introduction of a small group substituent is advantageous for the activity[18]: The activities of compounds 2 (R = C6H5, pMIC = 7.374) and 19 (R = Cl, pMIC = 7.244) are greater than those of compounds 1 (R = C6H5CH2, pMIC = 7.328) and 18 (R = Br, pMIC = 7.294), correspondingly. It can be seen from Fig. 5b that a red moiety appears in the lateral position of R, indicating that the introduction of a group with large electronegativity in this region is beneficial for the activity of the compound. For example, when the R substituent is 4-F-C6H4 in molecule 8, the activity value is pMIC = 7.333, while when the R substituent is 4-Cl-C6H4 or the R substituent is 4-Br-C6H4, the activity values were 7.247 and 7.244, respectively. It can be seen that on the R substituent, the more electronegative groups, the higher activity value. In addition, the activity value when the R substituent is 4-Cl-C6H4 (pMIC = 7.294) is greater than that when R = 4-Br-C6H4 (pMIC = 7.244).
3.3 Three-dimensional equipotential map for the CoMSIA model
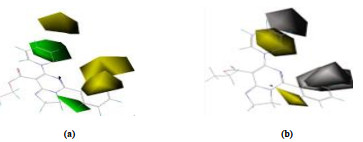
The isopotential diagram of the hydrophilic and hydrophobic fields of the CoMSIA model is shown in Fig. 4a and 4b. The white and yellow areas indicate that the introduction of a hydrophilic and a hydrophobic groups are beneficial to the activity of the compound. In Fig. b, a white area at the position of the R1 substituent indicates the introduction of a hydrophilic group here improves the activity. A yellow region at the R position suggests that it is advantageous to introduce a hydrophobic group here to increase the activity. For example, compared with compounds 14 (R1 = 2-OCH3-C6H4, pMIC = 7.193) and 15 (R1 = 4-OCH3-C6H4, pMIC = 7.591), compound 12 (R1 = C6H5, pMIC = 7.850) has higher activity.
Figure 4
 Figure 4. Contour maps of CoMSIA model: steric contour map (a) and hydrophobic contour map (b)
3.4 Molecules for the QSAR model design
Through analysis of the three-dimensional equipotential map, four new molecular compounds were designed. By calculating and analyzing in the model, the activity of the obtained compounds was higher than that of the template molecules, further verifying and demonstrating the credibility of the previously constructed model.
4. CONCLUSION
The three-dimensional quantitative structure-activity relationship analysis of 26 imidazopyridine compounds was performed using the CoMFA and CoMSIA methods. The activity prediction of 6 test set inhibitors was carried out with the established model. The Topomer Search technology was used to perform virtual screening of the R group in the ZINC database, and three inhibitor molecules with higher activity were designed. The CoMFA model shows that q2 is 0.665 and r2 is 0.872, while in CoMSIA q2 = 0.632 and r2 = 0.923. Therefore, both CoMFA and CoMSIA methods can establish an effective 3D-QSAR model, which can predict the biological activity of unknown compounds. Using Topomer search can effectively screen R-groups with high contributions from the database for the design of new drugs molecules, which provides new candidates for the design of new antibacterial drugs.
-
-
[1]
Eduardo, B. M.; Miguel, C. F. Multivariate QSAR study of 4, 5-dihydroxypyrimidine carboxamides as HIV-1 integrase inhibitors. J. Med. Chem. 2009, 44, 12−17.
-
[2]
Zhang, X. Y.; Song, Y. P. Synthesis of pyrazolopyrimidines from 1, 2-allenic ketonesand aminopyrazoles. Synfacts 2014, 10, 362−370. doi: 10.1055/s-0033-1341002
-
[3]
Ma, C.; Yang, C. Thesis of Pyrazole Derivatives Foreign Pharmaceutical Antibiotics Volume. China. Academic process 2011, 32, 211−218.
-
[4]
Songjing, H. U.; Saiai, M. I.; Xiaolin, G. U. 3D-QSAR study and molecular design of benzimidazole derivatives as corrosion inhibitors. J. Chem. Univ. 2011, 29, 2402−2409.
-
[5]
Awasthi, M.; Singh, S.; Pandey, V. P. CoMFA and CoMSIA-based designing of resveratrol derivatives as amyloid-beta aggregation inhibitors against Alzheimer's disease. Medici. Chem. Res. 2018, 27, 1−19. doi: 10.1007/s00044-017-1970-2
-
[6]
Yu, H. X.; Zhuo, Y. Z. QSAR studies on a series of tetrahydroisoquinoline derivatives by using CoMFA, CoMSIA and HQSAR. J. L. Z. Univ. 2009, 45, 88−93.
-
[7]
Tong, J. B.; Li, Y. Y. Application of an R-group search technique in the molecular design of dipeptidyl boronic acid proteasome inhibitors. J. Serb. Chem. Soc. 2016, 82, 1025−1037.
-
[8]
Yu, S.; Shi, J. HQSAR and Topomer CoMFA for predicting melanocortin-4 receptor binding affinities of trans-4-(4-chlorophenyl) pyrrolidine-3-carboxamides. Chem. Intel. Labor. System. 2015, 146, 34−41. doi: 10.1016/j.chemolab.2015.04.017
-
[9]
Tenenhaus, M.; Chatelinc, Y. M. PLS path modeling. Compute. Appl. Chem. 2005, 48, 159−205.
-
[10]
Cherkasov, A.; Jankovic, B. Application of 'inductive' QSAR descriptors for quantification of antibacterial activity of cationic polypeptides. J. Mol. 2004, 9, 1034−1052. doi: 10.3390/91201034
-
[11]
Fjell, C. D.; Kai, H. Identification of novel antibacterial peptides by chemoinformatics and machine learning. J. Medic. Chem. 2009, 52, 2006−2015. doi: 10.1021/jm8015365
-
[12]
Garcia-Saez, I.; Debonis, S. R.; Trucco, F. Structure of human Eg5 in complex with a new monastrol-based inhibitor bound in the R configuration. J. Bio. Chem. 2007, 282, 9740−9747. doi: 10.1074/jbc.M608883200
-
[13]
Li, M. P.; Zhang, S. W. Quantitative structure property relationship studies of the pKa values for sulfonamides. J. Atom. Mole. Phys. 2015, 32, 61−64.
-
[14]
Xin, M. L.; Li, Y. Molecular modification of polychlorinated biphenyl dihydroxy derivatives through molecular docking associated with CoMSIA/HQSAR models. Chem. J. Chin. Univ. 2018, 39, 299−309.
-
[15]
Li, M. P.; Liu, S. W. Quantitative structure property relationship studies of the pKa values. J. Atom. Mole. Phys. 2015, 32, 61−64.
-
[16]
Tong, J. B.; Che, T. 3D-QSAR study of hydrazide antituberculosis drugs. J. Atom. Mole. Phys. 2012, 29, 382−386.
-
[17]
Gao, X. L.; Kwang, Z. Quantitative structure tribo-ability relationship for organic compounds as lubricant base oils using CoMFA and CoMSIA. J. Tribol. 2016, 27, 138−144.
-
[18]
Dong, M. H.; Chen, H. F.; Ren, T, K.; Yi, J. Molecular modeling studies, synthesis and biological evaluation of dabigatran analogues as thrombin inhibitors. Bio. Med. Chem. 2015, 24, 73−84.
-
[19]
Tong, J. B.; Qin, S. S. 3D-QSAR study of melittin and amoebapore analogues by CoMFA and CoMSIA methods. Chin. J. Struct. Chem. 2019, 38, 201−210.
-
[20]
Damale, M. G.; Harke, S. N.; Kalam, L.; Khan, F. A. Recent advances in multidimensional QSAR (4D-6D): a critical review. J. Med. Chem. 2014, 14, 35−55.
-
[21]
Cramer, R. D.; Patterson, D. E.; Bunce, J. D. Comparative molecular field analysis (CoMFA) effect of shape on binding of steroids to carrier proteins. J. Am. Chem. Soc. 1988, 110, 5959−5967. doi: 10.1021/ja00226a005
-
[1]
-
Figure 4 Contour maps of CoMSIA model: steric contour map (a) and hydrophobic contour map (b)
Table 1. Structures and PMIC Values of Derivatives Used for Modeling
No. R R1 PMIC CoMFAPre CoMSIApre 1* C6H5CH2- H 7.328 7.342 7.268 2 -C6H5 H 7.374 7.218 7.234 3 3-CH3-C6H4 H 7.298 7.263 7.192 4 4-CH3-C6H4 H 7.270 6.942 7.037 5 2-OCH3-C6H4 H 6.952 7.015 6.973 6* 4-OCH3-C6H4 H 7.195 7.115 7.231 7 2-F-C6H4 H 7.082 7.234 7.198 8 4-F-C6H4 H 7.333 7.338 7.369 9 3-CF3-C6H4 H 7.245 7.269 7.321 10 4-Cl-C6H4 H 7.247 7.213 7.198 11* 4-Br-C6H4 H 7.161 6.987 7.178 12 -C6H5 C6H5 7.850 7.742 7.542 13 4-CH3-C6H4 C6H5 7.493 7.421 7.342 14 2-OCH3-C6H4 C6H5 7.193 7, 086 7.235 15 4-OCH3-C6H4 C6H5 7.591 7.389 7.435 16* 2-F-C6H4 C6H5 7.498 7.327 7.432 17 4-F-C6H4 C6H5 7.498 7.389 7.337 18 4-Cl-C6H4 C6H5 7.294 7.183 6.982 19 4-Br-C6H4 C6H5 7.244 6.936 7.185 20 -CH3 H 7.045 6.823 6.943 21* -C2H5 H 6.895 7.234 7.182 22 2-CH3-C6H4 H 7.167 7.218 7.183 23 2-Cl-C6H4 C6H5 7.197 7.162 7.082 24 3-Cl-C6H4 H 6.958 7.032 6.972 25 -CH3 C6H5 6.872 6.732 7.212 26* 3-Cl-C6H4 C6H5 7.118 7.124 7.113  下载: 导出CSV
Table 2. New Molecular Design
No. Structure pMIC(Pred) No. Structure pMIC(Pred)
1
7.921
2
7.872
3
7.542
4
7.631
下载: 导出CSV
-


 扫一扫看文章
计量
- PDF下载量: 3
- 文章访问数: 1088
- HTML全文浏览量: 12
