Scheme 1.
Schematic illustration of the development of dual-emission N-CDs and sensing of S2-
Ratiometric fluorescent probes based on nitrogen-doped carbon dots for the fluorescence detection of sulfide ions
Zhifeng CAI , Yiran ZHANG , Qun CAI , Miao JIA , Yaxuan FENG , Yuqi ZHANG

Sulfur ions (S2-) are an important form of the sulfur element with diverse roles in nature and industry[1]. In biological systems, S2- serves as a key component of cysteine and methionine in proteins, participating in enzyme activity and metabolic processes, thereby sustaining vital physiological functions[2]. In agriculture, S2- acts as an essential nutrient for plant growth and is widely incorporated into fertilizers to enhance crop yield and development[3]. Additionally, S2- enhances the elasticity and wear resistance of rubber during vulcanization in industrial applications. However, excessive S2- concentration poses significant environmental and health risks. The oxidation products of S2- can lead to acid rain, resulting in soil acidification, water pollution, and vegetation destruction. Moreover, sulfuric acid mist, generated by the reaction of sulfur oxides with atmospheric particulate matter, further exacerbates environmental damage. Meanwhile, acute exposure to high concentrations of sulfide (such as hydrogen sulfide) may induce difficulty breathing and impaired consciousness[4-5]. Given these dual impacts, accurate determination of S2- in real samples is imperative for environmental monitoring and public health protection.
To date, common sensing technologies for S2- have chromatography[6], colorimetry[7-9], electrochemistry[10-11], and fluorescence[12-16]. However, the traditional methods are limited by complex sample processing, high costs, the need for professional operators, and prolonged incubation periods, highlighting the demand for a simple, low-cost, and highly accurate alternative[17]. Among emerging approaches, fluorescence-based sensing methods have got hug interest in analytical fields due to their significant sensing speed, high accuracy, and good repeatability[18]. Compared with other fluorescence nanomaterials, carbon dots (CDs), as promising candidates, have gained apparent interest due to their distinctive optical performance, good water-solubility, biocompatibility, and low toxicity[19]. Additionally, CDs display adjustable emission wavelengths, significant stability, and can be functionalized with diverse groups to enhance specificity toward analytes[20]. CD-based probes have been effectively utilized for detecting anions by leveraging the fluorescence enhancement or attenuation phenomenon. For example, Sun et al. constructed red-emission CDs for fluorescent and colorimetric hypochlorite detection via static quenching effect. Notably, the red-emission CDs were also developed as test paper-based sensing platforms due to the changes in fluorescence color. Moreover, the imaging tests were further studied in HeLa cells with satisfactory results[21]. Wu et al.[22] constructed a fluorescent probe by assembling phenylenediamine-based CDs with rhodamine B, enabling rapid nitrite sensing under acidic conditions through diazotization-induced quenching. Meanwhile, this platform was successfully applied for nitrite sensing in food samples with recoveries of 96.8%-101.8%. Furthermore, the 1, 3-phenylenediamine and citric acid were applied to synthesize water-soluble CDs with blue fluorescence[23]. The CDs could be used for fluorescence determination of Cr2O72- via the inner filter effect (IFE). Finally, the amounts of Cr2O72- in real samples were determined with recoveries of 95%-105%. Zou et al.[24] prepared a novel nanoprobe by combining CDs with histidine-stabilized gold nanoclusters (CDs/His-Au NC), exhibiting strong emission at 447 nm under the excitation wavelength of 347 nm. The fluorescence was quenched by I- via the IFE, yielding a wide linear range of 0.1-60.0 μmol·L-1 and a low detection limit (LOD) of 34 nmol·L-1. Next, the detection system was successfully utilized to determine I- in actual samples. To our knowledge, some studies about CDs for the determination of S2- have been successfully developed. For example, Pang et al. developed near-infrared-CDs for the fluorescence sensing of H2S with an LOD of 56 nmol·L-1 [25], also demonstrating potential for endogenous H2S. Zeng et al.[26] established novel N, F-co-doped CDs (N, F-CDs) with high quantum yield and good photostability, which were successfully used for the measurement of S2- with an LOD of 168 nmol·L-1. The fluorescence of N, F-CDs@S2- could be recovered by Cd2+ because of the formation of CdS. Barati et al. prepared dual sensing systems for S2- using fluorescence enhancement (CDs/Hg2+) and quenching (CDs/Ag+)[27]. However, most existing CDs-based S2- probes relied on single-emission strategies, which were susceptible to interference from concentration fluctuations and instrument sensitivity variations[28].
To our knowledge, ratiometric fluorescence probes operate by quantifying the ratio of fluorescence intensities at two different wavelengths, thereby mitigating the interference of environmental factors and enhancing their sensitivity and accuracy[29-32]. Therefore, the development of ratiometric fluorescent probes has attracted widespread attention from researchers.
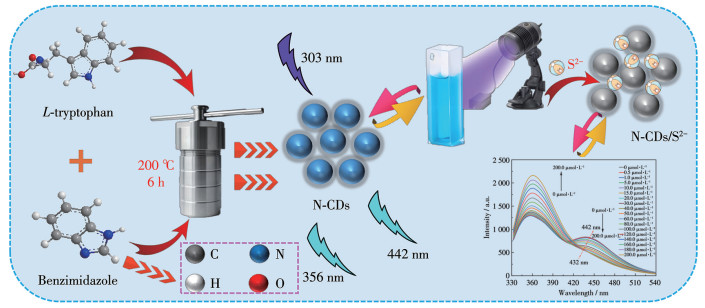
Herein, dual-emission fluorescence carbon dots (N-CDs) for the sensing of S2- were developed by using L-tryptophan and benzimidazole as precursors via hydrothermal methods (Scheme 1). N-CDs exhibited remarkable stability, water-solubility, and strong fluorescence intensity. Two emission peaks were observed at 356 and 442 nm under the excitation wavelength of 303 nm. Upon addition of S2-, the fluorescence intensity at 442 nm decreased, while that increased at 356 nm, demonstrating a ratiometric response. The detection linear range and LOD for the S2- were studied. Moreover, the recoveries of S2- in real samples were evaluated through the standard addition method.
Sodium chloride (≥99.8%), potassium chloride (≥99.8%), calcium chloride (≥99%), magnesium chloride (≥99%), zinc chloride (≥98%), aluminum chloride (≥99%), copper chloride (≥98%), potassium dichromate (≥99%), silver nitrate (≥99%), cobalt chloride (≥98%), cadmium chloride (≥99%), lead chloride (AR), ferric chloride (≥98%), sodium fluoride (≥99%), sodium bromide (≥99%), sodium iodide (≥99.5%), sodium carbonate (≥99.5%), sodium bicarbonate (≥99.8%), sodium oxalate (≥99%), sodium phosphate (≥99%), sodium sulfate (≥99%), sodium sulfite (≥98%), sodium thiosulfate (≥97%), sodium sulfide (≥98%), L-tryptophan (99%), and benzimidazole (≥98%) were all got from Shanghai Aladdin Reagent Co., Ltd (China).
A U-4500 spectrophotometer (Hitachi, Japan) was used to record ultraviolet-visible (UV-Vis) data for fluorescence probes and analytes, with a wavelength range of 200-800 nm. The fluorescence data were obtained from an F-7000 spectrophotometer (Hitachi, Japan) with the excitation and emission slits of 5 nm and a voltage of 400 V. A FLS1000 spectrophotometer (Edinburgh, UK) was applied for the fluorescence lifetime measurement of N-CDs and N-CDs/S2- system (N-CDs: 10 mg·mL-1, S2-: 200.0 μmol·L-1) under Edinburgh Instruments Picosecond Pulsed Laser (EPL) light source (excitation wavelength of 303 nm). The types of functional groups on the surface of N-CDs were determined by using a Bruker Tensor Ⅱ Fourier transform infrared spectroscopy (FTIR, Bremen, Germany). The testing method was investigated through potassium bromide compression technology at a resolution of 4 cm-1 with a recording range of 4 000-500 cm-1. The morphology of N-CDs was studied on a JEOL JEM-2100F (Japan) transmission electron microscope (TEM) at an accelerating voltage of 200 kV. Meanwhile, the particle size was counted by using Nano Measurer 1.2.5. The valence states of elements were discussed through an X-ray photoelectron spectroscopy (XPS, Thermo Kalpha, Thermo Fisher, USA) with a monochromatic Al Kα X-ray source (1 486.6 eV) operating at 150 W.
N-CDs were established by using a hydrothermal method based on published literature with minor modifications[33]. In brief, 180 mg of L-tryptophan and 130 mg of benzimidazole were dissolved in 30 mL of ultrapure water at room temperature. Next, the resulting transparent solution was transferred into a hydrothermal kettle (50 mL) and heated at 200 ℃ for 6 h. After completion, the reaction mixture was centrifuged at 8 000 r·min-1 for 15 min. Subsequently, a dialysis bag (molecular weight cut-off: 500 Da) was utilized to purify the centrifuge solution. Finally, the N-CDs powders were obtained through a freeze dryer for future testing.
The N-CD powders were dissolved in phosphate-buffered saline (PBS) buffer solution (pH=6.0) under stirring at room temperature for 90 s, and the corresponding mass concentration was 10 mg·mL-1. After the addition of S2- (0-200.0 μmol·L-1), the fluorescence emission spectra were recorded at 25 ℃. A working curve was established by discussing the relationship between F442/F356 (F356 and F442 refer to the fluorescence intensity at 356 and 442 nm, respectively) and S2- concentration. The linear range and LOD were obtained based on the above data. For selectivity, some interfering materials (Na+, K+, Ca2+, Mg2+, Zn2+, Cr6+, Ag+, Al3+, Cu2+, Co2+, Cd2+, Pb2+, and Fe3+; F-, Cl-, Br-, I-, CO32-, HCO3-, C2O42-, PO43-, SO42-, SO32-, and S2O32-, their concentrations were all 200.0 μmol·L-1) were added separately into a series of parallel probe solutions to record the variation of fluorescence signals. For anti-interference evaluation, 200.0 μmol·L-1 interfering substance and 200.0 μmol·L-1 S2- solution were simultaneously added to the probe solution.
The tap and river water samples were collected from our laboratory and the Fenhe River, respectively. Orange juice samples (Minute Maid) were purchased from the Meitehao supermarket. All samples were centrifuged at 8 000 r·min-1 for 15 min to remove insoluble substances, and the supernatants were applied for recovery tests. In the sensing process, standard S2- solutions were added to these supernatants under gentle stirring at room temperature for 5 min. Subsequently, the spiked solutions were dropped into the above sensing system (the final concentrations of S2- were 15.0, 25.0, and 35.0 μmol·L-1), which was transferred into a fluorescent colorimetric dish (1 cm×1 cm). The fluorescent data were obtained under the excitation wavelength of 303 nm. Finally, the recovery rate and relative standard deviation (RSD) were calculated to evaluate the feasibility of the sensing platform.
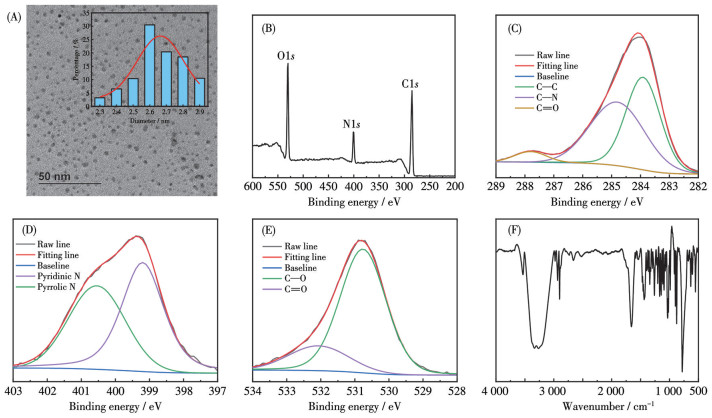
TEM was employed to study the morphology and particle size of N-CDs. As displayed in Fig.1A, some uniform spherical particles could be observed without any obvious aggregation. The inset in Fig.1A indicates the particle size distribution histogram. The particle size distribution was between 2.3 and 2.9 nm with an average diameter of 2.6 nm. The elemental analysis and surface composition of N-CDs were performed through XPS and FTIR characterization. The full XPS spectrum exhibited three main peaks at 285.1, 400.4, and 530.9 eV, which matched C1s, N1s, and O1s, respectively (Fig.1B)[20]. The single XPS spectrum of C1s was decomposed into three peaks at 283.9, 284.9, and 287.7 eV, corresponding to the C—C, C—N, and C=O bonds, respectively (Fig.1C)[24]. Similarly, the single XPS spectrum of N1s displayed two feature peaks at 399.2 and 400.5 eV, which were assigned to pyridinic N and pyrrolic N (Fig.1D)[34]. The high-resolution XPS spectrum of O1s in Fig.1E displayed some characteristic peaks, such as 530.7 eV (C—O) and 532.1 eV (C=O)[35]. FTIR technology indicated that some functional groups could be observed on the surface of N-CDs (Fig.1F). The feature peaks at 3 371, 2 935, and 2 899 cm-1 are ascribed to the stretching vibration of O—H, C—H (asymmetric), and C—H (symmetric), respectively[36]. Moreover, a strong peak at 1 658 cm-1 is attributed to the stretching vibration of the C=O bond, implying the existence of O-containing functional groups[37]. Some bending vibrations were also observed, such as 1 433 cm-1 (N—H), 1 262 cm-1 (O—H), and 875 cm-1 (=CH)[28]. Collectively, FTIR and XPS results confirmed the presence of amino, hydroxyl, and carboxyl groups on the N-CDs surface, which contributed to their excellent water-solubility and dispersibility. In addition, the ζ-potential value of N-CDs was detected to be -15.2 mV (Fig.S1, Supporting information), indicating the presence of some negative functional groups on the surface of N-CDs.
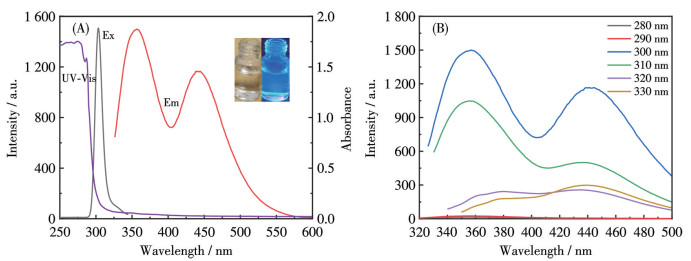
The optical features of N-CDs were investigated by using a UV-Vis absorption and fluorescence spectrophotometer. In the UV-Vis absorption spectrum (Fig.2A), the strong characteristic peak at 275 nm is ascribed to the π-π* transition of the C=C bond, while the weak peak around 350 nm is attributed to the n-π* transition of the C=O bond[30]. Under ultraviolet irradiation, the N-CDs solution (10 mg·mL-1) emitted blue fluorescence. Meanwhile, the color was light yellow under sunlight (inset in Fig.2A). Fluorescence spectra displayed dual emission peaks at 356 and 442 nm under the optimum excitation wavelength of 303 nm, confirming their blue fluorescence emission. Furthermore, the excitation-dependent feature was discussed under various excitation wavelengths. As shown in Fig.2B, both the emission wavelength and intensity varied significantly when the excitation wavelength was tuned from 280 to 330 nm, suggesting the excitation-dependent characteristic, which was often associated with particle non-uniformity and surface defect[38].
Inset: images of N-CDs solution under sunlight (left) and UV light (right).
To our knowledge, the stability of fluorescent probes is one of the core factors affecting their imaging quality and application effectiveness. Thus, the stability of N-CDs was studied under various storage times, light exposure times, and sodium chloride solutions. As displayed in Fig.S2A, the emission intensity remained almost constant after storage at room temperature for 30 d, demonstrating excellent long-term stability. Subsequently, the N-CDs also suggested prominent photostability under ultraviolet irradiation for 15 min (Fig.S2B). In addition, they showed strong anti-interference capability against ionic strength, as the fluorescence signal experienced only minor fluctuations even in the presence of a high NaCl concentration (0.05 mol·L-1) (Fig.S2C). The above tests demonstrated that the N-CDs had outstanding stability, highlighting great promise in a complex analytical environment.
In the determination process of N-CDs to S2-, the detection conditions were optimized, including pH value and incubation time. From Fig.S3A, the quenching rate gradually decreased when the pH value increased from 6.0 to 8.0. Obviously, 6.0 was selected as the best detection pH value. Subsequently, after 90 s of incubation time, the quenching rate reached its maximum value, suggesting that this probe had remarkable sensitivity for S2- (Fig.S3B). Under the optimal measurement conditions (pH: 6.0, incubation time: 90 s), the determination behavior of the N-CDs-based probe for S2- sensing was carried out. As shown in Fig.3A, the emission intensity ratio at 356 and 442 nm (F442/F356) gradually decreased as the S2- concentration (cS) varied from 0 to 200.0 μmol·L-1. The F442/F356 value displayed a prominent linear relationship with S2- amount in the range of 0-60.0 μmol·L-1 (Fig.3B). The linear equation was fitted to be F442/F356=-0.004 4cS+0.62 with a regression coefficient of 0.982 9. Based on the LOD=3b/k (b is the standard deviation of blank samples, k is the slope of the fitted curve), the LOD was determined to be 0.076 μmol·L-1. Meanwhile, the fluorescence color of the sensing system was recorded in the presence of various S2- concentrations. The blue fluorescence showed a slight decrease with S2- concentration increasing from 0 to 200.0 μmol·L-1 (Fig.3B). Compared with other reported measurement methods[6-16, 25-27], the as-fabricated fluorescence platform suggested an equivalent linear range and LOD value, as summarized in Table 1.
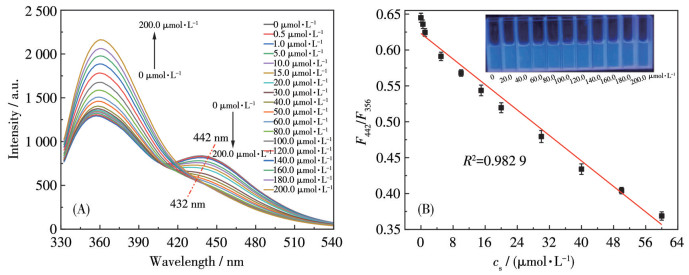
Inset: fluorescence colors of sensing solution in the presence of various S2- concentrations.
 下载:
导出CSV
下载:
导出CSV
| Method | Probe | Linear range / (μmol·L-1) | LOD / (μmol·L-1) | Ref. |
| Chromatography | Not described | 10-100 | 2.5 | [6] |
| Colorimetry | EHL@AgNPRs-3 | 0.2-20 | 0.041 3 | [7] |
| Colorimetry | SnTe | 0.3-900 | 7×10⁻³ | [8] |
| Colorimetry | Ti-MOF@0.3Cu | 0.5-30 | 0.16 | [9] |
| Electrochemistry | CoNi@NGs | 0.5-1 000 | 0.47 | [10] |
| Electrochemistry | CVD-CNT | 1.25-112.5 | 0.3 | [11] |
| Fluorescence | GSH-AuNCs-CDs | 1-50 | 0.35 | [12] |
| Fluorescence | Tb-2I | 0-1 000 | 0.47 | [13] |
| Fluorescence | DBA-NBD-Cl | 0-11.7 | 7×10⁻⁵ | [14] |
| Fluorescence | CuBDC-FAM-DNA | 0.002-0.12 | 1.5×10⁻³ | [15] |
| Fluorescence | BSA-Au NCs | 0-30 | 0.395 | [16] |
| Fluorescence | NIR-CDs | 0.5-20 | 0.056 | [25] |
| Fluorescence | N, F-CDs | 0-30 | 0.16 | [26] |
| Fluorescence | CD/Hg2+ | 2-10 | 0.32 | [27] |
| Fluorescence | N-CDs | 0-60.0 | 0.076 | This work |
Selectivity was a pivotal factor in evaluating the practicability of N-CDs. To evaluate the selectivity of this ratiometric fluorescent probe for S2- detection, several potential interfering substances were added into sensing system, including metal ions (Na+, K+, Ca2+, Mg2+, Zn2+, Cr6+, Ag+, Al3+, Cu2+, Co2+, Cd2+, Pb2+, and Fe3+) and non-metal ions (F-, Cl-, Br-, I-, CO32-, HCO3-, C2O42-, PO43-, SO42-, SO32-, and S2O32-). As shown in Fig.S4A, none of the control substances except S2- significantly altered the fluorescence signal of N-CDs, indicating its prime selectivity towards S2-. Moreover, the interference tests were also studied by discussing the intensity of the sensing probe when S2- and controls coexisted simultaneously. As indicated in Fig.S4B, the controls displayed a weak impact on the S2- measurement based on the N-CDs-based fluorescence probe. In addition, the pictures of the sensing solution with different controls and S2- under an ultraviolet lamp were obtained by using a smartphone. As hinted in Fig.S4C, weak quenching of blue fluorescence was found with the addition of S2-. Briefly, the newly prepared N-CDs, which originated from amino acids, exhibited excellent selectivity and strong anti-interference capability for S2- sensing.
To study the detection mechanism of N-CDs for S2-, some related analysis technologies were conducted, including UV-Vis absorption, fluorescence, and lifetime. Firstly, the UV-Vis absorption of S2- and the fluorescence spectrum of N-CDs were recorded. As indicated in Fig.4A, the UV-Vis absorption spectrum of S2- (200.0 μmol·L-1) did not overlap with the fluorescence spectrum of N-CDs, indicating the absence of IFE or Förster resonance energy transfer[18-19]. In addition, the formula [τ=(B1t12+B2t22)/(B1t1+B2t2)] (τ refers to the average fluorescence lifetime; B1 and B2 refer to the amplitude or pre exponential factor of two components; t1 and t2 are the fluorescence lifetimes of two components) was utilized to calculate the fluorescence lifetime. The data and spectra were listed in Table S1 and Fig.4B, respectively. The lifetime of N-CDs solution (10 mg·mL-1) was carried out to be 2.56 ns. After the addition of S2- (200.0 μmol·L-1), slight changes in lifetime were observed (2.54 ns), demonstrating that the quenching reason might be ascribed to the static quenching effect[20]. Moreover, the UV-Vis absorption data were applied to confirm the above judgment. As hinted in Fig.4C, a new feature peak was observed in the UV-Vis absorption spectrum of N-CDs/S2- system, indicating the presence of a ground-state complex between N-CDs and S2-. In addition, as S2- concentration changed to 200.0 μmol·L-1, the emission intensity of the analytical system (442 nm) decreased, and the corresponding peak altered from 442 to 432 nm, hinting at the existence of an interaction between N-CDs and S2- (Fig.3A)[26, 39]. Next, the Stern-Volmer equation (F0/F=1+KsvcS=KqτcS) was further utilized to investigate the static quenching effect[19], where F0 and F refer to the emission intensities of the probe solution without and with the addition of S2-, KSV is the Stern-Volmer constant (L·mol-1), Kq refers to the quenching constant (L·mol-1·s-1), and τ is the lifetime of N-CDs (2.56 ns). From Fig.4D, Kq was determined to be 3.91×10¹² L·mol-1·s-1 [higher than the maximum scatter collision quenching constant (2×10¹⁰ L·mol-1·s-1)][19]. Therefore, the static quenching effect was the main cause of fluorescence quenching.
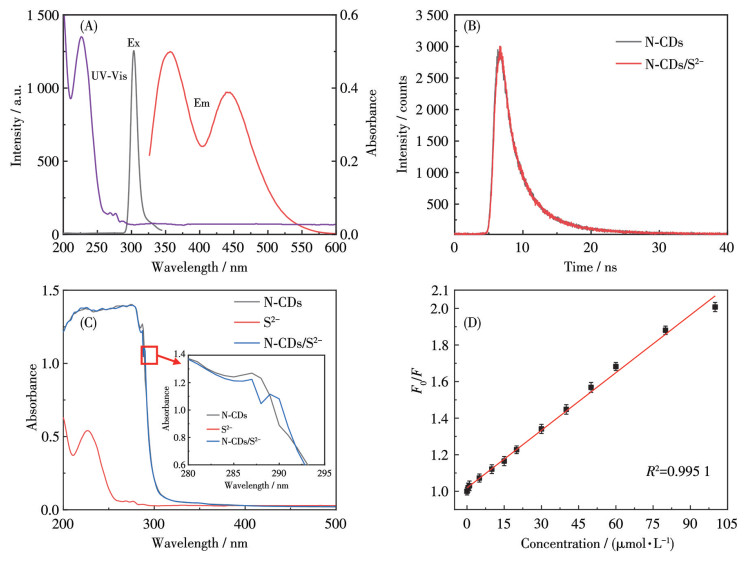
Inset: the corresponding magnified spectra.
To estimate the accuracy of the as-prepared sensing platform, ratiometric fluorescent N-CDs were employed to measure S2- concentrations in orange juice, tap, and river water samples. Different concentrations of S2- (15.0, 25.0, and 35.0 μmol·L-1) were spiked into these real samples, and the measurement results are shown in Table 2. After spiking with definite S2- concentration, the recovery rates changed from 94.2% to 105.5%, and the RSD values varied from 2.1% to 4.5%. These results indicated that the fluorescence-based sensing method had higher feasibility and exactitude. Additionally, the probe synthesized here provided some advantages: (a) utilization of one-pot hydrothermal synthesis technology; (b) choice of environmentally friendly amino acids as precursors; (c) the development of ratiometric fluorescent probes with excellent properties; (d) significant sensitivity and specificity for S2- determination.
下载:
导出CSV
| Sample | Added concentration / (μmol·L-1) | Detected concentration / (μmol·L-1) | Recovery rate / % | RSD / % |
| Orange juice | 15.0 | 14.2 | 94.7 | 2.8 |
| 25.0 | 26.4 | 105.5 | 2.1 | |
| 35.0 | 35.1 | 100.4 | 3.7 | |
| Tap water | 15.0 | 15.4 | 102.9 | 3.6 |
| 25.0 | 25.1 | 100.5 | 4.5 | |
| 35.0 | 35.3 | 101.0 | 3.9 | |
| River water | 15.0 | 14.1 | 94.2 | 4.0 |
| 25.0 | 24.7 | 98.8 | 3.1 | |
| 35.0 | 34.9 | 99.6 | 2.9 |
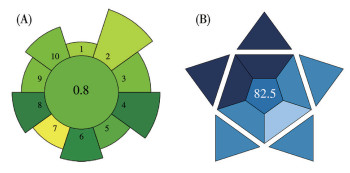
The effect of chemical procedures on the environment has always been a highly concerning topic. Thus, it is necessary to ensure the environmental safety of assay methods. To evaluate the greenness and blueness of the assay, the analytical greenness metric for sample preparation (AGREEprep) tool and the blueness assessment through blue applicability grade index (BAGI) framework were used.
AGREEprep tool involved 10 key aspects: sample preparation, hazardous materials, material renewability, waste, sample size, sample throughput, automation, energy, analytical instrument, and safety. Each aspect was rated on a scale from 0 (non-sustainable) to 1 (highly sustainable). Based on the analysis of the AGREEprep tool, the score was carried out to be 0.80, demonstrating that this sensing platform was safe and environmentally friendly (Fig.5A).
The blueness assessment was performed by using the BAGI tool. In this tool, some features were listed as follows: type of analysis, number of analytes, analytical instrumentation, number of processed samples, sample preparation, number of samples per hour, type of reagents and materials, requirement for preconcentration, automation degree, and sample amount. Each feature was assigned four fixed scores, such as 10.0 (dark blue), 7.5 (blue), 5.0 (light blue), or 2.5 (white) points. The score of the BAGI analysis was 82.5, indicating the significant cost-effectiveness and practicality of the detection system (Fig.5B).
In conclusion, the as-synthesized N-CDs exhibited significant stability, water-solubility, and strong fluorescence, making them an excellent fluorescent probe candidate. Due to the static quenching effect between N-CDs and S2-, this sensing system was successfully utilized as a novel ratiometric probe towards the sensitive determination of S2- through recording the variation of the F442/F356 ratio. In detail, the linear range and LOD were 0-60.0 μmol·L-1 and 0.076 μmol·L-1, respectively. Furthermore, the novel platform displayed selective S2- measurement in real samples, while the AGREEprep and BAGI tools indicated high sustainability, highlighting its significant potential for application in foodstuff analysis.
SUN H Y, LU D T, XIAN M, DONG C, SHUANG S M. A lysozyme-stabilized silver nanocluster fluorescent probe for the detection of sulfide ions[J]. Anal. Methods, 2016, 8: 4328-4333 doi: 10.1039/C6AY00300A
QIAO R Z, LI M J, ZHANG D L, XIAO H. Sulfur ions reduce the activation energy of steranes and terpanes under hydrothermal action[J]. Org. Geochem., 2025, 208: 105044 doi: 10.1016/j.orggeochem.2025.105044
BLANCHARD M, DESMAELE E, POKROVSKI G S, PINILLA C, MEHEUT M, VUILLEUMIER R. Direct prediction of isotopic properties from molecular dynamics trajectories: Application to sulfide, sulfate and sulfur radical ions in hydrothermal fluids[J]. Chem. Geol., 2024, 661: 122202 doi: 10.1016/j.chemgeo.2024.122202
SHI M X, YANG H Y, XIAO X, JIN P J, CHEN Y. Bifunctional Au@MoS2 nanoflowers for solar-enhanced sulfur ion oxidation coupled nitrite reduction electrochemical purification system[J]. Chem. Eng. J., 2025, 522: 167474 doi: 10.1016/j.cej.2025.167474
MURMU P P, KENNEDY J, LIU Z H, MORI T. The role of sulfur valency on thermoelectric properties of sulfur ion implanted copper iodide[J]. J. Alloy. Compd., 2022, 921: 166103 doi: 10.1016/j.jallcom.2022.166103
RICHARDSON C J, MAGEE E A M, CUMMINGS J H. A new method for the determination of sulphide in gastrointestinal contents and whole blood by microdistillation and ion chromatography[J]. Clin. Chim. Acta., 2000, 293: 115-125 doi: 10.1016/S0009-8981(99)00245-4
CHEN S Y, ZHENG Y, GONG J Y, MO S H, REN Y C, XU J R, LU M S. Core-shell structured lignin-stabilized silver nanoprisms for colorimetric detection of sulfur ions[J]. Int. J. Biol. Macromol., 2024, 260: 129626 doi: 10.1016/j.ijbiomac.2024.129626
QU Y, CHEN T, XU Y H. Selective and smart dual-channel colorimetric sulfur ion sensing readout platform[J]. Sensor. Actuat. B‒Chem., 2023, 392: 134060 doi: 10.1016/j.snb.2023.134060
YANG X P, YANG H Y, DENG D, KANG Y J, FAN Y X, WANG Y. In situ self-assembled Ti-MOF@Cu with enzyme activity for colorimetric sensing of sulfur ions[J]. J. Mol. Liq., 2025, 420: 126853 doi: 10.1016/j.molliq.2025.126853
YAN Y T, LI S H, JIANG L M, PENG R Q, LI J M, CUI X J, ZHANG M, DENG D H, WANG G Q, GENG X H. Anti-sulfur poisoning electrochemical sensor for sulfur ions based on nitrogen-doped graphene-encapsulated cobalt-nickel nanoparticles[J]. Sensor. Actuat. B‒Chem., 2025, 424: 136868 doi: 10.1016/j.snb.2024.136868
LAWRENCE N S, DEO R P, WANG J. Electrochemical determination of hydrogen sulfide at carbon nanotube modified electrodes[J]. Anal. Chim. Acta, 2004, 517: 131-137 doi: 10.1016/j.aca.2004.03.101
NEJAD M A F, BIGDELI A, HORMOZI-NEZHAD M R. Wide color-varying visualization of sulfide with a dual emissive ratiometric fluorescence assay using carbon dots and gold nanoclusters[J]. Microchem. J., 2020, 157: 104960 doi: 10.1016/j.microc.2020.104960
ZHU R, LI S C, LI Y, SHI S B, LI J C, ZHANG K. A terbium-macrocycle as fluorescence-enhanced probe for selective and quantitative detection of sulfur and zinc ions[J]. Dyes Pigment., 2026, 245: 113286 doi: 10.1016/j.dyepig.2025.113286
YANG L, ZHAO Z G, SHI Z C. Synthesis and application of a novel turn-on fluorescent probe for the determination of sulfur ions in real samples[J]. Inorg. Chim. Acta, 2024, 572: 122308 doi: 10.1016/j.ica.2024.122308
WANG P, LI W H, WANG X H, XIANG D S, ZHAI K. A new fluorescence detection method for sulfide ions based on Cu-containing metal-organic framework materials and dye-labeled DNA of arbitrary sequence[J]. Chin. J. Anal. Chem., 2023, 51(4): 100245 doi: 10.1016/j.cjac.2023.100245
WU K L, YU L, SUN Y F, YIN M Y, LU Y F, YUAN Z J, JIANG W Y, HUANG R, WANG X X, WANG S H. Fluorescence-enhanced detection of sulfide ions through tuning the structure-activity relationship of gold nanoclusters[J]. Spectroc. Acta Pt. A‒Molec. Biomolec. Spectr., 2025, 330: 125711 doi: 10.1016/j.saa.2025.125711
ALASEEM A M, ALASIRI G, EL-WEKIL M M, AL-MONTASER B H A. Novel red carbon dots-based fluorescence sensor for sensitive detection of vinorelbine: Pharmacokinetic evaluation in breast and lung cancer patients[J]. Microchem. J., 2025, 218: 115361 doi: 10.1016/j.microc.2025.115361
蔡志锋, 武颖, 李雅楠, 孟桂玉, 苗田雨, 张益豪. 叶酸稳定的银纳米团簇对孔雀石绿的有效检测[J]. 无机化学学报, 2025, 41(5): 983-993CAI Z F, WU Y, LI Y N, MENG G Y, MIAO T Y, ZHANG Y H. Effective detection of malachite green by folic acid stabilized silver nanoclusters[J]. Chinese J. Inorg. Chem., 2025, 41(5): 983-993
ZHAO S, FENG F, CHEN Y T, HUANG X Y, WANG Z Z, MIAO C F, WENG S H, LIN M R. Simple detection of minocycline using the designed fluorine-doped carbon dots as probe through fluorescence approach[J]. Microchem. J., 2025, 217: 115068 doi: 10.1016/j.microc.2025.115068
厉圆圆, 卢修联, 刘欣雨, 张磊, 景苏. 具有红色荧光性质的掺硒碳点在生物传感和抗菌中的多功能应用[J]. 无机化学学报, 2024, 40(1): 173-181LI Y Y, LU X L, LIU X Y, ZHANG L, JING S. Red-emitting selenium-doped carbon dots for versatile applications in biosensing and anti-bacterial activities[J]. Chinese J. Inorg. Chem., 2024, 40(1): 173-181
SUN X C, MENG Y C, JI Y X, ZHANG X R, ZHU J L, SHUANG S M, LI J, DONG C. Long-wavelength emission carbon dots as ratiometric fluorescent and colorimetric dual-mode sensors for environmental sensing and bioimaging of hypochlorite[J]. J. Hazard. Mater., 2025, 498: 139719 doi: 10.1016/j.jhazmat.2025.139719
WU H, HAO Y M, CHENG X Y, WANG H P, DONG W J, SHUANG S M, HU Q, DONG C, GONG X J. Phenylenediamine-derived carbon dots coupled with rhodamine B: Ultrafast ratiometric fluorescence and smartphone-enabled imaging detection of nitrite[J]. Food Chem., 2025, 493: 145774 doi: 10.1016/j.foodchem.2025.145774
QIAO G X, LU D, TANG Y P, GAO J W, WANG Q M. Smart choice of carbon dots as a dual-mode onsite nanoplatform for the trace level detection of Cr2O72-[J]. Dyes Pigment., 2019, 163: 102-110 doi: 10.1016/j.dyepig.2018.11.049
ZOU X, HU J, ZHU H H, CHEN Q M, GONG Z J. Ultrasensitive turn-off fluorescence detection of iodide using carbon dots/gold nanocluster as fluorescent nanoprobe[J]. Microchem. J., 2023, 185: 108275 doi: 10.1016/j.microc.2022.108275
PANG L F, SUN Y C, GUO X F, WANG H. Cell membrane-targeted near-infrared carbon dots for imaging of hydrogen sulfide released through the cell membrane[J]. Sensor. Actuat. B‒Chem., 2021, 345: 130403 doi: 10.1016/j.snb.2021.130403
ZENG Y T, XU Z B, LIU A K, CAI H J, ZHANG M M, SONG J, ZENG P J, QU J L, GUO J Q, LI H. Novel N, F co-doped carbon dots to detect sulfide and cadmium ions with high selectivity and sensitivity based on a "turn-off-on" mechanism[J]. Dyes Pigment., 2022, 203: 110379 doi: 10.1016/j.dyepig.2022.110379
BARATI A, SHAMSIPUR M, ABDOLLAHI H. Metal-ion-mediated fluorescent carbon dots for indirect detection of sulfide ions[J]. Sensor. Actuat. B‒Chem., 2016, 230: 289-297 doi: 10.1016/j.snb.2016.02.075
AKIMANA S, XIA Y F, DOU Z C, WEI X, CUI S Q, YUAN H Q, CAI Z Q, ZHENG M E, CHEN J M, BAO G M. A high-specificity, ultra-sensitivity ratiometric fluorescence sensor based on dye@MOF for smartphone-assisted quantification of tobramycin in milk and wastewater[J]. Sensor. Actuat. B‒Chem., 2025, 444: 138502 doi: 10.1016/j.snb.2025.138502
YUAN Y H, XIA W H, YUE C Y, DU M Q, SHEN S Y, ZHU Y J, WANG Y Z, FENG F, TIAN M Z. A rapid ratiometric fluorescence sensor for the detection of hypochlorite in onion cells and zebrafish[J]. Microchem. J., 2025, 214: 114008 doi: 10.1016/j.microc.2025.114008
ZHENG L M, ZHANG J R, GAO J, HE F S, YANG S Q, HE H, DRAMOU P, XIAO D L. Ratiometric fluorescence sensor based on bimetallic organic frameworks for anthrax biomarker detection[J]. Biosens. Bioelectron., 2025, 278: 117279 doi: 10.1016/j.bios.2025.117279
LI C, MA Y M, FAN C, AN Y, MA S Y. A ratiometric fluorescence sensor based on molecular imprinting technology for rapid and visual detection of norfloxacin[J]. Spectroc. Acta Pt. A‒Molec. Biomolec. Spectr., 2025, 330: 125689 doi: 10.1016/j.saa.2024.125689
HAN Y Y, HOU X Y, LI Y L, YANG X P, SUN X, BIAN X X, SUN N, LV Y G, DING L X, LI Z. A ratiometric fluorescent probe for a smartphone-based dual-emission carbon dot fluorescence sensor for the rapid detection of 5-HIAA[J]. Microchem. J., 2025, 212: 113448 doi: 10.1016/j.microc.2025.113448
CHEN Z R, PENG Y T, LIU S H, WANG X Y, GUO Y M. Synthesis of dual-emission carbon quantum dots for ratiometric fluorescence detection of tartrazine[J]. Dyes Pigment., 2026, 245: 113189 doi: 10.1016/j.dyepig.2025.113189
WANG Q, CHENG Y, GAO Y F, SUN N, LI S L, DING L F, CUI X J, NIU Y L, DONG C, SHUANG S M, JING Z Y. UV radiation-activated fluorescence emission wavelength migration for carbon dots and fluorescent sensing of potassium ion[J]. Sensor. Actuat. B‒Chem., 2026, 447: 138778 doi: 10.1016/j.snb.2025.138778
SERAG A, ALZHRANI R M, ALNEMARI R M, ABDULJABBAR M H, ALMALKI A H. Development of sustainable N, S carbon quantum dots turn-off fluorescence method for rivastigmine determination using box-Behnken design in pharmaceutical and environmental applications[J]. Talanta, 2026, 298: 128905 doi: 10.1016/j.talanta.2025.128905
RAN N N, LUO Q, LI H W, WU Y Q. A novel fluorescence nanoprobe for unique determination of chlortetracycline based on zinc-doped carbon dots[J]. Colloid Surf. A‒Physicochem. Eng. Asp., 2026, 726: 137935
WANG Q H, YANG J, YANG S Q, LI J G, CHEN C D, WANG J X, XIONG Z H, SUN K, DENG G W. Dual emission ratiometric fluorescence probe based on N-doped carbon dots and coumarin derivatives for determination of moxifloxacin and copper ion[J]. Anal. Chim. Acta, 2025, 1353: 343958
SAFAEI A, GIYAHBAN F, EBRAHIMZADEH H. Development of a ratiometric fluorescence sensor based on blue- and orange-emissive carbon dots for the determination of tartrazine in food products[J]. Food Chem., 2025, 477: 143582 doi: 10.1016/j.foodchem.2025.143582
WANG J H, ZHOU Z L, LI Q, ZHANG T, FU Y Q. Nitrogen-doped carbon quantum dots as dual mode fluorescence sensors for the determination of food colorant quinoline yellow[J]. Spectroc. Acta Pt. A‒Molec. Biomolec. Spectr., 2024, 315: 124285 doi: 10.1016/j.saa.2024.124285

Scheme 1 Schematic illustration of the development of dual-emission N-CDs and sensing of S2-

Figure 1 (A) TEM image of N-CDs (inset: histogram of particle size distribution); (B) Full XPS spectrum of N-CDs; XPS spectra of (C) C1s, (D) N1s, and (E) O1s on N-CDs; (F) FTIR spectrum of N-CDs

Figure 2 (A) UV-Vis absorption, excitation, and emission spectra of N-CDs; (B) Emission spectra of N-CDs under different excitation wavelengths
Inset: images of N-CDs solution under sunlight (left) and UV light (right).

Figure 3 (A) Fluorescence emission spectra of N-CDs in the presence of various S2- concentrations; (B) Linear relationship between F442/F356 and S2- concentration
Inset: fluorescence colors of sensing solution in the presence of various S2- concentrations.

Figure 4 (A) UV-Vis absorption spectrum of S2-, and excitation and emission spectra of N-CDs; (B) Fluorescence lifetime spectra of N-CDs and N-CDs/S2; (C) UV-Vis absorption spectra of N-CDs, S2-, and N-CDs/S2-; (D) Linear relationship between F0/F at 442 nm and S2- concentration
Inset: the corresponding magnified spectra.
Table 1. Comparison of different methods for S2- determination
| Method | Probe | Linear range / (μmol·L-1) | LOD / (μmol·L-1) | Ref. |
| Chromatography | Not described | 10-100 | 2.5 | [6] |
| Colorimetry | EHL@AgNPRs-3 | 0.2-20 | 0.041 3 | [7] |
| Colorimetry | SnTe | 0.3-900 | 7×10⁻³ | [8] |
| Colorimetry | Ti-MOF@0.3Cu | 0.5-30 | 0.16 | [9] |
| Electrochemistry | CoNi@NGs | 0.5-1 000 | 0.47 | [10] |
| Electrochemistry | CVD-CNT | 1.25-112.5 | 0.3 | [11] |
| Fluorescence | GSH-AuNCs-CDs | 1-50 | 0.35 | [12] |
| Fluorescence | Tb-2I | 0-1 000 | 0.47 | [13] |
| Fluorescence | DBA-NBD-Cl | 0-11.7 | 7×10⁻⁵ | [14] |
| Fluorescence | CuBDC-FAM-DNA | 0.002-0.12 | 1.5×10⁻³ | [15] |
| Fluorescence | BSA-Au NCs | 0-30 | 0.395 | [16] |
| Fluorescence | NIR-CDs | 0.5-20 | 0.056 | [25] |
| Fluorescence | N, F-CDs | 0-30 | 0.16 | [26] |
| Fluorescence | CD/Hg2+ | 2-10 | 0.32 | [27] |
| Fluorescence | N-CDs | 0-60.0 | 0.076 | This work |
 下载: 导出CSV
Table 2. Determination of S2- in actual samples through this fluorescence system
| Sample | Added concentration / (μmol·L-1) | Detected concentration / (μmol·L-1) | Recovery rate / % | RSD / % |
| Orange juice | 15.0 | 14.2 | 94.7 | 2.8 |
| 25.0 | 26.4 | 105.5 | 2.1 | |
| 35.0 | 35.1 | 100.4 | 3.7 | |
| Tap water | 15.0 | 15.4 | 102.9 | 3.6 |
| 25.0 | 25.1 | 100.5 | 4.5 | |
| 35.0 | 35.3 | 101.0 | 3.9 | |
| River water | 15.0 | 14.1 | 94.2 | 4.0 |
| 25.0 | 24.7 | 98.8 | 3.1 | |
| 35.0 | 34.9 | 99.6 | 2.9 |
下载: 导出CSV

 扫一扫看文章

扫一扫关注我们