Figure 1.
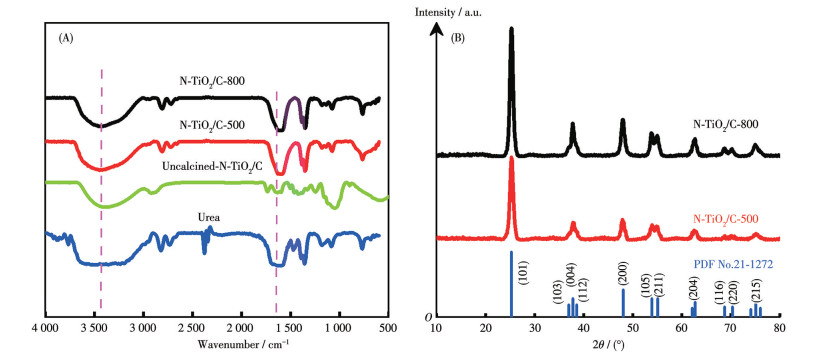
(A) FTIR spectra of the urea, Uncalcined-N-TiO2/C, N-TiO2/C-500 and N-TiO2/C-800; (B) PXRD patterns of N-TiO2/C composites
Synergistic nitrogen doping and carbon support in TiO2 for enhanced photocatalytic degradation of methylene blue and oxytetracycline
Ruru MA , Yingjie SONG , Yahui LI , Ermin ZHOU , Deqiang LI , Xiaojuan HUANG , Jun LI

Escalating environmental pollution, particularly water contamination, poses a significant threat to aquatic ecosystems, a situation exacerbated by rapid industrialization and urbanization[1-3]. Residual pollutants in water, such as dyes and antibiotics, have contributed to the deterioration of water bodies and ecological environments, severely endangering the survival of both humans and animals[4-6]. Tetracycline antibiotics are extensively used in medicine and livestock farming, constituting one of the most widely used classes of antibiotics[7]. Oxytetracycline (OTC), a tetracycline antibiotic, is produced globally for the treatment of human diseases, disease prevention, and as a growth promoter in livestock. It is released into the environment through the excretion of biological waste, potentially threatening ecosystems and human health by facilitating the spread of antibiotic resistance genes[8].
Conventional water pollutant removal methods include physical adsorption[9], biological treatment[10-11], chemical oxidation[12], and photocatalytic degradation[13-14]. Photocatalysis, particularly using titanium dioxide (TiO2), is effective for degrading pollutants like antibiotics due to its strong oxidation ability and broad-spectrum degradation. TiO2 is favored for its high activity, photostability, chemical stability, low cost, and wide availability, making it a promising eco-friendly material for environmental protection[15]. However, TiO2 photocatalysts face challenges like rapid charge recombination, small surface area, and large band gap, limiting their practical use[16]. Thus, developing modification methods for TiO2 is a key research focus.
Non-metal modification of TiO2 to address its intrinsic defects holds significant promise, with single carbon material anchoring to TiO2 being a prominent approach[17-19]. However, advancements in the field have expanded beyond singular modification strategies, exploring the use of two distinct non-metals to overcome the limitations of single-component systems[20-21]. For example, carbon modification of N-doped TiO2 can enhance the photocatalytic activity of titanium, stabilize the anatase crystal phase, and promote the adsorption of organic molecules on the catalyst surface, thereby improving the visible light response and overall stability, in order to overcome the problem of insufficient stability of N-doped TiO2. The modification of TiO2 with carbon materials has been shown to significantly enhance its photocatalytic activity within the visible light spectrum[22-24]. Carbon materials, including graphene and carbon nanotubes, have been extensively employed in the modification of photocatalysts[25]. However, considering environmental concerns alongside efficiency and cost-effectiveness, the selection of suitable carbon materials is a crucial determinant of the economic viability of photocatalysts.
Biomass resources, which are abundant, renewable, and environmentally benign, present promising alternatives to fossil fuels such as oil, coal, and natural gas. They are expected to play a pivotal role in advancing the sustainable development of human society[26]. Through strategies such as loading and doping, biomass-derived materials can be integrated with TiO2 to develop highly efficient hybrid photocatalysts, demonstrating significant potential in both energy conservation and environmental protection[27].
We utilized sawdust as a carbon source and urea as a nitrogen source to prepare carbon-supported, N-doped TiO2 (N-TiO2/C). Both sawdust and urea act as ligands with Ti4+ as the coordination center. A hydrothermal method was employed, and then the materials were calcined at various temperatures to yield N-TiO2/C composites. The composites were characterized by FTIR, powder X-ray diffraction (PXRD), X-ray photoelectron spectroscopy (XPS), ultraviolet-visible diffuse reflectance spectroscopy (UV-Vis DRS), thermogravimetry-derivative thermogravimetry (TG- DTG), scanning electron microscopy-energy dispersive spectroscopy (SEM-EDS), and transmission electron microscopy (TEM). The adsorption kinetics of methylene blue (MB) were investigated. Furthermore, three different nitrogen sources (urea, dopamine, and triethylamine) were used to dope TiO2-based semiconductor materials to assess their photocatalytic degradation efficiency of MB. The most effective catalyst was identified, and the photocatalytic degradation kinetics of the pharmaceutical pollutant OTC were evaluated under optimal conditions.
The balsa sawdust was obtained from Zhengzhou Tianlong Model Technology Co., Ltd (Henan, China). Tetrabutyl titanate, urea, absolute ethanol, and acetic acid (HAc) were obtained from Sinopharm Group Chemical Reagent Co., Ltd (Shanghai, China). All the chemical reagents were used directly without further treatment.
The TiO2/C composites were prepared following the procedure described in our previous work[28]. Based on our findings, calcination at 550 ℃ yielded the optimal TiO2/C material, which was thus selected as the control. The TiO2/C composites that have not undergone high-temperature calcination are designated as Uncalcined-TiO2/C.
Based on the study of TiO2/C, nitrogen-doped TiO2/carbon composites were synthesized via a one-pot solvothermal method, followed by carbonization to obtain N-TiO2/C composites. The procedure was as follows: a suspension (A) was prepared by dissolving sawdust (0.483 g) and urea (0.567 g) in anhydrous ethanol (20 mL). Separately, a solution (B) was formed by dissolving tetrabutyl titanate (10 mL) in a mixture of anhydrous ethanol (20 mL) and glacial acetic acid (5 mL). After being stirred for 30 min each, both suspension A and solution B were combined and sonicated for 30 min. The resulting mixture was then transferred to an autoclave and reacted at 160 ℃ for 12 h, resulting in the formation of N-TiO2/C. Finally, the black blocks were obtained by calcining in a tubular furnace under a nitrogen atmosphere at a flow rate of 150 mL·min-1 at 800 and 500 ℃ for 2 h, respectively. After milling, the N-TiO2/C-800 and N-TiO2/C-500 composites were obtained. The solvent-thermally synthesized N-TiO2/C composites, which have not undergone high- temperature calcination, are designated as Uncalcined-N-TiO2/C.
A Nicolet is5 FT-IR spectrometer was employed to analyze the chemical variation of N-TiO2/C in a wavenumber range of 4 000-500 cm-1 with a resolution of 4 cm-1 and a scan of 32 times. In the present study, the Rigaku Ultima Ⅳ X-ray diffractometer was used to scan the N-doped TiO2/C for its crystal phase composition by PXRD crystallography measurements under the Cu Kα filtering radiation (λ=0.154 06 nm) in a range of 10°-80°, the operating voltage was set to 40 kV, with a tube current of 40 mA, and the scan rate was 2 (°)·min-1. The average crystallite size (Dp) is one of the most critical parameters correlated with the photocatalytic performance. Here, the Dp values of the obtained samples were calculated using the Scherrer equation[29]:
|
|
(1) |
where K, the Scherrer constant, is 0.94; λ is the X-ray wavelength; θ stands for the diffraction angle, and β is the width at half-maximum (FWHM) value. The PHI 5000 Versaprobe Ⅲ (ULAC-PHI, Japan) equipped with a monochrome Al Kα X-ray source was used to record the XPS spectra to analyze the elemental composition and chemical states of N-doped TiO2/C. PerkinElmer Lambda1050 software was used to get the UV-Vis DRS of the samples. The thermodynamic behavior was assessed by TG-DTG at a pyrolysis temperature of 5 ℃·min-1 in a temperature range of 25-800 ℃ in an air atmosphere. N2 adsorption-desorption isotherms were determined (Micromeritics Mike ASAP 2460 Instruments) in the relative pressure (p/p0) range of 0 to 1 for the pore structure analysis. The Brunauer-Emmett-Teller (BET) model was used to determine the specific surface area (SBET) of the composites. The Barrett-Joyner-Halenda (BJH) model was used to estimate the pore diameter distribution. The microstructure of N-doped TiO2/C was scanned using SEM (Hitachi S-4800) with a 1-10 kV acceleration voltage. The relative element dispersion and content of N-TiO2/C were analyzed by combining EDS (INCAX-MAX, Oxford, Tokyo, Japan). The particle size of TiO2 was scanned and observed by TEM operated at 200 kV (JEOL JEM-F200, Japan).
The initial step in photocatalytic degradation of organic pollutants is adsorption, which is vital for overall efficiency as it affects the catalyst′s performance. MB was employed to evaluate the adsorption capacity of N-TiO2/C composites in the dark. N-TiO2/C (20 mg) was dispersed in 50 mL of MB solution (20 mg·L-1) with magnetic stirring at 600 r·min-1 at room temperature. Samples were taken periodically, centrifuged at 10 000 r·min-1, and analyzed using a UV-Vis spectrophotometer at 664 nm. The adsorption capacity was calculated by the following equation:
|
|
(2) |
where qt is the adsorption capacity at time t; ρ0 (mg·L-1) and ρt (mg·L-1) are the mass concentration of MB at the origin and time t, m (mg) is the dosage of N-TiO2/C, and V (mL) is the volume of MB solution (i.e., 50 mL).
To provide a more comprehensive description of the adsorption process. Employing kinetic studies, a detailed description of the catalyst adsorption process was provided, and the experimental data were fitted using pseudo-first-order, pseudo-second-order, and intra-particle diffusion models. The pseudo-first-order model was frequently utilized to characterize the adsorption process[30], and its linear relationship was expressed as follows:
|
|
(3) |
The pseudo-second-order model is the most widely applied in kinetic studies, and it can be expressed as:
|
|
(4) |
The intra-particle diffusion model can be used to describe diffusions through the film, pore, and surface, and adsorption by the pore surface:
|
|
(5) |
where qe and qt (mg·g-1) represent the adsorption capacity at adsorption equilibrium and time t (min), respectively, k1 (min-1) stands for the rate constant of the pseudo-first-order model, k2 (g·mg-1·min-1) is the rate constant of the pseudo-second-order model, kid (mg·g-1·min-0.5) is the related rate constant, Ci is the intercept that can be identified based on the boundary layer thickness.
The photocatalytic activity of the prepared materials was tested by degrading MB and OTC under visible light. To compare the effects of different nitrogen sources on the photocatalytic performance of the composite materials, N-TiO2/C composites were prepared using urea, dopamine, and triethylamine, respectively, under the same conditions and at the same proportions. The optimal N-TiO2/C catalyst was compared with TiO2/C-550 from a published study[28]. Photocatalytic tests were conducted in a quartz tube using a xenon lamp with an AM 1.5 filter (AHD500W, Ahongda, China) at 171 W and 25 ℃. N-TiO2/C (20 mg) was added into 50 mL of MB solution (20 mg·L-1) with magnetic stirring at 600 r·min-1 for 30 min at room temperature. Then, the photocatalytic experiment was started, during which 2 mL of suspension was sucked out at 5 min intervals, and the photocatalyst was removed by centrifugation at 10 000 r·min-1. The concentration of MB was determined by a UV-Vis spectrophotometer at 664 nm.
The optimal catalyst identified from screening tests was applied to degrade the OTC pollutant under the same conditions as MB. 20 mg of photocatalyst was introduced into a solution of OTC (50 mL, 20 mg·L-1). Following a 30 min of adsorption period in darkness, the photocatalytic reaction was initiated. The concentration of OTC was determined by a UV-Vis spectrophotometer at 356 nm. The degradation rate (η) of MB and OTC was calculated by the following equation:
|
|
(6) |
where ρ0 and ρt are the mass concentration at the origin and time t, and A0 and At are the corresponding absorbance.
To better investigate the kinetics of the photocatalytic degradation of MB by TiO2/C composites, the MB photodegradation process can be described using a kinetic model, specifically the pseudo-first-order kinetic model:
|
|
(7) |
where ρ0′ (mg·L-1) represents the initial mass concentration of the MB solution before degradation, and kd is the apparent rate constant.
To gain a deeper understanding of the photocatalytic mechanism and the primary active species involved in the photocatalytic process, radical trapping experiments were conducted. Disodium ethylenediaminetetraacetate (Na2EDTA), isopropyl alcohol (IPA), and benzoquinone (BQ) were employed to quench the hole (h+), hydroxyl radical (·OH), and superoxide radical (·O2-), respectively. The photocatalytic steps were repeated, the capturing agent was added to the reaction system, and the degradation of the MB solution was observed.
The reusability tests were conducted as follows: (1) the used N-TiO2/C-800 was gathered, washed with ethanol three times, and vacuum-dried at 60 ℃ for 6 h; (2) the operation of photo degradation experiments was repeated. These operations were repeated five times.
In the FTIR spectra of the N-TiO2/C-800 and N-TiO2/C-500 composites (Fig. 1A), the adsorption peak at 1 400 cm-1 is attributed to the bending vibration of the —OH in the carboxyl groups. The peaks observed between 2 900 and 2 800 cm-1 are ascribed to C—H stretching vibrations. These findings suggest the presence of carboxyl groups, which facilitate the electrostatic attraction of MB molecules onto the TiO2/C[31]. Furthermore, all N-TiO2/C exhibited aromatic ring skeletal stretching vibrations within a range of 1 650-1 450 cm-1, indicating the presence of aromatic hydrocarbons and their derivatives in the carbon component, which promotes the interaction between MB molecules and the photocatalysts[32]. Additionally, the peak at around 550 cm-1 corresponds to the Ti—O—Ti bond bridge in the spectra of TiO2/C[33]. The N—H functional group was observed around 1 500 cm-1 [34]. The characteristic absorption peaks located at 1 605 cm-1 and 1 395 cm-1 are assigned to the aromatic skeletal vibrations in the lignin component. Moreover, the absorption peaks of phenolic hydroxyl, alcohol hydroxyl, and amino groups were observed within a range of 3 695-3 047 cm-1. The significant fluctuations in the fingerprint region of the Uncalcined-N-TiO2/C composites suggest the coordination reaction of carboxyl and hydroxyl or amino groups with Ti4+ [31, 35].
The PXRD pattern of N-TiO2/C is displayed in Fig.1B. Both the N-TiO2/C-800 and N-TiO2/C-500 composites exhibited the typical anatase TiO2 phase (PDF No.21-1272), with diffraction peaks at 25.3°, 37.8°, 48.0°, 53.9°, 55.1°, and 62.7° corresponding to the (101), (004), (200), (105), (211), and (204) crystal planes of anatase TiO2, respectively. The changes in peak intensities suggested successful N incorporation and alterations in the TiO2/C grain size, and no significant fluctuations or emergence of new peaks were observed, indicating that nitrogen doping does not induce the formation of any secondary or impurity phases within the TiO2 matrix[36]. N-TiO2/C-800 exhibited sharper and more intense peaks compared to N-TiO2/C-500, indicating higher crystallinity and larger crystallite size. Calculations conducted using Jade 6 software reveal that the average crystallinity of the N-TiO2/C-800 and N-TiO2/C-500 composites was 93.33% and 91.66%, respectively.
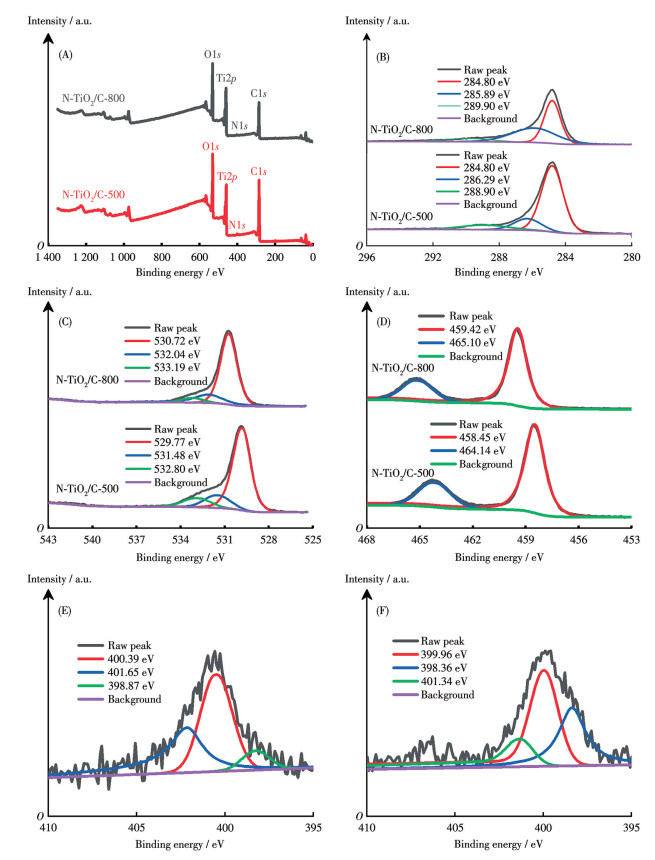
The elemental composition and content of the N-TiO2/C-800 and N-TiO2/C-500 composites were analyzed using XPS. Both composites exhibited an additional N1s peak at 400 eV (Fig.2A), although the peak intensity was relatively weak, suggesting a low N content. As shown in Fig.2B, the high-resolution C1s spectrum of N-TiO2/C-800 revealed diffraction peaks at 284.80, 285.89, and 289.90 eV, which correspond to C—C, C—O, and C=O bonds. The high-resolution C1s spectrum of N-TiO2/C-500 demonstrated three peaks at 284.80, 286.29, and 288.90 eV, corresponding to C—C, C—O, and C=O bonds[37]. The presence of abundant carbon sources from urea and sawdust suggests a high concentration of functional groups in the composites, providing numerous active sites. However, neither sample displayed a peak at 281-282 eV in the C1s spectrum[38], indicating that carbon is not incorporated into the TiO2 lattice. The high-resolution O1s (Fig.2C) spectrum for N-TiO2/C-800 showed diffraction peaks at 530.72, 532.04, and 533.19 eV, corresponding to carbonyl oxygen and oxide components (i.e., Ti—O—Ti), oxygen-containing single bonds (i.e., C—O—H and C—O—C), and chemisorbed oxygen. For N-TiO2/C-500, peaks at 529.77, 531.48, and 532.80 eV are attributed to similar components. The Ti2p spectrum (Fig. 2D) of N-TiO2/C-800 exhibited two peaks, which shifted towards higher binding energies by approximately 0.18 eV compared to the orbital binding energies of TiO2 (Ti2p3/2: 459.42 eV, Ti2p1/2: 465.10 eV). This shift indicates the introduction of impurity energy levels, which reduces the energy level spacing for electron transitions, thereby resulting in a red shift. The binding energies of Ti2p3/2 and Ti2p1/2 orbitals of N-TiO2/C-500 were 458.45 and 464.14 eV, respectively. As shown in Fig.2E and 2F, the N1s peaks of N-TiO2/C-800 appeared at 398.87, 400.39, and 401.65 eV, while for N-TiO2/C-500, they were at 398.36, 399.96, and 401.34 eV. The peaks at 398.87 and 398.36 eV correspond to C—N bond configurations, while the β-N1s electron peak appeared near 400.00 eV, indicating the incorporation of N into the interstitial sites of the TiO2 lattice. Peaks at above 400 eV are attributed to interstitial N species. The Ti, C, N, and O content of N-TiO2/C-800 was 13.49%, 54.18%, 1.06%, 31.26%, respectively, as shown in Fig.2A.
The light absorption properties of N-TiO2/C were studied by UV-Vis DRS. As illustrated in Fig.3A and 3B, the spectra of N-TiO2/C exhibited a significant red-shift in the optical absorption threshold within the visible light region. Notably, N-TiO2/C-800 exhibited a more pronounced red-shift compared to the N-TiO2/C-500. The band gap energy (Eg) of N-TiO2/C was estimated by the Kubelka-Munk method, and the results are presented in the insets of Fig.3A and 3B. The Eg of N-TiO2/C-800 was 2.60 eV, which was lower than that of N-TiO2/C-500 (2.72 eV), demonstrating a decrease in band gap with increasing calcination temperature. The synergistic interaction between sawdust carbon and nitrogen expands the photoresponse region, reduces the band gap, and consequently enhances solar energy utilization and photocatalytic efficiency. UV-Vis DRS confirms that nitrogen doping in TiO2/C broadens the visible light absorption range, resulting in a red-shift in the photoresponse wavelength.
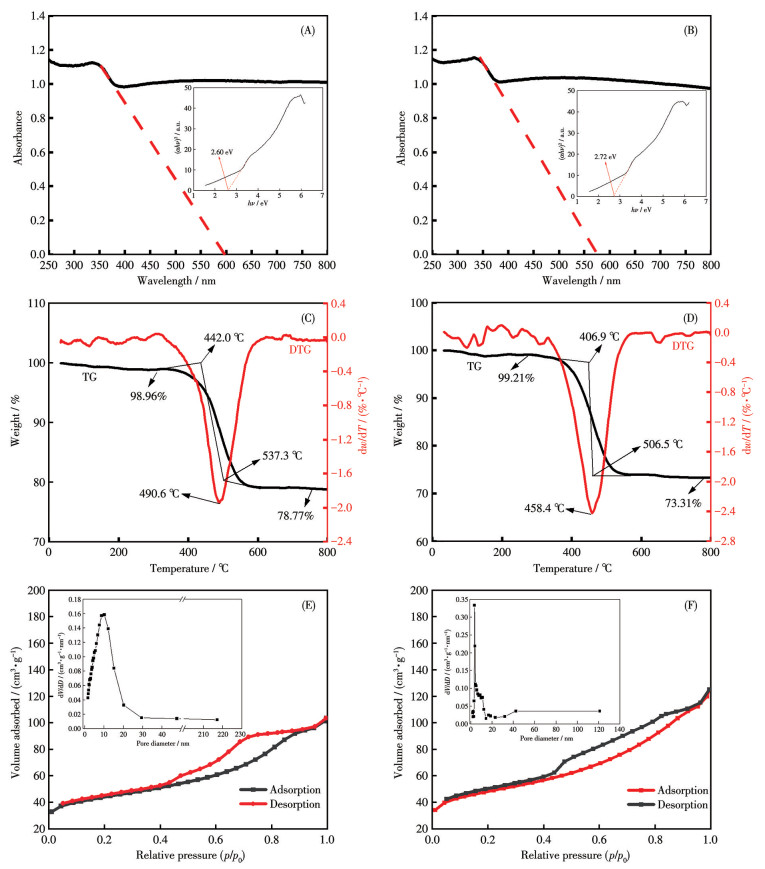
Quantitative and thermal stability analyses of N-TiO2/C-800 and N-TiO2/C-500 composites were conducted using TG-DTG. As shown in Fig.3C and 3D, an initial minor weight loss was observed in the initial stage, likely due to the evaporation of surface water. After calcination at 800 ℃ under atmospheric conditions, the residues for N-TiO2/C-800 and N-TiO2/C-500 were 78.77% and 73.31%, respectively, indicating that the TiO2 content in the composites was approximately 78.77% and 73.31%. The main weight loss for N-TiO2/C-800 occurred between 442.0 and 537.3 ℃ with a corresponding DTG peak at 490.6 ℃, while for N-TiO2/C-500, it occurred between 406.9 and 506.5 ℃ with a DTG peak at 458.4 ℃ due to carbonaceous materials decomposition. The TG curves revealed that the carbon content was about 20.19% for N-TiO2/C-800 and 25.9% for N-TiO2/C-500. Compared to N-TiO2/C-500, N-TiO2/C-800 possessed a higher TiO2 content and a relatively lower carbon content.
The surface areas, average pore sizes, and pore volumes of N-TiO2/C composites were determined through nitrogen absorption-desorption measurements. Fig.3E and 3F illustrate that both N-TiO2/C-800 and N-TiO2/C-500 showed a type Ⅳ adsorption isotherm with an H3 hysteresis loop at a relative pressure of 0.40, indicating the complex and irregular mesoporous structure. The insets of Fig.3E and 3F reveal that the pore size distribution of N-TiO2/C was primarily concentrated in the 5-15 nm range. As shown in Table 1, the SBET of N-TiO2/C-800 and N-TiO2/C-500 was 157 and 137 m2·g-1, respectively, with corresponding pore sizes of 6.163 9 and 5.566 3 nm, providing substantial evidence for the mesoporous structure in the composites. Consequently, the N-doping of TiO2/C enhances its surface area and pore structure, thereby providing more active sites, which leads to an increased adsorption capacity for pollutant molecules and enhanced photocatalytic activity.
 下载:
导出CSV
下载:
导出CSV
| Sample | SBET / (m2·g-1) | Pore volume / (cm3·g-1) | Average pore size / nm |
| N-TiO2/C-800 | 157 | 0.127 4 | 6.163 9 |
| N-TiO2/C-500 | 137 | 0.102 4 | 5.566 3 |
SEM was employed to characterize the morphology and structure of N-TiO2/C composites. Fig. 4C and 4F display the SEM images of the composites before calcination at different magnifications, revealing a rough surface with numerous mammillary structures. After carbonization, N-TiO2/C composites maintained a relatively rough surface, with TiO2 particles demonstrating aggregation and increased size (Fig. 4A, 4B, 4D, and 4E). Fig. 4G and 4H display the EDS analysis results for the N-TiO2/C-800 composite. The elemental mapping of C, O, Ti, and N indicates a uniform distribution of these elements throughout the catalyst. However, the specific content of N on the composite′s surface was not detected, possibly due to its low concentration. This observation aligned with the results obtained from XPS analysis.
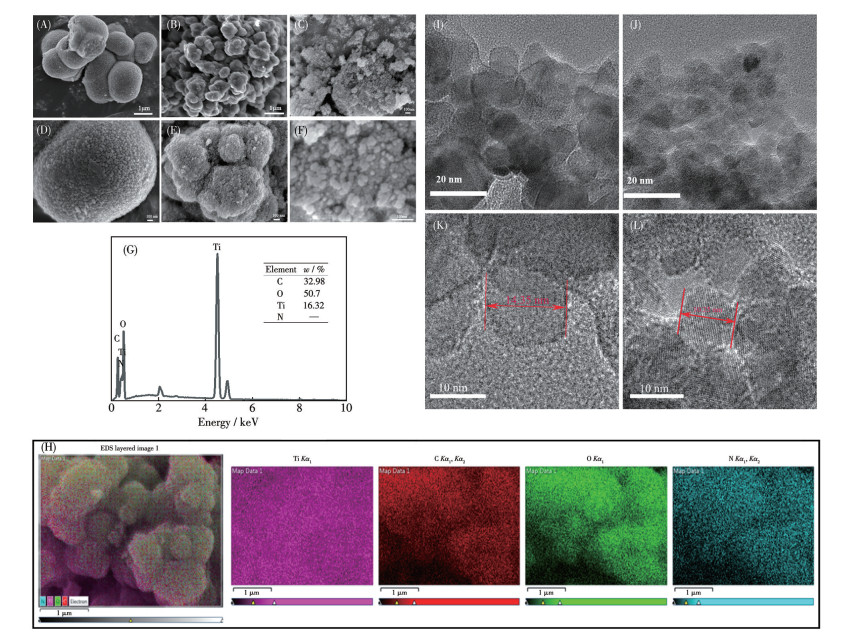
TEM analysis of N-TiO2/C-800 and N-TiO2/C-500 composites, shown in Fig.4I and 4J, revealed that both composites exhibited aggregation and a wide size distribution due to varying formation times. The particle d-spacing for N-TiO2/C-800 and N-TiO2/C-500 was 14.35 and 10.25 nm, respectively, aligning with the (101) plane of the tetragonal anatase crystal structure, indicating TiO2 presence. The shadow regions at the bottom without distinct lattice fringes likely represent the carbon component within the composites.
The adsorption process was conducted using a batch adsorption method to facilitate the establishment of an adsorption-desorption equilibrium between MB (20 mg·L-1, 50 mL) and the composites. The influence of contact time on adsorption performance is depicted in Fig. 5A. An initial rapid adsorption phase was observed within the first 5 min, followed by a slower adsorption phase, and finally, ultimately reaching equilibrium. The adsorption capacity of N-TiO2/C-800 and N-TiO2/C-500 composites for MB within 30 min was 33.7 and 12.3 mg·g-1, respectively.
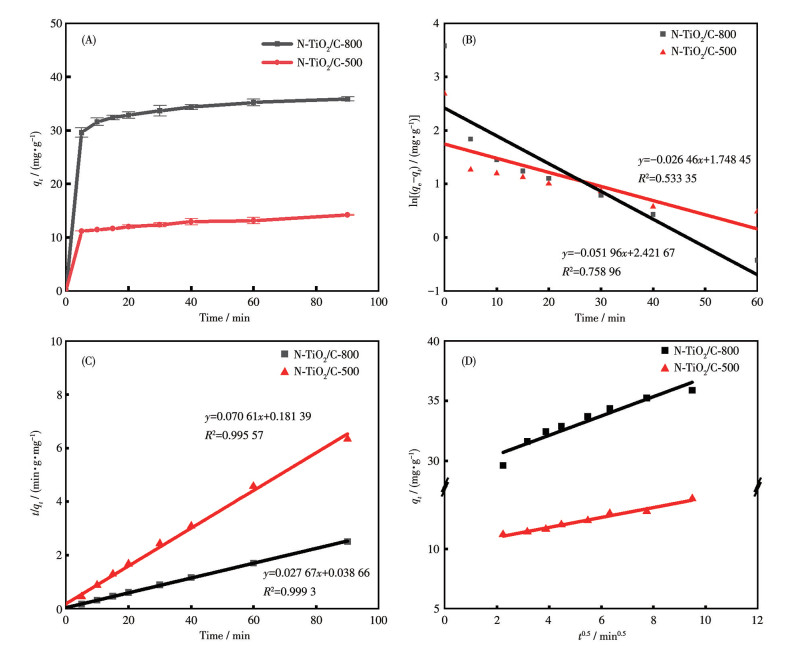
The experimental data were analyzed using a pseudo-first-order kinetic model (Fig.5B). A significant discrepancy was observed between the calculated equilibrium adsorption capacity (qe, cal) and the experimental value (qe, exp). The R2 values for N-TiO2/C-800 or N-TiO2/C-500 were lower than those of the pseudo-second- order kinetic model, indicating that the adsorption process does not adhere to the pseudo-first-order kinetic model.
Fig. 5C presents the linear fitting curve of t/qt vs t. The correlation coefficient (R2 > 0.99) from the pseudo-second-order kinetic model indicated that the calculated adsorption capacity (qe, cal) matched the experimental value (qe, exp) for MB adsorption by N-TiO2/C-800 or N-TiO2/C-500. This suggests that the adsorption rate is primarily governed by surface liquid film diffusion and chemisorption. Fig. 5D illustrates the empirical linear relationship between qt and t0.5, and the resulting intra-particle diffusion curve indicates an adsorption process, potentially representing the intra-particle diffusion of dye ions within the catalyst. The kinetic parameters for MB adsorption by N-TiO2/C-800 are listed in Table 2.
下载:
导出CSV
| Kinetic model | Parameters |
| Pseudo-first-order | qe, cal=38.8 mg·g-1, k1=0.05 20 min-1, R2=0.524 85 |
| Pseudo-second-order | qe, cal=35.6 mg·g-1, k2=0.027 7 g·mg-1·min-1, R2=0.999 36 |
| Intra-particle diffusion | Ci=36.6 mg·g-1, kid=0.808 mg·g-1·min-0.5, R2=0.923 47 |
We compared the degradation rates of MB (20 mg·L-1, 50 mL) by N-TiO2/C composites (20 mg) with different nitrogen sources (Fig. 6A). The composites using urea as the nitrogen source exhibited a 99.4% degradation rate in 60 min, outperforming those with dopamine (59.2%) and triethylamine (64.2%). This indicates that the composites synthesized using urea as the nitrogen source possess superior adsorption and photocatalytic performance. Fig. 6B shows the photocatalytic activity of Uncalcined-N-TiO2/C and Uncalcined-TiO2/C composites (20 mg) for MB (20 mg·L-1, 50 mL), with both exhibiting relatively low catalytic performance, but the superior photocatalytic performance of Uncalcined-N-TiO2/C compared to Uncalcined-TiO2/C indicates that partial N doping into the TiO2 lattice after solvothermal treatment. The degradation rates of the uncalcined composites were lower than those of N-TiO2/C-800 and TiO2/C-550, suggesting that the uncalcined composites do not form a carbonaceous phase that interacts effectively with TiO2. Fig. 6C and 6D show that N-TiO2/C composites (20 mg) calcined at 800 ℃ had a higher photocatalytic activity, with degradation rates of MB (20 mg·L-1, 50 mL) of 99.6% for N-TiO2/C-800, 50.0% for N-TiO2/C-500, and 10.8% for blank.
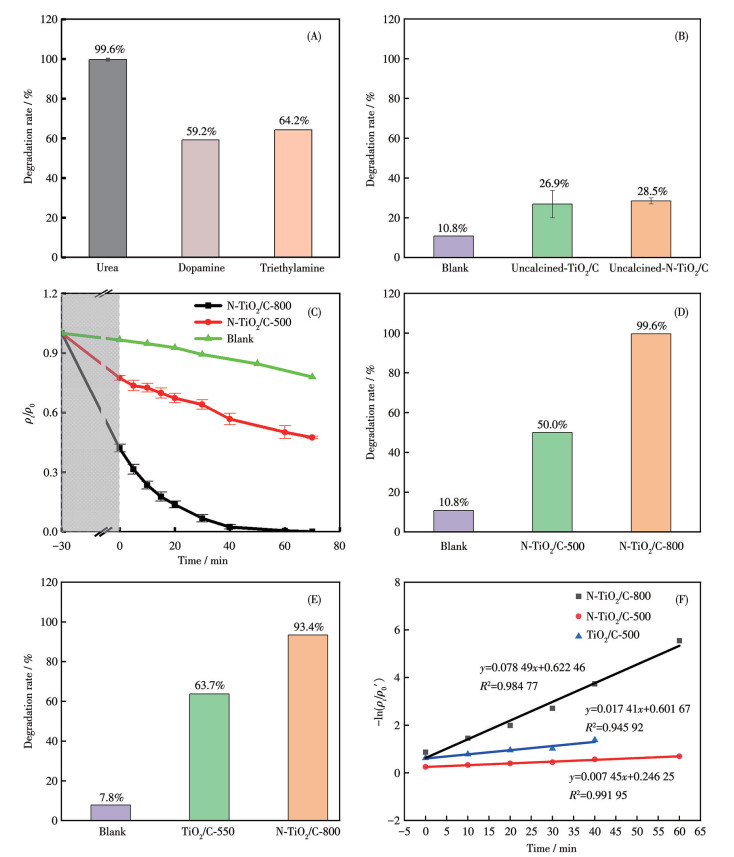
Fig.6E shows the photocatalytic activity of N-TiO2/C-800 and TiO2/C-550 composites (20 mg) for MB (20 mg·L-1, 50 mL). The degradation rate of N-TiO2/C-800 was 93.4% in 30 min, compared to 63.7% for TiO2/C-550 composites. The first-order kinetic model was used to study the photocatalytic degradation process of MB, and the results are shown in Fig. 6E. The relationship between ln(ρt/ρ0′) and t was linear. All samples displayed similar correlation coefficients (R2), with rate constants decreasing in the order: N-TiO2/C-800, TiO2/C-550, and N-TiO2/C-500, indicating the high photocatalytic performance of N-TiO2/C-800 composites. Fig.6B-6E demonstrate that high-temperature calcination facilitates the introduction of N into the TiO2 lattice, thereby reducing the bandgap, extending the visible light absorption spectrum, accelerating electron transfer processes, and enhancing the photocatalytic degradation of MB.
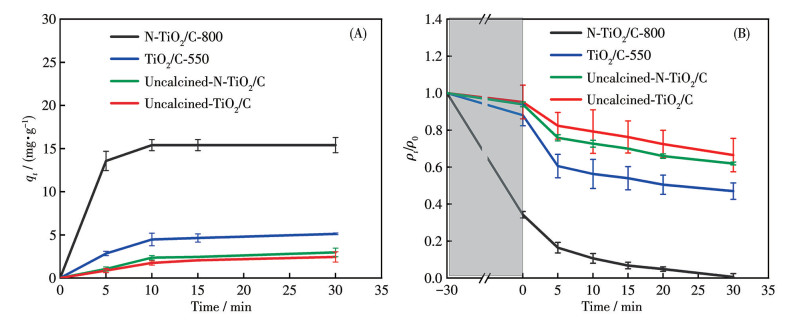
The photocatalytic performance of the N-TiO2/C-800 and TiO2/C-550 composites was assessed using OTC as a model pollutant, in addition to MB, to broaden the scope of the investigation. Initially, adsorption experiments were conducted with OTC solution (20 mg·L-1, 50 mL) and 20 mg of photocatalyst (Fig.7A). N-TiO2/C-800 and TiO2/C-550 composites exhibited a rapid adsorption phase within the first 10 min, followed by equilibrium between 10 and 30 min. The adsorption capacities of N-TiO2/C-800 and TiO2/C-550 were 15.4 and 5.1 mg·g-1, respectively (Table 3). The photocatalytic performance of the N-TiO2/C-800 and TiO2/C-550 composites was evaluated under simulated solar light irradiation after reaching adsorption equilibrium, as shown in Fig.7B. At 30 min, N-TiO2/C-800 achieved a degradation rate of 99.4%, significantly surpassing the degradation rate of TiO2/C-550 (53.0%). Uncalcined N-TiO2/C and TiO2/C composites exhibited lower adsorption capacity and photocatalytic performance compared to their calcined counterparts, N-TiO2/C-800 and TiO2/C-550, as detailed in Table 3. These findings demonstrate that the photocatalytic properties of the composites are effective against MB and OTC, with N-TiO2/C-800 showing superior photocatalytic ability.
 下载:
导出CSV
下载:
导出CSV
| Sample | Adsorption capacity / (mg·g-1) | Degradation rate / % |
| N-TiO2/C-800 | 15.4±0.9 | 99.4±1.8 |
| TiO2/C-550 | 5.1±0.1 | 53.0±4.4 |
| Uncalcined-N-TiO2/C | 3.0±0.5 | 38.1±6.4 |
| Uncalcined-TiO2/C | 2.4±0.6 | 33.5±8.9 |
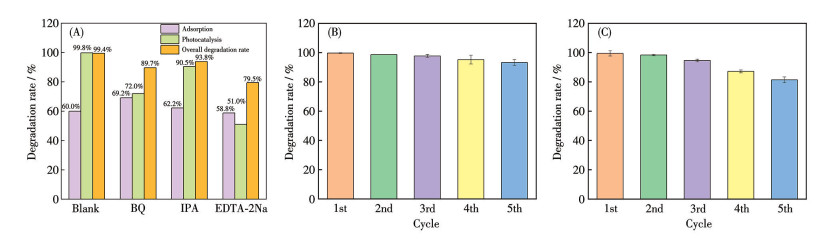
The photocatalytic degradation mechanism of MB (15 mg·L-1, 50 mL) by N-TiO2/C composites was systematically examined by analyzing the active species involved h+, ·O2-, and ·OH, as shown in Fig.8. During the entire catalytic process, BQ, IPA, and Na2EDTA were used as captors for ·O2-, ·OH, and h+, respectively. The adsorption rates during the initial adsorption stage were 69.2%, 62.2%, and 58.8% for each captor, while the degradation rates during the photocatalytic process were 72.0%, 90.5%, and 51.0%, respectively. Under the combined influence of adsorption and photocatalysis, the degradation efficiencies of MB were 89.7%, 93.8%, and 79.5%, respectively. The captors minimally affected adsorption but affected MB degradation. The photocatalytic degradation process was notably inhibited by the addition of Na2EDTA, indicating that h+ is the predominant active species in the degradation of MB. While ·O2- and ·OH contribute to the photocatalytic process, their effects were comparatively minor. The generation of holes facilitates the production of a substantial number of hydroxyl radicals, speeding up the redox reaction and promoting the degradation of organic matter. The stability of the photocatalyst is also a critical factor in evaluating its performance. After five cycles, the degradation efficiency of N-TiO2/C-800 for 20 mg·L-1 MB decreased to 93.2%, while its efficiency for 20 mg·L-1 OTC declined to 81.4%, indicating that N-TiO2/C-800 exhibits excellent stability and reproducibility.
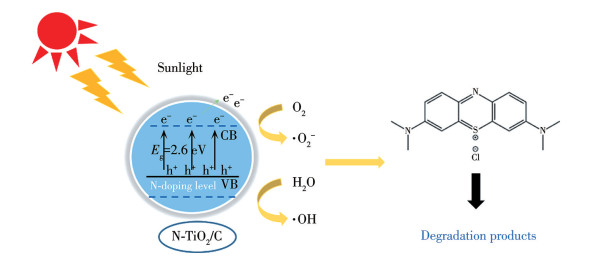
The photocatalytic mechanism diagram of N-TiO2/C-800 is shown in Fig. 9. The photocatalytic process involves a complex interaction among the carrier, catalyst, and contaminant substrate. Upon analysis, the catalytic degradation performance of N-TiO2/C composites on MB is influenced by several factors. (1) The doping of N into the crystal lattice of TiO2 changes the electronic band structure, introduces new energy levels, narrows the band gap, broadens the light absorption range, and shortens the electron transfer process, which is the most important factor in improving photocatalytic activity. (2) The TiO2/carbon-based composites formed by using sawdust as a carbon precursor not only endow the materials with excellent adsorption performance but also have a rich porous structure, which provides channels for electron transfer, inhibits electron-hole recombination, and effectively improves photocatalytic activity. Carbon, as a photosensitizer, can also enhance the absorption of visible light. (3) The material itself has excellent adsorption performance, which effectively absorbs pollutant molecules onto the catalyst surface, avoiding the continuous deactivation of the catalytic process, and accelerating the catalytic process, thereby improving the overall catalytic energy efficiency.
In this study, N-TiO2/C composites were synthesized utilizing sawdust and urea as dual ligands, with Ti4+ serving as the coordination center, through a hydrothermal method. Characterization analyses indicated successful doping into the TiO2 lattice and the presence of carbon on the material′s surface. The bandgap was reduced to 2.60 eV, thereby extending the composite′s absorption range into the visible light region. The prepared N-TiO2/C-800 composites demonstrated exceptional photocatalytic performance, achieving degradation rates of 93.4% for methylene blue (20 mg·L-1, 50 mL) and 99.4% for oxytetracycline (20 mg·L-1, 50 mL) within 30 min. This study provides a novel strategy for the development of multifunctional photocatalytic materials.
WANG W L, KE X. N-doped BC/Ferrite collaborative degradation of antibiotics: Synthesis and mechanism research[J]. Mater. Sci. Semicond. Process., 2025, 194: 109527 doi: 10.1016/j.mssp.2025.109527
RUZIWA D T, OLUWALANA A E, MUPA M, MEILI L, SELVASEMBIAN R, NINDI M M, SILLANPAA M, GWENZI W, CHAUKURA N. Pharmaceuticals in wastewater and their photocatalytic degradation using nano-enabled photocatalysts[J]. J. Water Process. Eng., 2023, 54: 103880 doi: 10.1016/j.jwpe.2023.103880
ZENG D B, YU C L, FAN Q Z, ZENG J L, WEI L F, LI Z S, YANG K, JI H B. Theoretical and experimental research of novel fluorine doped hierarchical Sn3O4 microspheres with excellent photocatalytic performance for removal of Cr (Ⅵ) and organic pollutants[J]. Chem. Eng. J., 2020, 391: 123607 doi: 10.1016/j.cej.2019.123607
WANG F, ZHU Z Z, GUO J. 2D-2D ZnO/N doped g-C3N4 composite photocatalyst for antibiotics degradation under visible light[J]. RSC Adv., 2021, 11(56): 35663-35672 doi: 10.1039/D1RA06607B
DE OLIVEIRA DEMARCO J, HUTCHINSON S L, PARAMESWARAN P, HETTIARACHCHI G, MOORE T. Removal of antibiotics from swine wastewater using an environmentally friendly biochar: Performance and mechanisms[J]. ACS Omega, 2025, 10(8): 7711-7721 doi: 10.1021/acsomega.4c07266
YU C L, HE H B, LIU X Q, ZENG J L, LIU Z. Novel SiO2 nanoparticle-decorated BiOCl nanosheets exhibiting high photocatalytic performances for the removal of organic pollutants[J]. Chin. J. Catal., 2019, 40(8): 1212-1221 doi: 10.1016/S1872-2067(19)63359-0
GUO J L, HUANG M H, MENG L J, JIANG N, ZHENG S Y, SHAO M Y, LUO X B. Synergistic impacts of Cu2+ on simultaneous removal of tetracycline and tetracycline resistance genes by PSF/TPU/UiO forward osmosis membrane[J]. Environ. Res., 2021, 195: 110791 doi: 10.1016/j.envres.2021.110791
LI X, LI J Y, SONG J Y, LI Z Y, YUAN X C, MENG L Y, XU W Z, WANG Q W, YAN Q H, XIN S S, ZHOU C Z, LIU G C, XIN Y J. Fabrication of TiO2/CuFeO2 composites for oxytetracycline degradation through heterogeneous photo-Fenton-like process under visible light[J]. J. Environ. Manage., 2025, 388: 125932 doi: 10.1016/j.jenvman.2025.125932
ARAKI J. Dye adsorption revisited: Application of the cationic dye adsorption method for the quantitative determination of the acidic surface groups of nanocellulose materials[J]. Cellulose, 2021, 28(12): 7707-7715 doi: 10.1007/s10570-021-04035-x
CHAWRABA K, EL MALTI W, AKIL A, HAMIEH M, HAMMOUD M, PATRA D, TOUFAILY J, HIJAZI A. Optimized adsorption of dyes and antibiotics onto natural acacia ataxacantha for water treatment[J]. ACS Omega, 2025, 10: 24847-24861 doi: 10.1021/acsomega.5c02046
VARJANI S, RAKHOLIYA P, NG H Y, YOU S, TEIXEIRA J A. Microbial degradation of dyes: An overview[J]. Bioresour. Technol., 2020, 314: 123728 doi: 10.1016/j.biortech.2020.123728
ALVES FILHO C T, DE ALMEIDA M C, DE SA F P, DE OLIVEIRA T F. Study and construction of a sustainable solar photocatalytic reactor: Indigo carmine blue food dye degradation[J]. Desalin. Water Treat., 2023, 314: 210-218 doi: 10.5004/dwt.2023.30086
SAKARKAR S, MUTHUKUMRAN S, JEGATHEESAN V. Factors affecting the degradation of remazol turquoise blue (RTB) dye by titanium dioxide (TiO2) entrapped photocatalytic membrane[J]. J. Environ. Manage., 2020, 272: 111090 doi: 10.1016/j.jenvman.2020.111090
YU C L, HE H B, FAN Q Z, XIE W Y, LIU Z, JI H B. Novel B-doped BiOCl nanosheets with exposed (001) facets and photocatalytic mechanism of enhanced degradation efficiency for organic pollutants[J]. Sci. Total Environ., 2019, 694: 133727 doi: 10.1016/j.scitotenv.2019.133727
YANG J, YANG R H, HE C, XU C H, XU L Y, HU Z H, WANG W. Novel insights into ammonia nitrogen removal: TiO2-based photocatalysts and potential of intimate coupling biodegradation[J]. J. Environ. Chem. Eng., 2025, 13(2): 115962 doi: 10.1016/j.jece.2025.115962
PAWAR T J, CONTRERAS LOPEZ D, OLIVARES ROMERO J L, VALLEJO MONTESINOS J. Surface modification of titanium dioxide[J]. J. Mater. Sci., 2023, 58(16): 6887-6930 doi: 10.1007/s10853-023-08439-x
LIU X H, YANG Y, LI H P, YANG Z G, FANG Y. Visible light degradation of tetracycline using oxygen-rich titanium dioxide nanosheets decorated by carbon quantum dots[J]. Chem. Eng. J., 2021, 408: 127259 doi: 10.1016/j.cej.2020.127259
SHI Z J, MA M G, ZHU J F. Recent development of photocatalysts containing carbon species: A review[J]. Catalysts, 2018, 9(1): 20 doi: 10.3390/catal9010020
WANG Z J, CHANGOTRA R, DASOG M, SINGH SELOPAL G, YANG J, HE Q S. Carbon quantum dots: Synthesis via hydrothermal processing, doping strategies, integration with photocatalysts, and their application in photocatalytic hydrogen production[J]. Sustain. Mater. Technol., 2025, 44: e01386
VENU SREEKALA S, SREEJA PRAMOD A, PAROLA A, KAZHUTHUTTIL KOCHU J, THOPPIL RAMAKRISHNAN R. Modified bentonite loaded with non-metal doped titanium dioxide for the removal of heavy metal ions and dyes from wastewater[J]. J. Sol‒Gel Sci. Technol., 2025, 114(2): 349-364 doi: 10.1007/s10971-025-06683-y
CHEN F Y, YU C L, WEI L F, FAN Q Z, MA F, ZENG J L, YI J H, YANG K, JI H B. Fabrication and characterization of ZnTiO3/Zn2Ti3O8/ZnO ternary photocatalyst for synergetic removal of aqueous organic pollutants and Cr(Ⅵ) ions[J]. Sci. Total Environ., 2020, 706: 136026 doi: 10.1016/j.scitotenv.2019.136026
ZHANG J J, LI Y X, LI L, LI W L, YANG C F. Dual functional N-doped TiO2-carbon composite fibers for efficient removal of water pollutants[J]. ACS Sustain. Chem. Eng., 2018, 6(10): 12893-12905 doi: 10.1021/acssuschemeng.8b02264
XIONG Z W, MENG Y J, LUO C B, LIU Z Q, LI D Q, LI J. Ti4+- dopamine/sodium alginate multicomponent complex derived N-doped TiO2@carbon nanocomposites for efficient removal of methyle[J]. Int. J. Biol. Macromol., 2023, 243: 125200 doi: 10.1016/j.ijbiomac.2023.125200
TAN B T W, MOHD. RASHID N A, MOHAMAD IDRIS N H, WUN W L, LEE H L. Facile sol-gel synthesis of C, N codoped-TiO2 for efficient degradation of palm oil mill effluent[J]. ACS Omega, 2025, 10(3): 2858-2870 doi: 10.1021/acsomega.4c08813
RAJA A, SELVAKUMAR K, RAJASEKARAN P, ARUNPANDIAN M, ASHOKKUMAR S, KAVIYARASU K, ASATH BAHADUR S, SWAMINATHAN M. Visible active reduced graphene oxide loaded titania for photodecomposition of ciprofloxacin and its antibacterial activity[J]. Colloids Surf. A‒Physicochem. Eng. Asp., 2019, 564: 23-30 doi: 10.1016/j.colsurfa.2018.12.024
THAMARAI P, KAMALESH R, SHAJI A, SARAVANAN A, YAASHIKAA P R, VICKRAM A S. Advanced conversion technologies for resource recovery from waste biomass: Applications and emerging trends[J]. Chemosphere, 2025, 384: 144515 doi: 10.1016/j.chemosphere.2025.144515
ABDU M, WORKU A, BABAEE S, DIALE P, MSAGATI T A M, NURE J F. The development of TiO2-biochar composite material for photodegradation of basic blue 41 and erichrome black T azo dyes from water[J]. Surf. Interfaces, 2025, 62: 106156 doi: 10.1016/j.surfin.2025.106156
SONG Y J, LI H C, XIONG Z W, CHENG L, DU M, LIU Z Q, LI J, LI D Q. TiO2/carbon composites from waste sawdust for methylene blue photodegradation[J]. Diam. Relat. Mat., 2023, 136: 109918 doi: 10.1016/j.diamond.2023.109918
SANTAMARIA L, VICENTE M A, KORILI S A, GIL A. Effect of the preparation method and metal content on the synthesis of metal modified titanium oxide used for the removal of salicylic acid under UV light[J]. Environ. Technol., 2018, 41(16): 2073-2084
MOHAMED F, ABUKHADRA M R, SHABAN M. Removal of safranin dye from water using polypyrrole nanofiber/Zn-Fe layered double hydroxide nanocomposite (Ppy NF/Zn-Fe LDH) of enhanced adsorption and photocatalytic properties[J]. Sci. Total Environ., 2018, 640-641: 352-363
LI J, YANG Z L, DING T, SONG Y J, LI H C, LI D Q, CHEN S, XU F. The role of surface functional groups of pectin and pectin-based materials on the adsorption of heavy metal ions and dyes[J]. Carbohydr. Polym., 2022, 276: 118789 doi: 10.1016/j.carbpol.2021.118789
ZHANG W Y, YANG Y N, XIA R Q, LI Y C, ZHAO J Q, LIN L, CAO J M, WANG Q H, LIU Y, GUO H W. Graphene-quantum-dots-induced MnO2 with needle-like nanostructure grown on carbonized wood as advanced electrode for supercapacitors[J]. Carbon, 2020, 162: 114-123 doi: 10.1016/j.carbon.2020.02.039
DJELLABI R, YANG B, WANG Y, CUI X Q, ZHAO X. Carbonaceous biomass-titania composites with Ti—O—C bonding bridge for efficient photocatalytic reduction of Cr(Ⅵ) under narrow visible light[J]. Chem. Eng. J., 2019, 366: 172-180 doi: 10.1016/j.cej.2019.02.035
HUI K C, ANG W L, SAMBUDI N S. Nitrogen and bismuth-doped rice husk-derived carbon quantum dots for dye degradation and heavy metal removal[J]. J. Photochem. Photobiol. A‒Chem., 2021, 418: 113411 doi: 10.1016/j.jphotochem.2021.113411
VIJAYA Y, POPURI S R, REDDY A S, KRISHNAIAH A. Synthesis and characterization of glutaraldehyde-crosslinked calcium alginate for fluoride removal from aqueous solutions[J]. J. Appl. Polym. Sci., 2011, 120(6): 3443-3452 doi: 10.1002/app.33375
DIVYASRI Y V, REDDY N L, LEE K, SAKAR M, RAO V N, VENKATRAMU V, SHANKAR M V, REDDY N C G. Optimization of N doping in TiO2 nanotubes for the enhanced solar light mediated photocatalytic H2 production and dye degradation[J]. Environ. Pollut., 2021, 269: 116170 doi: 10.1016/j.envpol.2020.116170
LUO H, YU S L, ZHONG M, HAN Y Q, SU B T, LEI Z Q. Waste biomass-assisted synthesis of TiO2 and N/O-contained graphene-like biochar composites for enhanced adsorptive and photocatalytic performances[J]. J. Alloy. Compd., 2022, 899: 163287 doi: 10.1016/j.jallcom.2021.163287
GUO Y J, CHENG W, LIU P S. Porous ceramic foam loading titanium dioxide for photocatalytic degradation of the methyl orange solution[J]. Multidiscip. Model. Mater. Struct., 2019, 15(6): 1366-1378 doi: 10.1108/MMMS-03-2019-0049

Figure 1 (A) FTIR spectra of the urea, Uncalcined-N-TiO2/C, N-TiO2/C-500 and N-TiO2/C-800; (B) PXRD patterns of N-TiO2/C composites

Figure 2 XPS spectra of N-TiO2/C: (A) survey spectra; (B) high-resolution C1s spectra; (C) high-resolution O1s spectra; (D) high-resolution Ti2p spectra; high-resolution N1s spectra of (E) N-TiO2/C-800 and (F) N-TiO2/C-500

Figure 3 UV-Vis DRS spectra of (A) N-TiO2/C-800 and (B) N-TiO2/C-500 (inset: Eg estimated by the Kubelka-Munk method); TG-DTG curves of (C) N-TiO2/C-800 and (D) N-TiO2/C-500; Nitrogen adsorption-desorption isotherms of (E) N-TiO2/C-800 and (F) N-TiO2/C-500 (inset: pore size distribution)

Figure 4 SEM images of (A) N-TiO2/C-800 and (B) N-TiO2/C-500; (C) SEM images of N-TiO2/C composites before calcination; (D, E, F) Partial enlargement of A, B, and C, respectively; (G) EDS spectra of N-TiO2/C-800 and (H) element mapping of C, O, Ti, and N; TEM images of (I) N-TiO2/C-800 and (J) N-TiO2/C-500; (K, L) Partial enlargement of I and J, respectively

Figure 5 Kinetics of adsorption of MB by N-TiO2/C-800 and N-TiO2/C-500: (A) relation between the contact time and adsorption capacity; (B) linear fitting for pseudo-first-order model; (C) linear fitting for pseudo-second-order model; (D) linear fitting for intra-particle diffusion model

Figure 6 (A) Photocatalytic activities of the composites with different nitrogen sources to MB; (B) Photocatalytic activities of Uncalcined-N-TiO2/C, Uncalcined-TiO2/C, and blank to MB; (C) Plots of ρt/ρ0 vs t and (D) photocatalytic activities for N-TiO2/C-800, N-TiO2/C-500, and blank to MB within 70 min; (E) Photocatalytic activities of N-TiO2/C-800 and TiO2/C-550 composites to MB within 30 min; (F) Linear fitting for pseudo-first-order kinetic models of MB degradation on N-TiO2/C-800, N-TiO2/C-500, and TiO2/C-550

Figure 7 Photocatalytic performance of N-TiO2/C-800, TiO2/C-550, Uncalcined-N-TiO2/C, and Uncalcined-TiO2/C composites: (A) relationship between contact time and adsorption capacity; (B) plots of ρt/ρ0 vs t for the samples to OTC (20 mg·L-1, 50 mL)

Figure 8 (A) Trapping experiment results for degradation of MB by N-TiO2/C-800 under the light irradiation; Cycle experiment results of photodegradation of (B) MB and (C) OTC by N-TiO2/C-800

Figure 9 Schematic diagram of the mechanism for photocatalytic MB degradation by N-TiO2/C-800
Table 1. Surface areas, pore volumes, and average pore sizes of N-TiO2/C-800 and N-TiO2/C-500
| Sample | SBET / (m2·g-1) | Pore volume / (cm3·g-1) | Average pore size / nm |
| N-TiO2/C-800 | 157 | 0.127 4 | 6.163 9 |
| N-TiO2/C-500 | 137 | 0.102 4 | 5.566 3 |
 下载: 导出CSV
Table 2. Kinetic parameters for MB adsorption on N-TiO2/C-800
| Kinetic model | Parameters |
| Pseudo-first-order | qe, cal=38.8 mg·g-1, k1=0.05 20 min-1, R2=0.524 85 |
| Pseudo-second-order | qe, cal=35.6 mg·g-1, k2=0.027 7 g·mg-1·min-1, R2=0.999 36 |
| Intra-particle diffusion | Ci=36.6 mg·g-1, kid=0.808 mg·g-1·min-0.5, R2=0.923 47 |
下载: 导出CSV
Table 3. Adsorption capacity and degradation rate within 30 min of the samples
| Sample | Adsorption capacity / (mg·g-1) | Degradation rate / % |
| N-TiO2/C-800 | 15.4±0.9 | 99.4±1.8 |
| TiO2/C-550 | 5.1±0.1 | 53.0±4.4 |
| Uncalcined-N-TiO2/C | 3.0±0.5 | 38.1±6.4 |
| Uncalcined-TiO2/C | 2.4±0.6 | 33.5±8.9 |
下载: 导出CSV

 扫一扫看文章

扫一扫关注我们