Figure 1.
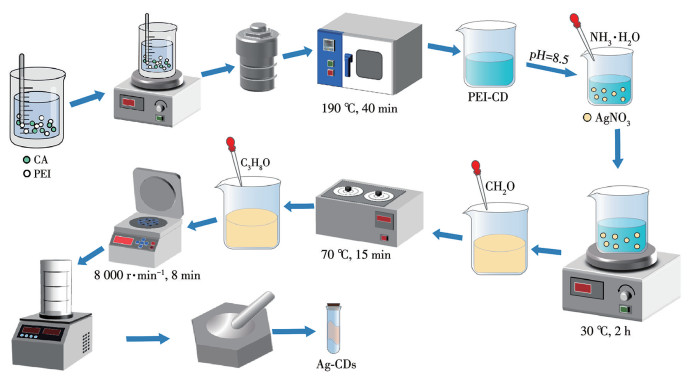
Preparation process of Ag-CDs
Silver-doped antimicrobial fluorescent carbon dots: Dual properties of metal ion detection and antibacterial
Jiaxin LU , Yifu QIAO , Xing QIANG , Yong GAO , Ziya LIU , Manying ZHANG

At present, the aquatic environment has been increasingly contaminated by heavy metals and pathogenic bacteria due to inadequate wastewater treatment, jeopardizing human well-being and ecological homeostasis[1-2]. Conventional water treatment methodologies, including distillation, chemical oxidation, and activated carbon adsorption, are constrained by drawbacks such as exorbitant operational costs, elevated risks of secondary contamination, and protracted treatment durations. Against this backdrop, membrane separation technology stands out as a viable solution due to its high efficiency, low energy consumption, and easy scalability[3]. However, membrane fouling, especially biological biofouling, is still a key issue that restricts its rapid development. Therefore, the development of a new anti-biofouling nanocomposite membrane with strong inhibition, killing, and anti-adhesion effects on bacteria is imminent[4-6]. Central to the fabrication of antifouling membrane materials is the innovation of novel antibacterial agents.
In recent years, fluorescent carbon dots (CDs) have gained prominence as attractive materials for environmental contaminant sensing and antimicrobial uses, owing to their outstanding photoluminescent properties, biocompatibility, and surface modifiability[7-10]. Cui et al.[11] investigated the mild antimicrobial CDs with Fe3+ nutrient competitiveness. The Cu-CDs developed by Wang et al.[12] possess peroxidase-like activity. They trigger oxidative stress and membrane damage by catalyzing redox reactions of endogenous H2O2 in bacteria and depleting glutathione, thereby exerting excellent antibacterial efficacy. Li et al.[13] fabricated peroxidase-mimetic copper-doped CDs (CuCD1) with good biofilm penetration. These dots can generate hydroxyl radicals in response to the microenvironment, and when embedded in hydrogels, they achieve both biofilm elimination and wound healing promotion. Bijoy et al.[14] prepared biomass-derived carbon quantum dots that have great potential for environmental remediation, but with limitations such as a single antimicrobial mechanism in microbial disinfection, a narrow range of optical response, a single function, and controversial biocompatibility[15]. In metal ion sensing, researchers have realized highly selective detection of iron ions[16-17] and cobalt ions[18]—vital trace elements in biological systems—via functional group modification on CD surfaces. Aberrant Fe3+ homeostasis is associated with pathologies such as anaemia, Alzheimer′s disease, and oncological disorders[19-20]. Hence, the prompt and precise quantification of Fe3+ is pivotal for the early prognosis of such pathologies. Contemporary analytical techniques for Fe3+ detection encompass inductively coupled plasma-mass spectrometry (ICP-MS)[21], colourimetric assays[22], and fluorometric sensors[23]. The fluorometric nanoprobe approach has been widely explored due to its remarkable merits in metal ion sensing and bioimaging, such as negligible biotoxicity, exceptional sensitivity, and real-time monitoring capabilities.
Concurrently, silver nanoparticles (AgNPs) have emerged as versatile building blocks for fabricating diverse antimicrobial composites, particularly in the development of antifouling membrane materials, owing to their broad-spectrum bactericidal efficacy[24-26]. However, their susceptibility to oxidation and loss of antimicrobial ability has greatly limited their further applications in many fields[27]. By doping AgNPs into the CDs skeleton to construct composites, the inhibitory ability of the product can be enhanced and its oxidation can be prevented, synergizing the fluorescent tracer function of CDs with the antimicrobial property of silver, and thus it has become a hotspot of current research. Wang et al.[28] synthesized AgNPs/CDs composites using CDs as capping agents. These composites exhibited remarkable synergistic antibacterial effects by inducing oxidative stress through reactive oxygen species (ROS) mediation, holding promising applications in the antibacterial field. Aldakhil et al.[29] developed lignin-based silver-doped CDs, reporting a mean particle diameter of (3.50±0.89) nm and a fluorescence quantum yield of 28.1%, which exhibited favourable photoluminescent performance. Li et al.[30] harnessed carbohydrate-based CDs as both reductants and capping agents to fabricate silver-carbon nanohybrids (Ag-C NHs). Following a 6 h incubation period, these nanohybrids exhibited potent bactericidal activity against at least six common bacterial species. Nevertheless, there are still relatively few papers that conduct detailed research on the antibacterial performance and metal ion detection performance of silver-doped CD materials.
In this work, antibacterial silver-doped fluorescent CDs (Ag-CDs) were prepared through a hydrothermal method. Their structural and photophysical attributes were systematically characterized. Additionally, a comprehensive investigation was performed on their utility for the quantitative determination of Fe3+. Additionally, the antimicrobial mechanisms and bactericidal activities of Ag-CDs were systematically investigated and hypothesized. This nanomaterial is envisioned as a promising candidate for mitigating water contamination challenges. In prospective applications, it may also be integrated into next-generation membrane fabrication to combat biofouling issues.
Polyethyleneimine (PEI, ≥99%, MW=10 000), formaldehyde (CH2O), isopropyl alcohol (C3H8O, ≥99.7%), ethanol (C2H6O), potassium chloride (KCl), sodium chloride (NaCl), anhydrous lithium chloride (LiCl), indium(Ⅲ) chloride (InCl3), iron(Ⅲ) chloride hexahydrate (FeCl3·6H2O), ferrous chloride (FeCl2), copper(Ⅱ) chloride (CuCl2), zinc chloride (ZnCl2), chromium(Ⅲ) chloride (CrCl2), nickel(Ⅱ) chloride (NiCl2), aluminum chloride hexahydrate (AlCl3·6H2O), and magnesium chloride hexahydrate (MgCl2·6H2O) were purchased from Shanghai McLean Biochemistry Technology Co. Citric acid (CA, C6H8O7), crystal violet nonahydrate (C25H30N3Cl·9H2O) were purchased from Jiangsu Qiangsheng Functional Chemical Co. Silver nitrate (AgNO3), dipotassium hydrogen phosphate (K2HPO4), potassium dihydrogen phosphate (KH2PO4), ammonium sulfate ((NH4)2SO4), sodium citrate (98%), magnesium sulfate heptahydrate (MgSO4·7H2O), and gentamicin sulfate were purchased from Sinopharm Chemical Reagent Co. Peptone, yeast extract, agar were purchased from OXOID, UK. ROS detection kit (1000T), superoxide dismutase (SOD) activity assay kit (50T/24S), and 2,3,5-triphenyl tetrazolium chloride (TTC) were purchased from Beijing Lanjieke Technology Co.
In this experiment, Ag-CDs were synthesised using a hydrothermal protocol[31]. Initially, a PEI-CD precursor solution was fabricated, followed by the addition of formaldehyde to reduce silver ions into nanosilver particles anchored onto the carbon core surface, thereby forming the final Ag-CDs architecture. The experimental workflow is described below (Fig. 1).
0.6 g of PEI, 2.0 g of CA, and 100 mL of deionised water were combined to prepare a mixture, which was followed by stirring. Once the solution was completely dissolved, it was transferred into a high-pressure autoclave, and the autoclave was placed in an oven at 190 ℃ for 40 min, after being naturally cooled to room temperature (RT), a transparent yellowish liquid was retrieved as the PEI-CD solution (when the liquid PEI-CD was centrifuged and dried, it was converted into solid PEI-CD). The pH of the PEI-CD solution (with a mass concentration of 0.026 g·mL-1) was adjusted to 8.5 using aqueous ammonia (NH3·H2O). Subsequently, 0.1 g of AgNO3 was added to 60 mL of the pH=8.5 PEI-CD solution, and the mixture was stirred at RT for 2 h, followed by the introduction of 100 μL of CH2O. The mixture was heated in a 70 ℃ water bath for 15 min. Following this, 10 mL of C3H8O was added to initiate precipitation, and the mixture was centrifuged at 8 000 r·min-1 for 8 min. After the supernatant was removed, the bottom precipitate was dried and ground into a solid powder, and Ag-CDs were obtained.
Ultraviolet-visible (UV-Vis) absorption spectra were recorded using a D-7 UV-Vis spectrophotometer (Nanjing Feller Instrument Co., Ltd.). Fluorescence spectra of Ag-CDs, selective binding of Ag-CDs to Fe3+, and intracellular ROS levels were analyzed via an F-2700 fluorescence spectrophotometer (Hitachi, Japan). Bacterial growth kinetics and antimicrobial susceptibility were assessed with an A-5082 full-wavelength scanning microplate reader (Nanjing Meiyixing Biotechnology Co., Ltd.). The morphology of the Ag-CDs was analyzed using a G2 F20 S-Twin field emission electron microscope (FEI, USA). X-ray diffraction (XRD) patterns were recorded with an APEX Ⅱ DUO X-ray diffractometer (Bruker GmbH, Germany) using Cu Kα radiation (λ=0.154 18 nm) at 40 kV and 40 mA, with a 2θ scanning range of 10°-80°. Fourier transform infrared (FTIR) spectroscopy was carried out using a Nicolet iS50 spectrometer (Thermo Fisher, USA). X-ray photoelectron spectroscopy (XPS) measurements were conducted on a Kα spectrometer (Thermo Scientific, USA). Scanning electron microscopy (SEM) images were recorded using a S-3400 N scanning electron microscope (Shanghai Aiyitong Network Technology Co., Ltd.).
Fe3+ can quench the fluorescence of Ag-CDs by coordinating with their surface functional groups, inducing electron transfer, and possibly via the inner filter effect. Based on this, the selectivity, anti-interference performance, and quantitative detection capability of Ag-CDs for Fe3+were explored.
To test the selective response of Ag-CDs to Fe3+, different metal ion solutions (K+, Na+, Li+, In3+, Fe3+, Al3+, Mg2+, Fe2+, Cu2+, Zn2+, Cr3+, Co2+, Ag+, Ni2+) at a concentration of 0.5 mmol·L-1 and 5 mg·mL-1 of Ag-CDs solution were prepared. Equal volumes of the Ag-CDs solution and various metal ion solutions were thoroughly mixed in centrifuge tubes, and the resulting fluorescence emission was recorded using a spectrofluorometer.
To test the interference of Ag-CDs with Fe3+ and assess potential interferences from other metal ions, stock solutions of various cations (K+, Na+, Li+, In3+, Fe3+, Al3+, Mg2+, Fe2+, Cu2+, Zn2+, Cr3+, Co2+, Ag+, Ni2+) were prepared at 0.5 mmol·L-1, along with a 5 mg·mL-1 Ag-CDs solution. The 0.5 mmol·L-1 Fe3+ solution was first mixed 1∶1 by volume with ultrapure water (blank group) or the target metal ion solution (other groups), followed by a subsequent 1∶1 volumetric addition of Ag-CDs solution. The resulting mixtures were homogenized, and fluorescence emission spectra were acquired using a spectrofluorometer.
To evaluate the concentration-dependent response of Ag-CDs to Fe3+, a series of Fe3+ solutions with concentrations ranging from 0 to 1 000 μmol·L-1 were sequentially introduced into the Ag-CDs solution in a 1∶1 volume ratio. The fluorescence emission of the resultant mixtures was then recorded.
The antimicrobial efficacy of Ag-CDs was evaluated against representative Escherichia coli (EC), and Staphylococcus aureus (SA). In all experiments, strains were cultured in Lysogeny Broth (LB).
Stock solutions of Ag-CDs were prepared by performing two-fold serial dilutions, resulting in mass concentrations spanning from 1 000 μg·mL-1 down to 31 μg·mL-1. Subsequently, 100 μL of every dilution was combined in a 1∶1 volume ratio with LB medium, and the mixtures were dispensed in triplicate into 96-well plates. Each well was then supplemented with 100 μL of pre-cultivated bacterial suspension. Thereafter, EC or SA bacterial suspensions (1×10⁷ CFU·mL-1) were inoculated into the respective wells. Concurrently, a control group was established using 100 μL of LB medium inoculated with EC bacteria at the same density (1×10⁷ CFU·mL-1). Using a microplate reader, the optical density at 600 nm (OD600) of each well was monitored hourly for 12 h consecutively to assess the bacteriostatic activity of varying Ag-CDs concentrations. Growth curves were then plotted to determine the MIC.
The inoculated EC or SA bacterial solution with a concentration of about 1×10⁷ CFU·mL-1 was extracted (100 μL) and spread on an LB solid plate. Four holes with a diameter of 6 mm were cut into the plate, and 100 μL each of Ag-CDs, PEI-CD, and PEI solutions (mass concentration: 2.5 mg·mL-1), as well as 100 μL of sterile water, were added into the four holes, respectively. Four holes were chiseled in the same way, and 100 μL of Ag-CDs solution at different mass concentrations was placed into the plate. Finally, the LB solid plate was placed in the incubator at 37 ℃, and after 24 h of incubation, the plate was removed, and the size of the inhibition ring was observed to determine the antimicrobial material′s inhibition effect.
The crystalline violet staining technique was used in this experiment. Each well of a 96-well plate was sequentially supplemented with 200 μL of LB broth and 100 μL of EC or SA bacterial suspension, followed by incubation at 37 ℃ for 48 h. The planktonic cells were discarded, after which the adherent biofilms were washed three times with phosphate-buffered saline (PBS) to remove any remaining culture medium. Post-incubation, the planktonic bacteria were aspirated, and the adherent biofilms underwent three rinses with PBS to eliminate residual media. Subsequently, different mass concentrations of Ag-CDs were applied to the wells, and the microtiter plates were maintained at 37 ℃ for 24 h. Following supernatant removal, the biofilms were rinsed three times with PBS, air-dried at RT, and fixed using 99% C2H6O. After a subsequent RT drying step, the biofilms were incubated with a crystal violet solution at a mass concentration of 1 mg·mL-1 for 10 min. Unbound dye was eliminated by performing three PBS washes, after which the plates were inverted to facilitate drying. The crystal violet bound to the biofilm was solubilized with 95% C2H6O, and 100 μL of the resulting solution was transferred to a new microplate[32]. The absorbance at 590 nm was then measured using a microplate spectrophotometer. A CD-free medium served as the control group, with its biofilm disruption rate (VDr) predefined as 0%. Calculations were performed using the following formula:
|
|
(1) |
where OD590control is the absorption value at 590 nm for biofilm before Ag-CDs treatment, OD590sample is the absorption value at 590 nm of the biofilm after Ag-CDs treatment.
A 1 000 μg·mL-1 stock solution of Ag-CDs was prepared. In centrifuge tube A, 10 mL of this stock was mixed with 10 mL of EC bacterial suspension, while centrifuge tube B received 10 mL of Ag-CDs stock and 10 mL of SA bacterial suspension. Meanwhile, 20 mL of EC and SA bacterial suspensions were placed in centrifuge tubes C and D as controls. After a 6 h incubation period, the samples underwent centrifugation at 8 000 r·min-1 for 7 min to remove the supernatant. The resulting pellets were subsequently rinsed three times with PBS and fixed using 2.5% glutaraldehyde for 5 h. Excess glutaraldehyde was removed, and the pellets were washed three times with PBS. The samples were then dehydrated using a gradient of 30%, 50%, 70%, 90%, and 100% (volume fraction) C2H6O, dried via supercritical carbon dioxide, gold-sprayed, and observed for bacterial cell morphology by SEM[33].
Gentamicin, a common antibiotic, was selected as a control for Ag-CDs in this study. A standard MIC assay was used to quantify the MICs of gentamicin and Ag-CDs. Bacterial cultures were adjusted to one-half the MIC concentration and subsequently re-exposed to gentamicin or Ag-CDs, following the same protocol. Fresh MIC readings were documented post-24 h incubation[34]. The same experiment was repeated once a day for inoculation passages up to the 28th generation, and the changes in MIC values were observed and recorded for each generation.
Intracellular ROS levels were assessed via real-time fluorescence monitoring using a redox-sensitive probe, which enabled dynamic tracking of oxidative stress[35]. The ROS detection reagent mixture was placed in an orbital shaker set at 37 ℃ and agitated for 30 min. 2′,7′-dichlorofluorescein (DCF) fluorescence was then quantified via spectrofluorometry at excitation and emission wavelengths of 488 and 525 nm, respectively[36]. The content of intercellular ROS was proportional to the measured DCF fluorescence intensity.
SOD activity assay was used to quantitatively assess its ability to scavenge free radicals by inhibiting the rate of superoxide anion-mediated oxidation reactions[37]. An appropriate amount of reagent in the SOD kit was mixed with Ag-CDs solution, and after 30 min of water bath at 37 ℃, the absorbance at 560 nm was measured in a glass cuvette, and the result was measured. The inhibition percentage was calculated and plotted.
TTC undergoes a colourimetric reaction with mitochondrial succinate dehydrogenase in viable cells, yielding a red formazan precipitate. The quantity of formazan produced is directly proportional to cellular metabolic activity, enabling the assessment of cell (e.g., bacterial) viability via the TTC reduction assay[38-39]. Bacterial suspensions (1×10⁷ CFU·mL-1) were exposed to Ag-CDs solutions at different mass concentrations, with the solutions formulated in PBS (pH=7.4). Following a 2 h co-incubation, 1 mL of 4% TTC-glucose reagent was introduced. Samples were then shielded from light using aluminium foil and incubated at 37 ℃ with shaking. Cellular metabolic activity was determined via colourimetric analysis of formazan production.
Fig. 2a suggests that the Ag-CDs solution exhibited a notable absorption feature at 429 nm, potentially associated with the characteristic absorption of AgNPs[40]. This result confirms the successful incorporation of silver into the CD matrix. The as-synthesized Ag-CDs exhibited a brownish-yellow hue under ambient light and emitted blue fluorescence upon UV irradiation (Inset in Fig. 2a). Fig. 2b indicates that the Ag-CDs exhibited an optimal excitation wavelength of 365 nm, with the corresponding emission wavelength being 429 nm, at which strong fluorescence emission was observed.
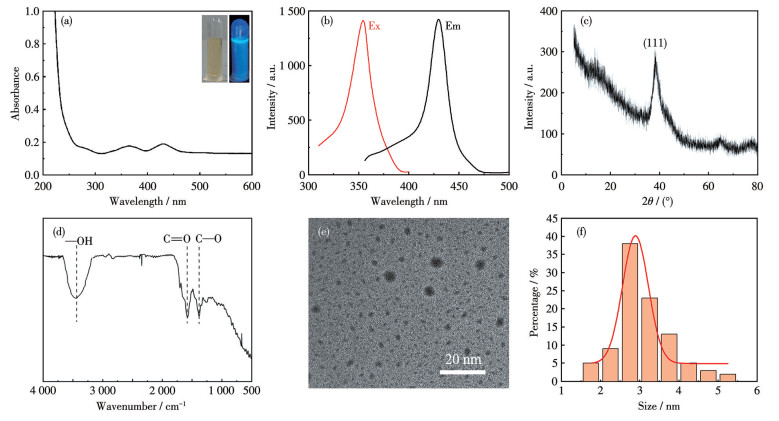
Fig. 2c displays the XRD patterns of the Ag-CDs. As shown, the Ag-CDs had an obvious broad peak near 38.1°, which corresponds to the (111) crystallographic diffraction peak of metallic silver, proving that the fabricated Ag-CDs material was successfully loaded with silver, and the broadened peak indicated that the particle size was small and in the nanometer scale.
Fig. 2d shows that the absorption bands in the 3 000-3 600 cm-1 range correspond to the stretching vibrations of hydroxyl groups (—OH, from CA) in the Ag-CDs matrix. The absorption bands in the 1 500-1 700 cm-1 range are attributed to C=O (carbonyl) stretching vibrations, while those in the 1 000-1 300 cm-1 range correspond to C—O stretching modes. These vibrations are characteristic of the chemical linkages present in CA and PEI, thereby confirming the formation of relevant functional groups. The absorption peaks in this region can help to determine the existence of related structures. The peaks in the 500-1 000 cm-1 region may be the interaction between Ag and ligands or the bending vibration of some complex groups. In silver-doped systems, silver ions introduced by AgNO3 may coordinate with some groups in PEI and CA, and characteristic absorption peaks may occur in this region.
Fig. 2e shows the TEM images, in which it could be seen that the Ag-CDs were spherical, the particles were more dispersed, and there was no obvious agglomeration phenomenon. The particle size ranged from 2 to 5 nm (Fig. 2f).
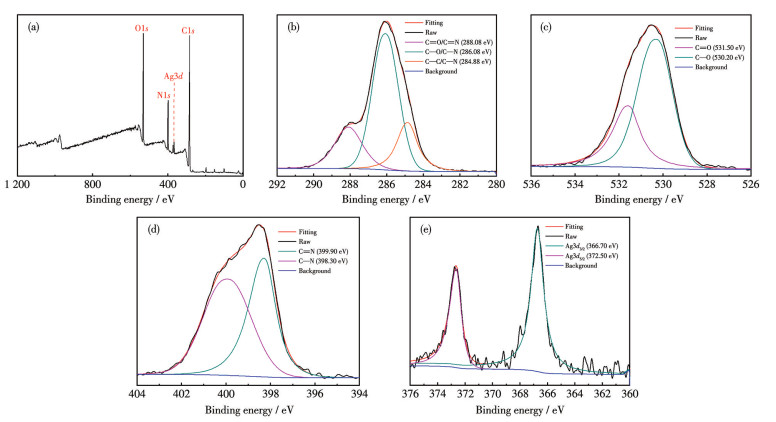
As depicted in Fig. 3, the XPS survey spectrum (Fig. 3a) confirmed the presence of four elements (C, N, O, and Ag) in the sample. Analysis of the high-resolution C1s spectrum (Fig. 3b) revealed multiple distinct peaks at 284.88, 286.08, and 288.08 eV, which are attributable to the C—C/C—N, C—O/C—N, and C=O/C=N bonding configurations in the Ag-CDs, respectively. Analysis of Fig. 3c revealed that the high-resolution O1s spectra exhibited two distinct peaks at 531.50 and 530.20 eV, corresponding to the C=O and C—O functional groups in the Ag-CDs[41]. Analysis of the N1s high-resolution spectra (Fig. 3d) identified two distinct peaks at 398.30 and 399.90 eV, attributable to C—N and C=N bonding configurations, respectively[42]. Meanwhile, deconvolution of the Ag3d high-resolution spectrum (Fig. 3e) confirmed the presence of two characteristic peaks at 366.70 and 372.50 eV, corresponding to the binding energies of Ag0 [43].
Fluorescence quenching experiments were conducted using the Ag-CDs solution as a control to monitor the effects of metal ions. Fig. 4a demonstrates that introducing Fe3+ caused a significant decrease in the emission intensity of Ag-CDs. Fig. 4b shows that F0 and F represent the peak fluorescence intensities of the Ag-CDs solution at the 429 nm emission wavelength before and after adding metal ions, respectively. Notably, the F/F0 ratio for the Fe3+ solution approached zero, indicating the Ag-CDs exhibited selective responsiveness toward Fe3+. As shown in Fig. 4c, under irradiation with a 365 nm UV lamp, both the Ag-CDs solution and the mixed solutions of Ag-CDs with metal ions emitted visible blue fluorescence, except for the mixed solution of Ag-CDs with Fe3+, which showed no fluorescence effect.
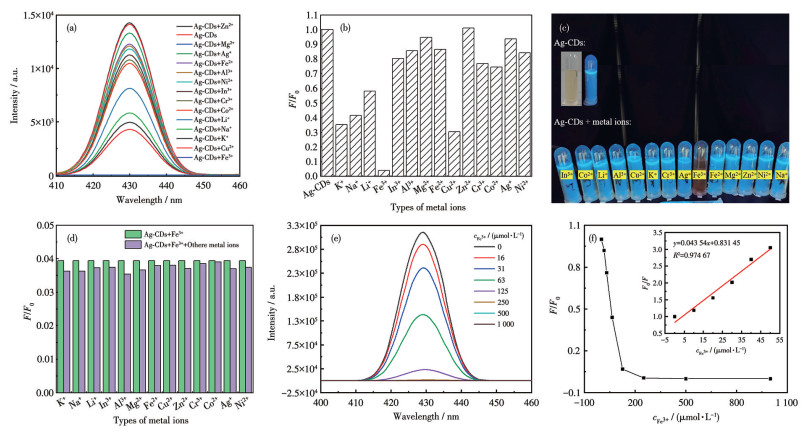
To assess potential interference from other metal ions with Fe3+, multiple metal species were added to monitor fluorescence intensity changes of the system. Fig. 4d illustrates the emission intensities of the Ag-CDs solution at an emission wavelength of 429 nm before and after metal ion addition. These data demonstrated that mixing with other metal ions induced negligible changes in fluorescence intensity, indicating no interference with the Fe3+-triggered fluorescence quenching. This confirms that the Ag-CDs exhibit robust anti-interference capability for Fe3+ detection in multi-ion environments, highlighting their high practical utility.
Fe3+ solutions with concentrations ranging from 0 to 1 000 μmol·L-1 were introduced into the Ag-CDs dispersion. A fluorescence spectrophotometer set at an emission wavelength of 429 nm monitored fluorescence variations induced by the interaction of Fe3+ and Ag-CDs. Fig. 4e demonstrates that the emission intensity of the Ag-CDs+Fe3+ mixture declined with increasing Fe3+ concentration, establishing a negative correlation between Fe3+ concentration and Ag-CDs fluorescence. This enables quantitative detection of Fe3+. Fig. 4f further investigates the linear dependency of F/F0 on Fe3+ concentration.
Eq.2 corresponds to the Stern-Volmer equation, a frequently employed model for characterizing fluorescence quenching. It demonstrates a linear correlation between fluctuations in fluorescence intensity and the concentration of quenching agents. The limit of detection (LOD) was derived from the Stern-Volmer equation (Eq.3)[44].
|
|
(2) |
|
|
(3) |
In this context, KSV denotes the Stern-Volmer quenching constant, while
The linear regression equation in the inset of Fig. 4f was y=0.043 54x+0.831 45 (with a coefficient of determination R2=0.974 67). Leveraging Eq.2 and 3, the Fe3+ LOD was quantified as 5.68 μmol·L-1. The interpolated plots exhibited a strong linear correlation between relative fluorescence intensities and Fe3+ concentrations in the range of 0-50 μmol·L-1.
By analyzing the inhibition zone diameters in Fig. 5a and 5b, Ag-CDs and PEI exhibited stronger antimicrobial activity against EC than SA. Distinct inhibition zones appeared around the circular wells containing Ag-CDs, PEI-CD, and PEI at a 2.5 mg·mL-1. Notably, Ag-CDs produced larger inhibition zones with more pronounced antimicrobial effects. The reason may be due to the silver content in Ag-CDs, or it may be that under the same concentration conditions, PEI is less soluble, while Ag-CDs can be well dissolved in water. As a control group, the blank control had no inhibitory ring near the aperture. Fig. 5c and 5d show a clear trend: the higher the Ag-CDs mass concentration, the larger the inhibition zone diameter. This demonstrates that varying Ag-CDs mass concentrations significantly impact the antimicrobial activity against EC and SA. It is worth noting that the antibacterial properties of Ag-CDs were positively correlated with their mass concentrations.
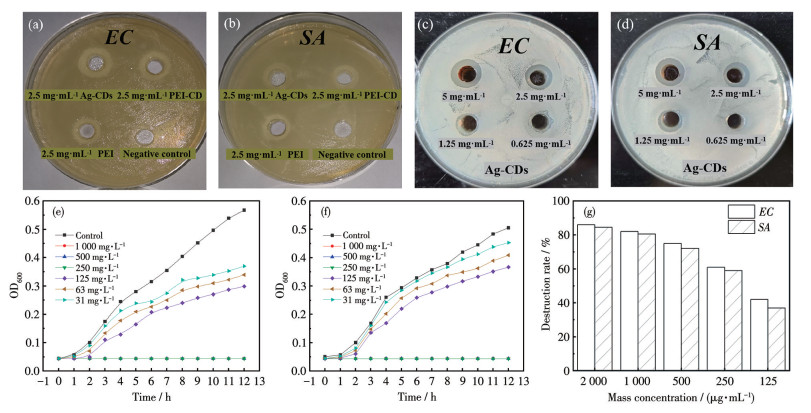
Herein, the MIC and growth curve assays were used to evaluate the antibacterial effects of Ag-CDs against EC and SA. Ag-CDs demonstrated MIC of 250 μg·mL-1, a mass concentration, for both EC and SA. Compared with various Ag-CDs in Table 1, the antibacterial effect of this study was better, which may be attributed to the doping of silver. Fig. 5e and 5f show the growth curves of EC and SA, respectively. From the figures, it was observable that following incubation, Ag-CDs showed inhibitory effects on both bacteria. As the mass concentration of Ag-CDs increased, these inhibitory effects were enhanced. At an Ag-CDs mass concentration of 250 μg·mL-1, Ag-CDs exerted a remarkable inhibitory influence on the growth of both EC and SA. However, analysis of growth curves revealed stronger inhibition of EC at the same mass concentration. These findings suggest that Ag-CDs hold promise for application as antimicrobial agents in antibacterial materials.
 下载:
导出CSV
下载:
导出CSV
| Comparative material | Main raw materials | MIC | Ref. |
| Ag-CDs | CA | 125 and 250 μg·mL-1 against EC and SA, respectively | This work |
| R-CDs | Rhodiola | 0.7 mg·mL-1 against EC and SA | [45] |
| CDs | Banana peels | 3.125 mg·mL-1 against SA | [46] |
| ZnO@CQDs | Coconut water | 6 and 8 mg·mL-1 against EC and SA, respectively | [47] |
| N, NS, and NB-CDs | Glucosamine hydrochloride | 300 μg·mL-1 against EC | [48] |
| Green CDs | Honey, garlic, and carrot | 1.8 mg·mL-1 against EC and SA | [49] |
This study utilized the crystal violet staining assay to assess the capacity of Ag-CDs to inhibit bacterial biofilm formation. As shown in the experimental results presented in Fig. 5g, upon increasing the Ag-CDs mass concentration to 2 000 μg·mL-1, the biofilm disruption rates for EC and SA reached 85.92% and 84.5%, respectively. The results further reveal that the inhibitory ability of Ag-CDs was positively correlated with the concentration, with the inhibitory effect on biofilm becoming more pronounced as the concentration gradually increased. This suggests that at such a high mass concentration, the formation and development of both EC and SA biofilms are significantly impeded. In overall comparison, Ag-CDs demonstrate a superior destruction effect on EC biofilm.
EC and SA were co-incubated with Ag-CDs and gentamicin, and the MICs of the two agents against both bacteria after 28 passages of incubation were determined. The findings are presented in Fig. 6a and 6b. Fig. 6a demonstrated that the MICs of Ag-CDs against EC and SA started to increase only after 14 and 9 passages, respectively. Fig. 6b showed that the MICs of gentamicin against EC and SA started to increase after 5 and 6 passages, respectively, and bacterial resistance gradually developed. The comparison of this resistance experiment revealed that Ag-CDs did not show a significant resistance phenomenon during the long-term antibacterial process, which means that the bacteria did not develop significant resistance to Ag-CDs during the 28-day transmission process, and the antibacterial ability remained effective, indicating that the antibacterial activity of Ag-CDs exceeds that of gentamicin.
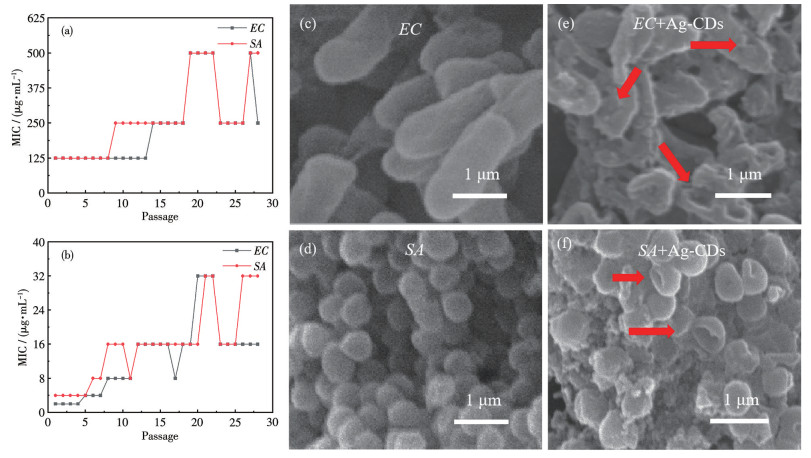
To examine the bacterial morphology post-Ag-CDs treatment, 1 000 μg·mL-1 Ag-CDs were incubated with the bacteria, and compared against Fig. 6c-6f, it could be seen that the bacteria without Ag-CDs treatment had clear outlines and smooth surfaces (Fig. 6c and 6d). After the Ag-CDs treatment, holes appeared in specific places of the cell membrane (as indicated by red arrows in Fig. 6e and 6f), and many bacteria were severely damaged, with shrivelled and ruptured cell membranes and disorganized morphology, and the original appearance of the bacteria was completely lost from all angles. All indications are that Ag-CDs kill bacteria by destroying cell membranes.
TTC is a specific enzyme system proton receptor in the respiratory chain, and the dehydrogenase enzyme of living bacteria can reduce it to red triphenylmethyl filth (TTF), and low bacterial viability shows light or no colour[50]. The TTC assay was employed to quantify bacterial mitochondrial TTC dehydrogenase activity following a two-hour treatment of EC and PA bacterial solutions with varying Ag-CDs mass concentrations (Fig. 7a). Results indicated that the untreated group′s test tube solution exhibited the darkest colour, reflecting robust bacterial activity. Upon Ag-CDs treatment, dehydrogenase activity was significantly suppressed, impeding the reduction of TTC to TTF and leading to lighter coloration. Notably, higher Ag-CDs mass concentrations correlated with more pronounced colour attenuation and greater inhibition of dehydrogenase activity. This indicates that Ag-CDs inhibit the respiratory chain-related enzyme system of bacteria, and the inhibition effect on PA bacterial fluid is more significant than that on EC bacterial fluid. This inhibitory effect disrupts the normal physiological metabolism of the bacteria, which may lead to structural damage to cellular envelopes, consistent with the destruction of cell walls and cell membranes observed in SEM (Fig. 6d and 6f). This mechanism underpins the subsequent antibacterial efficacy.
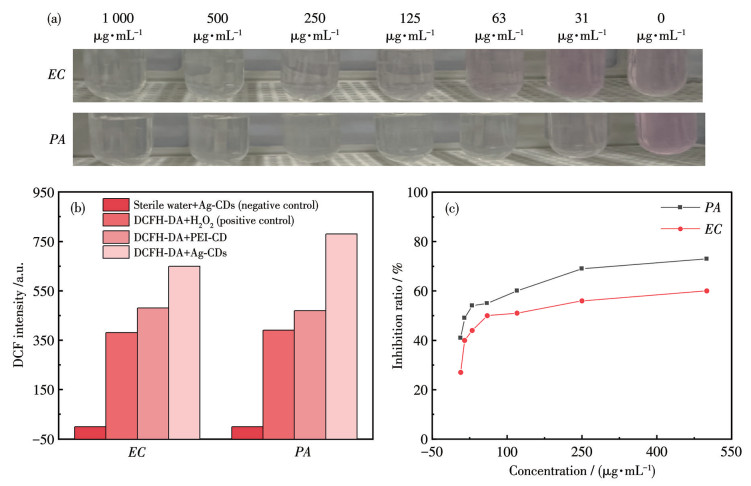
In the fluorescence detection experiments (Fig. 7b), without adding the non-fluorescent probe DCFH-DA, no significant fluorescence signal was detected at the 488 nm excitation wavelength following contact between Ag-CDs and bacteria, indicating that their interaction did not induce a fluorescence burst to interfere with DCF fluorescence detection. After the addition of DCFH-DA, the intracellular ROS level of both PEI-CD-treated and Ag-CDs-treated bacteria was higher than that of H2O2-treated ones, and the DCF fluorescence emission intensity was also higher, indicating that both PEI-CD and Ag-CDs exhibit a potent capacity for ROS generation in bacteria, among which silver-doped Ag-CDs are more effective than non-silver-doped PEI-CD. Excessive ROS generation impacts bacterial cell wall constituents, membrane phospholipids, polypeptides, and nucleic acids, escalating damage to cellular membranes and exerting extra stress on the bacterial antioxidant defence system.
SOD enzyme activity assay of EC and PA bacterial samples treated with Ag-CDs (Fig. 7c) revealed that Ag-CDs effectively inhibited the total SOD enzyme activity of both bacteria. With increasing Ag-CDs mass concentration, the enzyme activity inhibition rate rose from 26% to 60% in EC and from 41% to 73% in PA. Combined with the results of previous experiments in which Ag-CDs induced the bacteria to produce more ROS and showed good antimicrobial activity, it can be seen that the high inhibition rate of SOD activity by Ag-CDs greatly weakens the bacteria′s antioxidant capability. Upon impairment of the bacterial antioxidant system, which fails to eliminate the abundant ROS generated promptly, the ROS continues to damage cellular structures and physiological functions, further enhancing the antimicrobial efficacy of Ag-CDs.
The three antimicrobial mechanisms of Ag-CDs are closely related and synergistic with each other. Firstly, the inhibition of respiratory chain-related enzymes initially disrupts the normal metabolism of bacteria, leading to damage to the cell wall and cell membrane structures. This disruption induces the production of substantial ROS inside the bacterial cells, which directly targets cellular structures, exacerbates the antioxidant system′s workload, and ultimately suppresses antioxidant enzyme activity. As a result, the bacteria lose their ability to combat. This cascade of effects enables Ag-CDs to effectively inhibit bacterial growth. This variation in enzyme activity inhibition also influences the selective antibacterial effect of Ag-CDs on EC and PA.
In this study, silver-doped antimicrobial fluorescent Ag-CDs were prepared by focusing on membrane separation of biological contamination in response to water pollution and the limitations of traditional water treatment technologies. The material enables heavy metal ion detection through fluorescence quenching phenomena and possesses pollution monitoring capabilities. Moreover, these materials demonstrate strong and wide-ranging antimicrobial activity against both Gram-positive and Gram-negative bacteria. The antimicrobial efficacy of the materials against diverse bacterial strains was confirmed via ROS, SOD, and other mechanistic and characterization analyses. This integration of antibacterial and detection functions provides a new path for the preparation of anti-pollution composite membrane materials. In the future, the material could serve for simultaneous heavy metal and bacterial detection in wastewater, or act as a key component in anti-pollution membrane materials to mitigate biofilm contamination at the source, enhance membrane separation efficiency, and support water treatment technology upgrading.
YIN Z Y, SONG J, LIU D G, WU J F, YANG Y, SUN Y Y, WU J C. Mapping mining-affected water pollution in China: Status, patterns, risks, and implications[J]. Hydrol. Earth Syst. Sci., 2024, 29(16): 3957-3973
SALAZAR H, MARTINS P M, SANTOS B, FERNANDES M M, REIZABAL A, SEBASTIÁN V, BOTELHO G, TAVARES C J, VILAS-VILELA J L, LANCEROS-MENDEZ S. Photocatalytic and antimicrobial multifunctional nanocomposite membranes for emerging pollutants water treatment applications[J]. Chemosphere, 2020, 250(7): 126299
杨彬, 樊贵盛, 梁镇海. 膜法水处理技术与传统方法的比较[J]. 太原理工大学学报, 2004, 35(2): 155-159, 163YANG B, FAN G S, LIANG Z H. The comparison of membrane technology and conventional methods for water treatment[J]. J. Taiyuan Univ. Technol., 2004, 35(2): 155-159, 163
LI R H, HUANG L J H, HUANG W F, ZHAO B X, LI L. Factors affecting biofouling of reverse osmosis membrane and control methods[J]. Technol. Water Treat., 2019, 45(12): 19-25
ZHANG Y, QU Z Q, WANG J W, YANG Y, CHEN X, WANG J Z, ZHANG Y F, ZHU L Y. Natural biofilm as a potential integrative sample for evaluating the contamination and impacts of PFAS on aquatic ecosystems[J]. Water Res., 2022, 215: 118233 doi: 10.1016/j.watres.2022.118233
CAO Y H, CAI W J, HE X W, SONG H L, GAO J, YANG Y L, ZHOU J. A review of advances & potential of applying nanomaterials for biofilm inhibition[J]. NPJ Clean Water, 2024, 7(1): 131 doi: 10.1038/s41545-024-00423-5
CHUNG S H, REVIA R A, ZHANG M Q. Graphene quantum dots and their applications in bioimaging, biosensing, and therapy. [J]. Adv. Mater., 2021, 33: 2004362
FACURE M H M, SCHNEIDER R, MERCANTE L A, CORREA D S. A review on graphene quantum dots and their nanocomposites: From laboratory synthesis towards agricultural and environmental applications[J]. Environ. Sci. Nano, 2020, 7(12): 3710-3734 doi: 10.1039/D0EN00787K
CHEN W F, LV G, HU W M, LI D J, CHEN S N, DAI Z X. Synthesis and applications of graphene quantum dots: A review[J]. Nanotechnol. Rev., 2018, 7(2): 157 doi: 10.1515/ntrev-2017-0199
YOUNIS M R, HE G, LIN J, HUANG P. Recent advances on graphene quantum dots for bioimaging applications[J]. Front. Chem., 2020, 8: 424 doi: 10.3389/fchem.2020.00424
CUI F C, FAN R S, WANG D F, REN L K, WANG Q Q, MENG Y Q, MA R, WANG S L, LIU Z T, LI X P, LI T T, LI J R. Super Fe3+ competing ability, high biocompatibility, and mild antibacterial carbon dots for food preservation[J]. Chem. Eng. J., 2024, 492: 152103 doi: 10.1016/j.cej.2024.152103
WANG Y H, YAO J C, CAO Z L, FU P, DENG C, YAN S F, SHI S, ZHENG J P. Peroxidase-mimetic copper-doped carbon-dots for oxidative stress-mediated broad-spectrum and efficient antibacterial activity[J]. Chem. Eur. J., 2022, 28 (14): e202104174 doi: 10.1002/chem.202104174
LI L, WANG Y H, HU S X, CHANG X F, DING Q J, WANG K Z, CHEN Y J, ZHENG J P. Peroxidase-like copper-doped carbon-dots embedded in hydrogels for stimuli-responsive bacterial biofilm elimination and wound healing[J]. Acta Biomater., 2025, 195: 467-478 doi: 10.1016/j.actbio.2025.02.022
BIJOY G, SANGEETHA D. Biomass derived carbon quantum dots as potential tools for sustainable environmental remediation and eco-friendly food packaging[J]. J. Environ. Chem. Eng., 2024, 12 (5): 113727 doi: 10.1016/j.jece.2024.113727
LIU J H, LI R S, HE M T, XU Z G, XU L Q, KANG Y J, XUE P. Multifunctional SGQDs-CORM@HA nanosheets for bacterial eradication through cascade-activated "nanoknife" effect and photodynamic/CO gas therapy[J]. Biomaterials, 2021, 277: 121084 doi: 10.1016/j.biomaterials.2021.121084
BARAZ Z H, ARSALANI N, NAGHASH-HAMED S. Fluorescent biopolymer hydrogels crosslinked with carbon quantum dots for selective detection of heavy iron(Ⅲ) ions[J]. J. Ind. Eng. Chem., 2024, 139: 281-294 doi: 10.1016/j.jiec.2024.05.004
NGOC L X D, SON K A, LINH C N T, QUANG N K. Detection of Fe3+ ions using carbon dots derived from Gac fruit (Momordica cochinchinensis Spreng)[J]. MRS Adv., 2024, 9(17): 1337-1344 doi: 10.1557/s43580-024-00904-2
ALKIAN I, SUTANTO H, HADİYANTO B, PRASETİO A, UTAMI B A, ARELLANO-GARCIA H. Facile synthesized carbon dots for simple and selective detection of cobalt ions in aqueous media[J]. Cogent Eng., 2022, 9(1): 1998647
ZHANG S W, LI J X, ZENG M Y, XU J Z, WANG X K, HU W P. Polymer nanodots of graphitic carbon nitride as effective fluorescent probes for the detection of Fe3+ and Cu2+ ions[J]. Nanoscale, 2014, 6(8): 4157-4162 doi: 10.1039/c3nr06744k
ALÍ-TORRES J, RODRÍGUEZ-SANTIAGO L, SODUPE M, RAUK A. Structures and stabilities of Fe2+/3+ complexes relevant to alzheimer′s disease: An ab initio study[J]. J. Phys. Chem. A, 2011, 115(45): 12523-12530 doi: 10.1021/jp2026626
LIU P, BORRELL P F, BOŠIĆ M, KOKOL V, OKSMAN K, MATHEW A P. Nanocelluloses and their phosphorylated derivatives for selective adsorption of Ag+, Cu2+ and Fe3+ from industrial effluents[J]. J. Hazard. Mater., 2015, 294(8): 177-185
PATI P B, ZADE S S. MLCT based colorimetric probe for iron having D-A-D type architecture of benzo[2, 1, 3]thiadiazole acceptor and thiophene donor with azomethine pendant arm[J]. Inorg. Chem. Commun., 2014, 39(1): 114-118
CHEN Y Q, SUN X B, PAN W, YU G F, WANG J P. Fe3+-sensitive carbon dots for detection of Fe3+ in aqueous solution and intracellular imaging of Fe3+ inside fungal cells[J]. Front. Chem., 2020, 7 (7): 504410
AL-HIMEIRI A N, AL-FATLAWI A H. Disinfection performance of polyvinyl chloride (PVC) membrane incorporating with AgNPs[C]//KARKUSH M, CHOUDHURY D, HAN J. Current trends in geotechnical engineering and construction. ICGECI 2022. Singapore: Springer, 2022: 31-37
YANG W X, LI L, WANG S, LIU J S. Preparation of multifunctional AgNPs/PAN nanofiber membrane for air filtration by one-step process[J]. Pigm. Resin Technol., 2020, 49(5): 355-361 doi: 10.1108/PRT-08-2019-0075
GHERASIM O, GRUMEZESCU A M, GRUMEZESCU V, IORDACHE F, VASILE B S, HOLBAN A M. Bioactive surfaces of polylactide and silver nanoparticles for the prevention of microbial contamination[J]. Materials, 2020, 13(3): 721 doi: 10.3390/ma13030721
GONDIKAS A P, MORRIS A, REINSCH B C, MARINAKOS S M, LOWRY G V, HSU-KIM H. Cysteine-induced modifications of zero-valent silver nanomaterials: Implications for particle surface chemistry, aggregation, dissolution, and silver speciation[J]. Environ. Sci. Technol., 2012, 46(13): 7037-7045 doi: 10.1021/es3001757
WANG P Y, SONG Y Z, MEI Q, DONG W F, LI L. Sliver nanoparticles@carbon dots for synergistic antibacterial activity[J]. Appl. Surf. Sci., 2022, 600(10): 154125
ALDAKHIL F, ALARFAJ N A, AL-TAMIMI S A, EL-TOHAMY M F. Development of silver-doped carbon dots sensor derived from lignin for dual-mode fluorometric and spectrophotometric determination of valsartan in a bulk powder and a commercial product[J]. Heliyon, 2024, 10(23): e40848 doi: 10.1016/j.heliyon.2024.e40848
LI K X, MA J L, WANG Z T, GU S B, WU Y, CHENG W W, NIU H W, ZHAO L N. Facile carbon-silver nanocomposites based on polysaccharide-derived carbon dots for antibacterial applications[J]. New J. Chem., 2023, 47(7): 3376-3384 doi: 10.1039/D2NJ05915K
ZHAO D, LIU X M, ZHANG R, XIAO X C, LI J. Preparation of two types of silver-doped fluorescent carbon dots and determination of their antibacterial properties[J]. J. Inorg. Biochem., 2021, 214(1): 111306
DONG X L, LIANG W X, MEZIANI M J, SUN Y P, YANG L J. Carbon dots as potent antimicrobial agents[J]. Theranostics, 2020, 10(2): 671-686 doi: 10.7150/thno.39863
CHEN J, SHAN M D, ZHU H J, ZHANG S C, LI J M, LI L J. Antimicrobial properties of heterojunction BiSnSbO6-ZnO composites in wastewater treatment[J]. Environ. Sci. Pollut. Res., 2023, 30(19): 55498-55512 doi: 10.1007/s11356-023-25934-5
CHOI S, ISAACS A, CLEMENTS D, LIU D, DEGRADO W F. De novo design and in vivo activity of conformationally restrained antimicrobial arylamide foldamers[J]. Proc. Natl. Acad. Sci., 2009, 106(17): 6968-6973 doi: 10.1073/pnas.0811818106
ZHANG H Y, DUNPHY D R, JIANG X M, MENG H, SUN B B, TARN D, XUE M, WANG X, LIN S J, JI Z X, LI R B, GARCIA F L, YANG J, KIRK M L, XIA T, ZINK J I, NEL A, BRINKER C J. Processing pathway dependence of amorphous silica nanoparticle toxicity: Colloidal vs pyrolytic. [J]. J. Am. Chem. Soc., 2012, 134(38): 15790-15804 doi: 10.1021/ja304907c
LUO Z M, YANG D L, YANG C, WU X Y, HU Y L, ZHANG Y, YUWEN L H, YEOW E K L, WENG L X, HUANG W, WANG L H. Graphene quantum dots modified with adenine for efficient two-photon bioimaging and white light-activated antibacteria[J]. Appl. Surf. Sci., 2018, 434(15): 155-162
WANG L M, MA X X, ZHANG L L, WANG L W. Fe3O4 methylprednisolone plus calpain inhibitor protects against spinal cord ischemia-reperfusion injury in rats[J]. Mater. Express, 2020, 10(9): 1554-1559 doi: 10.1166/mex.2020.1781
WANG Y J, ZHANG Q R, ZHANG S C, QI J T, LI L. The superiority and feasibility of 2,3,5-triphenyltetrazolium chloride-stained brain tissues for molecular biology experiments based on microglial properties[J]. Anim. Models Exp. Med., 2023, 6(2): 111-119 doi: 10.1002/ame2.12312
JANYOU A, MOOHAMMADAREE A, JUMNONGPRAKHON P, TOCHARUS C, CHOKCHAISIRI R, SUKSAMRARN A, TOCHARUS J. Effects of isosakuranetin on cerebral infarction and blood brain barrier damage from cerebral ischemia/reperfusion injury in a rat model[J]. J. Biomol. Struct. Dyn., 2024, 42(2): 1064-1071 doi: 10.1080/07391102.2023.2205940
RAINA S, THAKUR A, SHARMA A, POOJA D, MINHAS A P. Bactericidal activity of Cannabis sativa phytochemicals from leaf extract and their derived carbon dots and Ag@carbon dots[J]. Mater. Lett., 2020, 262(1): 127122
WANG H B, ZHANG M L, MA Y R, WANG B, SHAO M W, HUANG H, LIU Y, KANG Z H. Selective inactivation of Gram-negative bacteria by carbon dots derived from natural biomass: Artemisia argyi leaves[J]. J. Mater. Chem. B, 2020, 8(13): 2845-2851
OTIS G, BHATTACHARYA S, MALKA O, KOLUSHEVA S, BOLEL P, PORGADOR A, JELINEK R. Selective labeling and growth inhibition of Pseudomonas aeruginosa by aminoguanidine carbon dots[J]. ACS Infect. Dis., 2019, 5(2): 292-302 doi: 10.1021/acsinfecdis.8b00270
ROY A K, KIM S M, PAOPRASERT P, PARK S Y, IN I. Preparation of biocompatible and antibacterial carbon quantum dots derived from resorcinol and formaldehyde spheres[J]. RSC Adv., 2015, 5(40): 31677-31682 doi: 10.1039/C5RA01506E
YUAN F L, HE P, XI Z F, LI X H, LI Y C, ZHONG H Z, FAN L Z, YANG S H. Highly efficient and stable white LEDs based on pure red narrow bandwidth emission triangular carbon quantum dots for wide-color gamut backlight displays[J]. Nano Res., 2019, 12(7): 1669-1674 doi: 10.1007/s12274-019-2420-x
PEI S, LU Z, SUN W, YAN K, ZHOU J, SUN C, HUANG J, LUO K, YANG X. Preparation, characterization, and antibacterial activity of rhodiola carbon dots[J]. Russ. J. Gen. Chem. 2024, 94(8): 1991-1996 doi: 10.1134/S1070363224080127
FAN K, TANG R, LI L J. Characterization, antioxidant activity of banana peel carbon dots and their antibacterial mechanism against Staphylococcus aureus[J]. J. Appl. Microbiol., 2025, 136(7): lxaf163 doi: 10.1093/jambio/lxaf163
GAO D G, ZHAO P, LYU B, LI Y J, HOU Y L, MA J Z. Carbon quantum dots decorated on ZnO nanoparticles: An efficient visible-light responsive antibacterial agents[J]. Appl. Organomet. Chem., 2020, 34(8): e5665 doi: 10.1002/aoc.5665
SARAVANAN A, DAS P, MARUTHAPANDI M, ARYAL S, MICHAELI S, MASTAI Y, LUONG J H T, GEDANKEN A. Heteroatom co-doping (N, NS, NB) on carbon dots and their antibacterial and antioxidant properties[J]. Surf. Interfaces, 2024, 46(3): 103857
MOHAMMADI S, PASHAEE A, AMINI N, MARZBAN N, PUTTAIAH S H, TANG V T, MALEKI A. Green carbon dots derived from honey, garlic, and carrot: Synthesis, characterization, and antibacterial properties[J]. Biomass Convers. Biorefin., 2025, 15(10): 14823-14837 doi: 10.1007/s13399-024-06349-9
PRAVEEN-KUMAR, TARAFDAR J C. 2,3,5-Triphenyltetrazolium chloride (TTC) as electron acceptor of culturable soil bacteria, fungi and actinomycetes[J]. Biol. Fertil. Soils, 2003, 38(3): 186-189 doi: 10.1007/s00374-003-0600-y

Figure 2 (a) UV-Vis absorption spectrum (Inset: pictures of the fluorescence phenomenon of Ag-CDs), (b) fluorescence spectra, (c) XRD pattern, (d) FTIR spectrum, (e) TEM image, and (f) particle size distribution of Ag-CDs

Figure 3 (a) XPS survey spectra and (b) C1s, (c) O1s, (d) N1s, and (e) Ag3d high-resolution XPS spectra of Ag-CDs

Figure 4 (a) Fluorescence spectra of metal ions reacted with Ag-CDs; (b) Response of Ag-CDs to various metal ions; (c) Pictures of the fluorescence phenomenon of Ag-CDs before and after adding various metal ions; (d) Fluorescence intensity responses of Ag-CDs+Fe3+ to various metal ions; (e) Fluorescence spectra of Ag-CDs with varying Fe3+ concentrations; (f) F/F0 versus Fe3+ concentration (Inset: linear fitting of F/F0 and Fe3+ concentration)

Figure 5 (a-d) Growth of bacteria on solid media; Growth curves of (e) EC and (f) SA; (g) Disruption rates of EC and SA biofilms by Ag-CDs with various mass concentrations

Figure 6 Resistance profiles of (a) Ag-CDs and (b) gentamicin sulphate to EC and SA; (c-f) SEM images of bacteria

Figure 7 (a) Bacterial TTC dehydrogenase activity after treatment of EC and PA with different mass concentrations of Ag-CDs for 2 h; (b) Intracellular ROS assay after incubation of Ag-CDs with EC and PA; (c) Inhibition rate of Ag-CDs with different mass concentrations on the total SOD enzyme activity of EC and PA
Table 1. Comparison of antibacterial properties of different CD materials
| Comparative material | Main raw materials | MIC | Ref. |
| Ag-CDs | CA | 125 and 250 μg·mL-1 against EC and SA, respectively | This work |
| R-CDs | Rhodiola | 0.7 mg·mL-1 against EC and SA | [45] |
| CDs | Banana peels | 3.125 mg·mL-1 against SA | [46] |
| ZnO@CQDs | Coconut water | 6 and 8 mg·mL-1 against EC and SA, respectively | [47] |
| N, NS, and NB-CDs | Glucosamine hydrochloride | 300 μg·mL-1 against EC | [48] |
| Green CDs | Honey, garlic, and carrot | 1.8 mg·mL-1 against EC and SA | [49] |
 下载: 导出CSV

 扫一扫看文章

扫一扫关注我们
