Table 1.
Elemental analysis data of complexes 1-6
Citation:
Zihe SONG, Jinjin ZHAO, Ning REN, Jianjun ZHANG. Crystal structure, thermal analysis, and luminescence properties of six heterocyclic lanthanide complexes[J]. Chinese Journal of Inorganic Chemistry,
2026, 42(1): 181-192.
doi:
10.11862/CJIC.20250126

六个镧系杂环配合物的晶体结构、热分析和发光性质
摘要:
通过常温溶液挥发法成功合成了6个新的镧系配合物: [Ln(3,4-DEOBA)3(4,4′-DM-2,2′-bipy)]2·2C2H5OH, 其中Ln=Dy (1)、Eu (2)、Tb (3)、Sm (4)、Ho (5)、Gd (6), 3,4-DEOBA-=3,4-二乙氧基苯甲酸根, 4,4′-DM-2,2′-bipy=4,4′-二甲基-2,2′-联吡啶。通过单晶X射线衍射技术测定了6个配合物的晶体结构, 结果显示配合物都为双核结构, 并且结构中含有游离的乙醇分子, 且每个结构单元的中心金属的配位数均为8。相邻的结构单元之间通过氢键相互作用, 进一步扩展形成一维链状及二维平面结构。对配合物1~4的发光性能进行系统研究后, 获得了其发射以及激发光谱。实验结果表明, 配合物2和3的荧光寿命分别为0.807和0.845 ms。将配合物1~4的发射光谱数据导入到CIE色度坐标系中, 其对应发光区域分别覆盖黄光、红光、绿光及橙红光波段。在299.15~1 300 K范围内, 采用TG-DSC/FTIR/MS技术, 对6个配合物的热分解过程进行了综合分析。通过对逸出气体进行检测, 三维红外光谱及质谱检测的离子碎片信息验证了分解过程中配体基团逐步损失的假设。具体分解路径: 首先脱除游离的乙醇分子及中性配体, 最终释放酸性配体, 最终产物为对应的金属氧化物。
English
Crystal structure, thermal analysis, and luminescence properties of six heterocyclic lanthanide complexes
Abstract:
Six new lanthanide complexes: [Ln(3,4-DEOBA)3(4,4′-DM-2,2′-bipy)]2·2C2H5OH, [Ln=Dy (1), Eu (2), Tb (3), Sm (4), Ho (5), Gd (6); 3,4-DEOBA-=3,4-diethoxybenzoate, 4,4′-DM-2,2′-bipy=4,4′-dimethyl-2,2′-bipyridine] were successfully synthesized by the volatilization of the solution at room temperature. The crystal structures of six complexes were determined by single-crystal X-ray diffraction technology. The results showed that the complexes all have a binuclear structure, and the structures contain free ethanol molecules. Moreover, the coordination number of the central metal of each structural unit is eight. Adjacent structural units interact with each other through hydrogen bonds and further expand to form 1D chain-like and 2D planar structures. After conducting a systematic study on the luminescence properties of complexes 1-4, their emission and excitation spectra were obtained. Experimental results indicated that the fluorescence lifetimes of complexes 2 and 3 were 0.807 and 0.845 ms, respectively. The emission spectral data of complexes 1-4 were imported into the CIE chromaticity coordinate system, and their corresponding luminescent regions cover the yellow light, red light, green light, and orange-red light bands, respectively. Within the temperature range of 299.15-1 300 K, the thermal decomposition processes of the six complexes were comprehensively analyzed by using TG-DSC/FTIR/MS technology. The hypothesis of the gradual loss of ligand groups during the decomposition process was verified by detecting the escaped gas, 3D infrared spectroscopy, and ion fragment information detected by mass spectrometry. The specific decomposition path is as follows: firstly, free ethanol molecules and neutral ligands are removed, and finally, acidic ligands are released; the final product is the corresponding metal oxide.
-
Key words:
- lanthanide complexes
- / fluorescence property
- / crystal structure
- / thermal analysis
-
0. Introduction
With its unique electronic structure, lanthanides have significant application prospects in various disciplines[1-3]. The synthetic approach utilizing lanthanide elements in combination with aromatic carboxylate-based ligands presents a novel conceptual framework. The introduction of ligands not only significantly improves the catalytic performance of the complexes, but also fine-regulates their optical properties[4-6]. In addition, the nitrogen atom contained in the nitrogen-containing ligands can form a stable coordination environment with metal ions, making the metal ions extremely stable[7-9]. Lanthanide elements have a strong emission band due to the f-f transition effect, but this emission band is often restricted by parity rules. Therefore, scientists have developed a strategy that allows ligands with conjugated structures to coordinate with lanthanide elements, which not only effectively reduces the coordination interference of the solution but also promotes the efficient energy transfer between the ligands and lanthanum ion, thus significantly enhancing the luminous effect[10-13]. Complexes synthesized by the combination of lanthanides and ligands have an important position and application value in the fields of photosensitive emission[14-16] and catalytic reaction[17-18].
The combination of thermal analysis and mass spectrometry constitutes a cutting-edge, comprehensive analysis strategy, which cleverly integrates the respective advantages of thermal analysis technologies, such as thermogravimetric (TG) analysis and mass spectrometry (MS), showing a unique analytical performance[19-20]. This technology can synchronously and precisely track the mass changes of the sample during heat treatment and the specific components of the escaped gas, so as to deeply analyze the structural properties and dynamic evolution of the material. This comprehensive approach plays an irreplaceable role in the core areas of material pyrolysis exploration[21-22] and catalytic oxidation processes[23-24].
In this article, 4,4′-dimethyl-2,2′-bipyridine (4,4′-DM-2,2′-bipy) and 3,4-diethoxybenzoic acid (3,4-DEOHBA) were selected as ligands for the synthesis of innovative complexes, namly [Ln(3,4-DEOBA)3(4,4′-DM-2,2′-bipy)]2·2C2H5OH [Ln=Dy (1), Eu (2), Tb (3), Sm (4), Ho (5), Gd (6)]. Then, these complexes were analyzed comprehensively and carefully by various advanced characterization methods. Advanced techniques TG-DSC/FTIR/MS (DSC=differential scanning calorimetry) were used to study the detailed decomposition, with a comprehensive discussion of the small molecules lost during each decomposition step. In addition, because of the luminescence of complexes 1-4, the results obtained from the tests clearly reveal the specific luminescence patterns of Dy3+, Eu3+, Tb3+, and Sm3+ ions.
1. Experimental
1.1 Reagents and instruments
3,4-DEOHBA with 98% purity was purchased from Ark Pharm, and 4,4′-DM-2,2′-bipy and lanthanide nitrates with 99% purity were purchased from Innochem. The Vario EL Ⅲ element analyzer was utilized to measure element content. The HORIBA LabRAM Soleit Raman spectrometer was employed for measuring Raman spectra, while the BRUKER TENSOR27 Fourier Transform infrared spectrometer was used to measure infrared spectra. For powder X-ray diffraction (PXRD) measurement, a Bruker D8 Advance X-ray diffractometer was applied, with data collected in a 2θ range of 5°-50° using a Cu Kα radiator (λ=0.154 18 nm) at 298 K, a working voltage of 40 kV, and a current of 40 mA. Additionally, the STA 8000 synchronous thermal analyzer, the spectrum3 FTR spectrometer, and the Clarus SQ8T mass spectrometer were jointly used to measure the decomposition process. Finally, the FS5 fluorescence spectrometer was employed to test luminescence.
1.2 Preparation of complexes
0.2 mmol of lanthanide nitrate was dissolved in 3 mL of water to form a lanthanide nitrate solution. Then, 0.6 mmol of 3,4-DEOHBA and 0.2 mmol of 4,4′-DM-2,2′-bipy were placed in a small beaker, and 6 mL of 95% ethanol was added. The mixture was stirred magnetically, and the solid was dissolved to obtain the ligand solution. The pH of the solution was adjusted to 5.8-6.4 with 1 mol·L-1 NaOH solution. The above ligand solution was slowly added to the lanthanide nitrate solution, and the mixture was stirred at room temperature for 6 h, and then the reaction solution was left to stand for 12 h. After extraction and filtration, six types of single crystals were grown after about 7 d.
1.3 Determination of crystal structure
Single crystals without obvious crystal defects were selected and determined under the Smart-1000 (Bruker AXS, Germany) single crystal X-ray diffractometer. Mo Kα rays (λ=0.071 073 nm) that had been monochromatized with graphite were used as the incident light source. The crystal diffraction data were measured and collected at room temperature. The structure was analyzed by the direct method using the SHELXS-2018 program[25-26], and the crystal structure was obtained by fine-tuning with the full matrix least square method on F2. All the atoms in the structure except hydrogen have undergone anisotropic refinement.
2. Results and discussion
2.1 Elemental analysis
For complexes 1-6, the contents of C, H, and N elements are detailed in Table 1. After three parallel measurements, the average of these three measurements was taken and compared with the theoretical value, and the results were close to expectations.
Table 1

 下载:
导出CSV
下载:
导出CSV
Complex wC / % wH / % wN / % Found Calcd. Found Calcd. Found Calcd. 1 55.32 55.22 5.63 5.60 2.75 2.78 2 55.90 55.93 5.69 5.73 2.77 2.74 3 55.51 55.58 5.65 5.60 2.75 2.73 4 55.98 55.86 5.70 5.65 2.78 2.86 5 55.19 55.26 5.62 5.58 2.74 2.78 6 55.60 55.55 5.66 5.63 2.76 2.79 2.2 Crystal structure description
The crystallographic data are shown in Table S1 (Supporting information). Important bond lengths are shown in Table S2. It can be seen from the determination that complexes 1-6 have an isomorphic structure and are all triclinic system. Herein, complex 3 is described in detail.
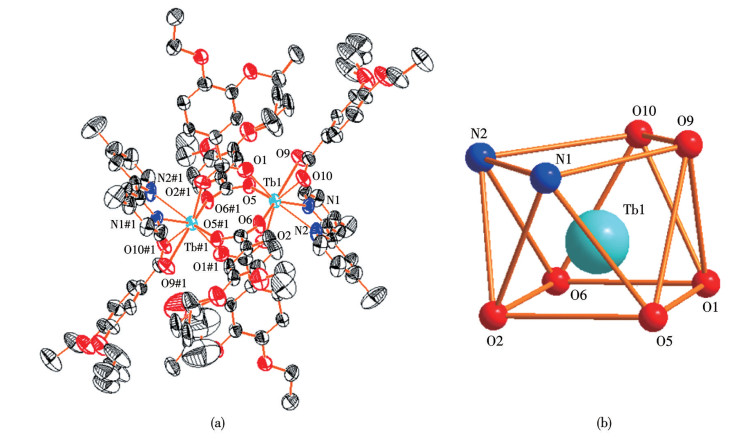
Fig.1a shows the structural unit of complex 3, and Fig.1b shows the coordination environment of central Tb3+. As can be seen from Fig.1a, two 4,4′-DM-2,2′-bipy ligands and six 3,4-DEOBA- ligands are directly connected to the two metal ions (Tb1 and Tb1#1). In addition to the directly connected ligands, two free ethanol molecules are also surrounded. There are eight atoms directly connected to the Tb1 ion: six oxygen atoms and two nitrogen atoms. Among them, the oxygen atoms are connected to the metal in the form of bidentate chelation (O9, O10) and bridging bidentate (O1, O2, O5, O6), and their shape is calculated as a twisted quadrilateral antiprism configuration[27]. The distance between Tb1 and Tb1#1 is 0.423 79(9) nm. As shown in Table S4, the longest Tb—O bond is 0.242 6(6) nm, the shortest is 0.227 1(6) nm, and the average length of the six groups of Tb—O bonds is 0.233 5(6) nm. The Tb—N bond lengths are 0.254 8(7) and 0.254 4(7) nm, with an average of 0.254 6(7) nm. By comparison, it is found that the bond length between metal ions and oxygen atoms is short, and the bond energy is strong[28].
Figure 1
 Figure 1. (a) Structural unit of complex 3; (b) coordination environment of the Tb3+ ion
Ellipsoid probability: 50%; Symmetry code: #1:-x+1, -y+1, -z.
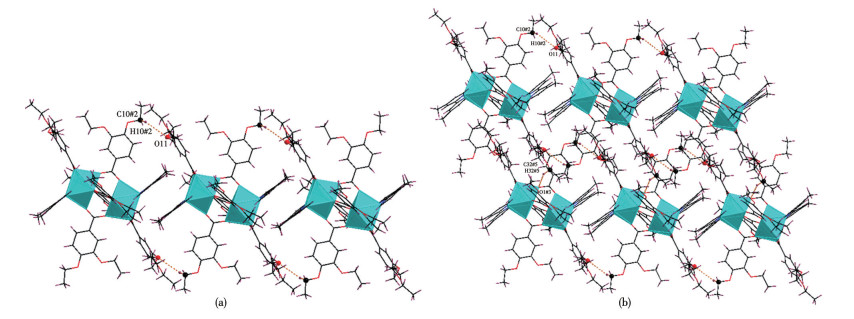
In the direction of a-axis, the single structural units are interconnected through C10—H10…O11 hydrogen bonds (C10…O11 0.342 7 nm) and extend into a 1D chain structure (Fig.2a). In addition, in the ac plane, these structural units are supported by C32—H32…O1 hydrogen bond (C32…O1 0.328 4 nm), and are further linked to form a 2D plane structure (Fig.2b).
Figure 2
 Figure 2. (a) One-dimensional chain structure of complex 3; (b) 2D layer structure
Symmetry codes: #2: x-1, y, z; #3: x-1, y+1, z; #5:-x, 1-y, -z.
2.3 Infrared and Raman spectra
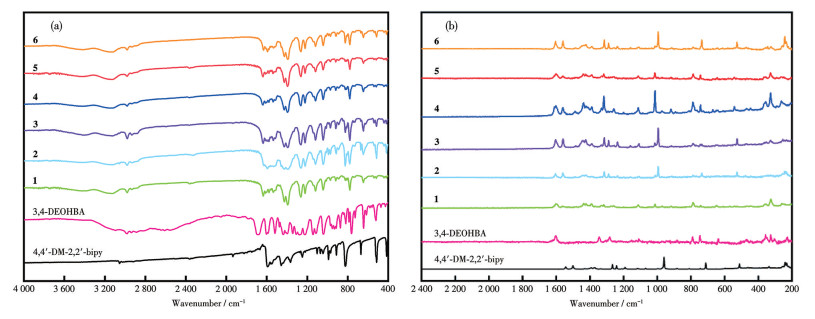
As shown in Fig.3, IR and Raman spectra were obtained. Due to the similar structure of these complexes, their spectral characteristics also showed similarities[29]. Combined with the data analysis in Table S3, it is evident that there was a vibration peak of νC=O at 1 691 cm-1, but this vibration was not detected in the complex. In contrast, Ln—O bond vibrations in the complex occurred in a range of 422-416 cm-1. In addition, at new wavenumbers of 1 539-1 529 cm-1 and 1 432-1 429 cm-1, carboxylic acid-based νas(COO-) and νs(COO-) were observed. The presence of these characteristic peaks indicates coordination between the metal and oxygen atoms[30-31]. Further analysis of the Raman spectral data showed that the vibrational frequencies of νC=N and δC—H increased in the newly synthesized complex, which implies the enhanced stability of the complex[32]. At the same time, the newly formed carboxylic acid group showed obvious vibration peaks of νas(COO-) and νs(COO-) at 1 561-1 555 cm-1 and 1 429-1 421 cm-1, respectively. In addition, the vibrations of the Ln—O bond and Ln—N bond appeared significantly at 429-424 cm-1 and 278-274 cm-1, respectively. These spectral features together confirm the successful synthesis of the complex[33].
Figure 3
2.4 PXRD analysis
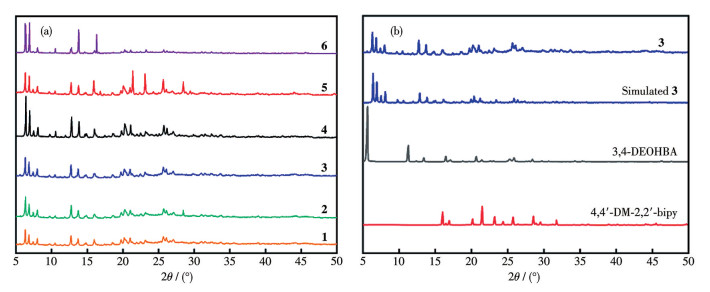
The PXRD pattern obtained at room temperature is shown in Fig.4. Specifically, Fig.4a shows PXRD patterns for six complexes, while Fig.4b shows experimental and simulated PXRD patterns for two ligands and complex 3. First, it can be clearly observed from Fig.4a that the diffraction peaks of these four complexes exhibited a high degree of similarity, indicating that their structures are very similar[34]. In Fig.4b, there was a significant difference in the diffraction peak positions between complex 3 and the two ligands, confirming that we have successfully synthesized a new substance that is completely different from the ligands. In addition, the experimental PXRD pattern of complex 3 was compared with its fitting pattern, showing that the peak positions of the two curves are highly similar, which further verified that the synthesized complex was not only pure in composition but also homogeneous in structure[35].
Figure 4
2.5 Thermal analysis
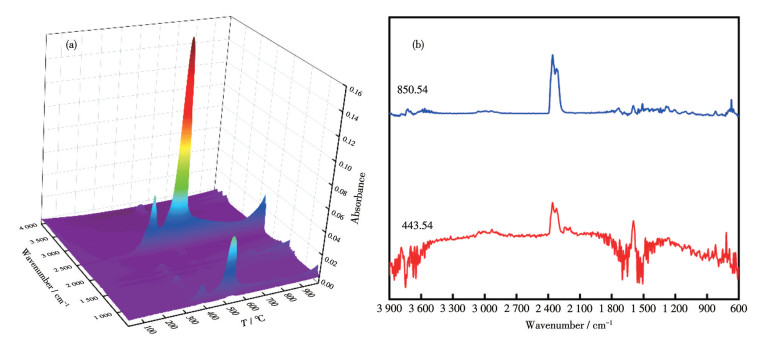
The decomposition processes of the six complexes were similar, thus taking complex 3 as an example. The decomposition curve is shown in Fig.5, the 3D-IR superposition diagram of the escaped gas is shown in Fig.6a, and the corresponding 2D diagram is shown in Fig.6b. Table 2 shows the decomposition data of complexes 1-6 in detail. The correlation spectra of other complexes are shown in Fig.S1-S5.
Figure 5
 Figure 5. Thermal decomposition curve of complex 3
DTG=differential thermal gravimetry.
Figure 6
 Figure 6. (a) Three-dimensional infrared spectra of escaping gases and (b) 2D infrared spectra of escaping gases for complex 3
Table 2
Table 2. Thermal decomposition data of complexes 1-6下载:
导出CSV
Complex Step Temperature
range / KTp in DTG / K Weight loss rate / % Probable expelled groups Intermediate and residue Found Calcd. 1 Ⅰ 332.20-593.71 416.90 23.10 4.51a 2C2H5OH+2(4,4′-DM-2,2′-bipy) Dy2(3,4-DEOBA)6 447.09 18.05b Ⅱ 593.71-1 009.50 683.26 64.24 59.16c 6(3,4-DEOBA) Dy2O3 777.86 Total 81.34 81.72d 2 Ⅰ 332.01-604.47 450.19 24.60 4.55a 2C2H5OH+2(4,4′-DM-2,2′-bipy) Eu2(3,4-DEOBA)6 18.24b Ⅱ 604.47-1 005.36 680.28 58.66 59.78c 6(3,4-DEOBA) Eu2O3 780.53 Total 83.26 82.57d 3 Ⅰ 338.29-720.29 472.07 59.53 4.52a 2C2H5OH+2(4,4′-DM-2,2′-bipy)+x(3,4-DEOBA) Tb2(3,4-DEOBA)6-x 630.09 18.12b Ⅱ 720.29-1 008.29 815.75 21.03 58.97c (6-x)(3,4-DEOBA) 1/2Tb4O7 Total 80.56 81.61d 4 Ⅰ 337.10-588.29 468.29 22.69 4.56a 2C2H5OH+2(4,4′-DM-2,2′-bipy) 18.27b Sm2(3,4-DEOBA)6 Ⅱ 588.29-1 003.20 678.57 59.74 59.87c 6(3,4-DEOBA) Sm2O3 778.96 Total 82.43 82.70d 5 Ⅰ 335.28-608.84 443.29 21.85 4.50a 2C2H5OH+2(4,4′-DM-2,2′-bipy) Ho2(3,4-DEOBA)6 18.01b Ⅱ 608.84-1 003.36 658.36 57.51 59.02c 6(3,4-DEOBA) Ho2O3 738.41 Total 79.36 81.53d 6 Ⅰ 336.25-727.78 498.14 57.79 4.53a 2C2H5OH+2(4,4′-DM-2,2′-bipy)+x(3,4-DEOBA) Gd2(3,4-DEOBA)6-x 698.18 18.15b Ⅱ 727.78-1 008.15 808.20 23.71 59.46c (6-x)(3,4-DEOBA) Gd2O3 Total 81.50 82.14d a Two ethanol molecules are theoretically removed; b Two 4,4′-DM-2,2′-bipy molecules are theoretically removed; c Six 3,4-DEOBA- ions are theoretically removed; d Total weight loss. First of all, by observing the TG curve in Fig.5, it is clear that the decomposition process was divided into two consecutive stages. The first step of decomposition occurred within a range of 338.29-720.29 K, corresponding to DTG peak temperatures of 472.07 and 630.09 K, respectively. In the DSC curve, an upward heat absorption peak was followed by a downward heat release peak. The intermediate was Tb2(3,4-DEOBA)6-x, and the experimental weight loss was 59.53%, which was analyzed to be the loss of two ethanol molecules, two 4,4′-DM-2,2′-bipy ligands, and x 3,4-DEOBA- ions. Subsequently, the second step decomposition occurred in a temperature range of 720.29-1 008.29 K, and the weight loss ratio was 21.03%. At 818.26 K, the DSC curve showed a downward heat release peak. The gases produced during heating were analyzed in depth, and the 2D spectrum was obtained by analyzing the 3D accumulation diagram in Fig.6a, as shown in Fig.6b. When the temperature reached 443.54 K, the characteristic vibration modes of ethanol molecules were revealed, including significant vibrations νs(C—H) at 2 896 cm-1 and νas(C—H) at 2 930 cm-1. At the same time, there was also the νO—H of 3 480-3 630 cm-1 belonging to ethanol. There were also vibrations associated with the decomposition of 4,4′-DM-2,2′-bipy ligands, such as νC=N at 1 702-1 542 cm-1, νC—C at 1 492 cm-1, and carbon dioxide stretching vibrations from the decomposition of 3,4-DEOBA-. It was located at 2 398-2 358 cm-1, and νC=O at 1 705 cm-1. In the 2D spectrum of 850.54 K, the stretching vibration of carbon dioxide (2 390-2 262 cm-1), the νC=O of the carboxyl component at 1 712 cm-1, and the νC—O of 1 270 cm-1 were again observed, indicating that the decomposition of the acidic ligands also occurs at this stage. The total weight loss was close to 80.56% (Calcd. 81.61%), and the product was 1/2Tb4O7.
2.6 Mass spectrometry
The combination of TG-MS and TG-FTIR was conducive to the detection of ion fragments generated during the decomposition process of the complexes, aiming at better analyzing the decomposition law of the complexes[36-37]. In view of the similar thermal decomposition behavior of complexes 1-6, complex 3 was selected as a representative sample for detailed analysis. As shown in Fig.S4a, the thermal decomposition mass spectra of complex 3 clearly showed its thermal decomposition process, while the standard mass spectra of neutral and acidic ligands can be seen in Fig.S4b and S4c, respectively.
The results of a mass spectrometry analysis (Fig.S4a) showed a series of characteristic mass-charge ratios: 184 (C12H12N2), 169 (C11H9N2+), and 155 (C10H6N2+). By comparing it with the standard mass spectrum of neutral ligands (Fig.S4b), it was determined that m/z=184 corresponds to 4,4′-DM-2,2′-bipy, and the change from m/z=184 to m/z=169 indicates that 4,4′-DM-2,2′-bipy loses one methyl group. The change from m/z=169 to m/z=155 further indicates the loss of a methylene group, confirming the progressive decomposition of the neutral ligand. In addition, several significant mass-charge ratios were observed in Fig.S4a: 210 (C11H14O4), 182 (C9H9O4+), 154 (C7H4O4+), 137 (C7H3O3+). Combined with the standard mass spectrogram of the acidic ligand (Fig.S4c), it can be inferred that the change from m/z=210 to m/z=182 results from the loss of one ethyl group of 3,4-DEOHBA, and that the change from m/z=182 to m/z=154 results from the loss of another ethyl group. The m/z change from 154 to 137 corresponds to the loss of a hydroxyl group; at the same time, there was CO2 produced by the decomposition of acidic ligands[38], revealing the progressive decomposition mechanism of the acidic ligand.
2.7 Fluorescent properties
The excitation spectrum of complex 1 (Fig.S5a) had a wide absorption peak between 250 and 400nm, with a peak at 321 nm, due to the π→π* transition. This wavelength was the corresponding excitation wavelength, and the emission spectrum (Fig.S5b) was obtained. There were two distinct peaks in the emission spectrum at 482nm (4F9/2→6H15/2) and 574 nm (4F9/2→6H13/2). The peak at 574 nm was more intense, which is why it emits yellow light[39].
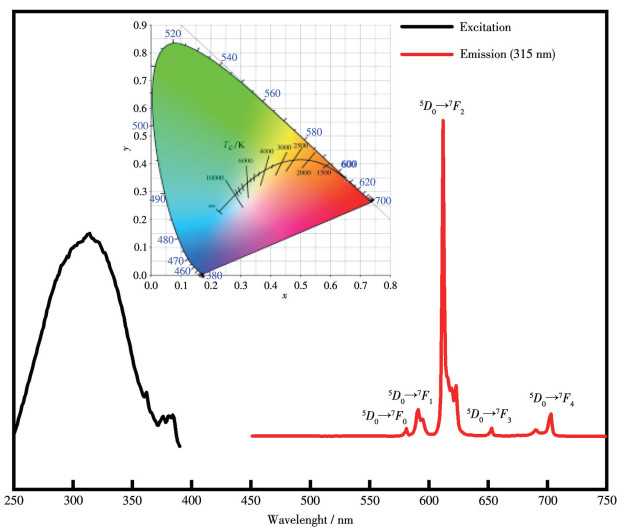
The spectral characteristics of complex 2 are shown in Fig.7, where the black line represents the excitation spectrum and the other is the emission spectrum. In the emission spectrum, the peaks were located at 580, 590, 615, 651, and 703 nm. These peaks correspond to different energy level transitions, specifically 5D0 to 7F0, 7F1, 7F2, 7F3, and 7F4 states. It can be seen that the 5D0→7F2 transition showed a stronger peak[40], which is the source of red light emitted by the europium complex. In addition, through the color coordinate analysis, the color coordinate of the complex was (0.661 5, 0.338 3).
Figure 7
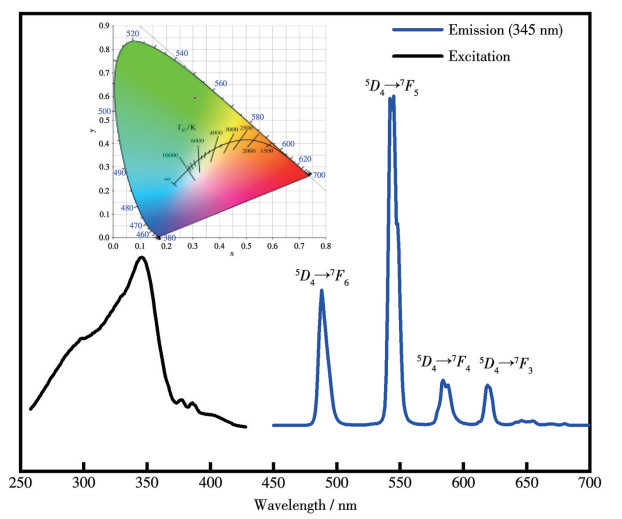
In the excitation spectrum of complex 3, the wide peak was located at 345 nm (Fig.8), and the strongest peak of the emission spectrum was located at 545 nm (5D4→7F5). In addition, there were three weak peaks located at 621 nm (5D4→7F3), 583nm (5D4→7F4), and 489 nm (5D4→7F6). Therefore, the green light of the complex is mainly due to the peak at 545 nm (5D4→7F5)[41]. Substituting into the color coordinates gave the coordinate of (0.308 2, 0.594 5).
Figure 8
As shown in Fig.S6a, complex 4 had a wide peak at 333 nm, and the peak of 333 nm was used as the excitation spectrum to obtain the corresponding emission spectrum. In Fig.S6b, three obvious peaks were observed. The transitions are 4G5/2→6H5/2 (563 nm), 4G5/2→6H7/2 (601 nm), and 4G5/2→6H9/2 (643 nm). The peak at 643 nm was more intense, so the light of complex 4 is orange-red[39-40]. The emission data for complexes 1 and 4 were substituted into color coordinates (0.301 6, 0.330 0) and (0.489 9, 0.400 9), respectively (Fig.S7).
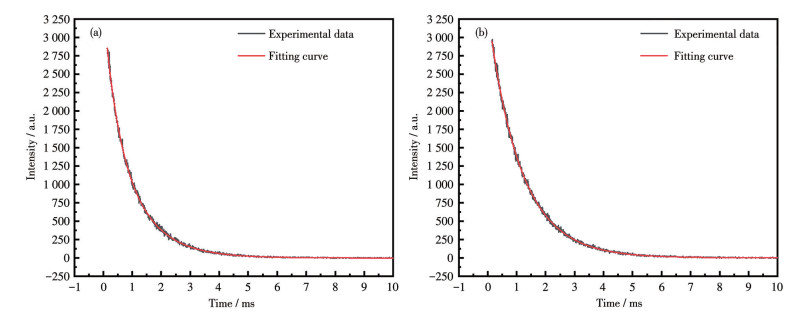
Due to the strong luminescence of complexes 2 and 3, their respective life curves were obtained, as shown in Fig.9a and 9b. The fitting equation was I(t)=B1exp(-t/τ1)+B2exp(-t/τ2), where B1 and B2 are the coefficients; I(t) is the fluorescence intensity; τ1 and τ2 are the decay times. Then, through the lifetime equation τ=(B1τ12+B2τ22)/(B1τ1+B2τ2), the calculated results were 0.807 and 0.845 ms for complexes 2 and 3, respectively.
Figure 9
3. Conclusions
In this work, six lanthanide complexes were synthesized: [Ln(3,4-DEOBA)3(4,4′-DM-2,2′-bipy)]2·2C2H5OH, where Ln=Dy (1), Eu (2), Tb (3), Sm (4), Ho (5), Gd (6); 3,4-DEOBA-=3,4-diethoxybenzoate; 4,4′-DM-2,2′-bipy=4,4′-dimethyl-2,2′-bipyridine. The single-crystal X-ray diffraction analysis results show that complexes 1-6 are triclinic crystal systems in the binuclear structure. For the fluorescence test of complex 1-4, the intensity values of transmitting data measured by experiments were normalized into the color coordinates, corresponding to yellow, red, green, and orange-red regions, respectively, so as to verify their respective luminous colors. Due to the strong fluorescence properties of complexes 2 and 3, their fluorescence lifetimes were further determined to be 0.807 and 0.845 ms, respectively. Through the analysis of the TG-DTG-DSC curve, it was found that the complex began to decompose in a range of 332-338 K, and the residue after high-temperature heating was the corresponding lanthanide oxide. The characteristics of the escaped gas were measured and compared with the infrared accumulation map and the molecular fragment mass spectrometry. The results are in agreement with the previous analysis.
Acknowledgements: The research work is supported by the National Natural Science Foundation of China (Grant No. 22273015). Conflicts of interest: The authors declare no conflicts of interest.
Supporting information is available athttp://www.wjhxxb.cn
-
-
[1]
GUTIERREZ-FINOL G M, GIMENEZ-SANTAMARINA S, HU Z, ROSALENY L E, CARDONA-SERRA S, GAITA-ARINO A. Lanthanide molecular nanomagnets as probabilistic bits[J]. Comput. Mater., 2023, 9(1): 196 doi: 10.1038/s41524-023-01149-7
-
[2]
LIU C H, ZHANG L J, BAI F Y, WANG Y, HONG Y Z, LI C R, XING Y H. Dye adsorption and fluorescence sensing behaviour about rare earth-indole carboxylic acid complexes[J]. J. Inorg. Organomet. Polym. Mater., 2018, 28(5): 1839-1849 doi: 10.1007/s10904-018-0869-9
-
[3]
REN Y X, MA Z H, GAO T, LIANG Y C. Advance progress on luminescent sensing of nitroaromatics by crystalline lanthanide-organic complexes[J]. Molecules, 2023, 28(11): 4481 doi: 10.3390/molecules28114481
-
[4]
TSARYUK V I, ZHURAVLEV K P, GAWRYSZEWSKA P. Processes of luminescence quenching in europium aromatic carboxylates with the participation of LMCT states: A brief review[J]. Coord. Chem. Rev., 2023, 489: 215206 doi: 10.1016/j.ccr.2023.215206
-
[5]
HOODA A, DALAL A, NEHRA K, KUMAR P, SINGH D, KUMAR S, MALIK R S, KUMAR R, KUMAR P. Mononuclear luminous beta-diketonate Ln(Ⅲ) complexes with heteroaromatic auxiliary ligands: Synthesis and luminescence characteristics[J]. Luminescence, 2022, 37(11): 1921-1931 doi: 10.1002/bio.4376
-
[6]
DALAL A, NRHRA K, HOODA A, SINGH D, KUMAR P, KUMAR S, MALIK R S, RATHI B. Luminous lanthanide diketonates: Review on synthesis and optoelectronic characterizations[J]. Inorg. Chim. Acta, 2023, 550: 121406 doi: 10.1016/j.ica.2023.121406
-
[7]
HUANG B H, TSAI C Y, CHEN C T, KO B T. Metal complexes containing nitrogen-heterocycle based aryloxide or arylamido derivatives as discrete catalysts for ring-opening polymerization of cyclic esters[J]. Dalton Trans., 2016, 45(44): 17557-17580 doi: 10.1039/C6DT03384A
-
[8]
ZHANG C N, SHI Y B, LIU R, LI H, CAI X W, WANG X Y, CHEN S Y, ZHENG S J, CEN P P, CHEN L. Syntheses, structures and magnetisms of dimethyl phosphate-bridged dinuclear lanthanide complexes with pentadentate macrocyclic ligand[J]. J. Mol. Struct., 2025, 1321: 139668
-
[9]
王晨璐, 宿素玲, 任宁, 张建军. 卤代芳香族羧酸与含氮配体合成镧系配合物的结构、热化学和荧光性质[J]. 物理化学学报, 2023, 39(1): 2206035WANG C L, XU S L, REN N, ZHANG J J. Construction, thermochemistry, and fluorescence properties of novel lanthanide complexes synthesized from halogenated aromatic carboxylic acids and nitrogen-containing ligands[J]. Acta Phys.‒Chim. Sin., 2023, 39(1): 2206035
-
[10]
SHI R, YU L, TIAN Y R, WANG X M, SUN Z Y, QI B, LUO F. pH response luminescence reversible lanthanide-2, 6-pyridinedicarboxylic acid complex with tunable multi-color and white light emission for fluorescent anti-counterfeiting labels and LED[J]. Mater. Chem. Phys., 2022, 280: 125806 doi: 10.1016/j.matchemphys.2022.125806
-
[11]
LI L X, WANG Y X, GAO Z Y, MAO X H, ZHANG X T, XING W, JIA C Y, HUANG L J, TANG J G. Research progress on electrospinning fluorescent nanofibers based on rare earth complex[J]. Dyes Pigment., 2024, 224: 111977 doi: 10.1016/j.dyepig.2024.111977
-
[12]
BAO G C. Lanthanide complexes for drug delivery and therapeutics[J]. J. Lumin., 2020, 228: 117622 doi: 10.1016/j.jlumin.2020.117622
-
[13]
PALANISAMY P, ANANDAN M, RAMAN G, NUTALAPATI V. Antenna effect on Zn(Ⅱ) porphyrin-based molecular ensembles for the detection of 2, 4-dinitrophenol through energy and electron transfer process[J]. Microchim. Acta, 2024, 192(1): 1
-
[14]
MIAHRA N, KUMAR K, PANDEY H, RAJ ANAND S, YADAV R, PRAKASH SRIVASTAVA S, PANDEY R. Synthesis, characterization, optical and anti-bacterial properties of benzothiazole Schiff bases and their lanthanide(Ⅲ) complexes[J]. J. Saudi Chem. Soc., 2020, 24(12): 925-933 doi: 10.1016/j.jscs.2020.09.009
-
[15]
ZHAO L H, CHEN H M, YANG A H, WU D F, GOU J, CUI J Z, GAO H L. Synthesis, characterization and properties of lanthanide complexes with different ancillary ligands[J]. Inorg. Chim. Acta, 2019, 490: 240-245 doi: 10.1016/j.ica.2019.03.030
-
[16]
KIRCHEVA V, ZAHARIEVA J, MANOLOV I, MILANOVA M. Spectral properties of Tb(Ⅲ) and Nd(Ⅲ) complexes with 3, 3′-(phenylmethylene) bis(4-hydroxy-2H-1-benzopyran-2-one)[J]. J. Optoelectron. Adv. Mater., 2021, 23(9/10): 508-517
-
[17]
SARKAR A, JANA S, NAYEK H P. A pentanuclear Er(Ⅲ) coordination cluster as a catalyst for selective synthesis of 1, 2-disubstituted benzimidazoles[J]. Appl. Organomet. Chem., 2021, 35(6): e6200 doi: 10.1002/aoc.6200
-
[18]
ZHU T T, TAO Y T, SUN Y, WANG X, ZHANG X W, CHAI J L, HAN J, ZHAO X L, CHEN X D. Lanthanide complexes based on an anthraquinone derivative ligand and applications as photocatalysts for visible-light driving photooxidation reactions[J]. J. Mol. Struct., 2021, 1236: 130289
-
[19]
CZYLKOWSKA A, CZAKIS-SULIKOWSKA D, KACZMAREK A, MARKIEWICZ M. Thermal behavior and other properties of Pr(Ⅲ), Sm(Ⅲ), Eu(Ⅲ), Gd(Ⅲ), Tb(Ⅲ) complexes with 4,4′-bipyridine and trichloroacetates[J]. J. Therm. Anal. Calorim., 2011, 105(1): 331-339 doi: 10.1007/s10973-011-1462-4
-
[20]
DAS C, UPADHYAY A, ANSARI K U, OGIWARA N, KITAO T, HORIKE S, SHANMUGAM M. Lanthanide-based porous coordination polymers: Syntheses, slow relaxation of magnetization, and magnetocaloric effect[J]. Inorg. Chem., 2018, 57(11): 6584-6598 doi: 10.1021/acs.inorgchem.8b00720
-
[21]
REJITHA K S, ICHIKAWA T, MATHEW S. Thermal decomposition studies of [Ni(NH3)6]X2 (X=Cl, Br) in the solid state using TG-MS and TR-XRD[J]. J. Therm. Anal. Calorim., 2010, 103(2): 515-523
-
[22]
MATERAZZI S, RISOLUTI R, NAPOLI A. EGA-MS study to characterize the thermally induced decomposition of Co(Ⅱ), Ni(Ⅱ), Cu(Ⅱ) and Zn(Ⅱ) complexes with 1, 1-diaminobutane-schiff base[J]. Thermochim. Acta, 2015, 606: 90-94 doi: 10.1016/j.tca.2015.03.009
-
[23]
WANG L L, WANG T F, ZHANG Y, PENG X Q, SONG W, YANG J S, YUAN C D. Oxidation behaviors of hongqian heavy crude oil characterized by TG-DSC-FTIR-MS within full temperature regions[J]. Fuel, 2023, 353: 129242 doi: 10.1016/j.fuel.2023.129242
-
[24]
ZHOU L, LI F S, WANG W C, ZHANG H C, DUAN Y Z, WANG H. Effects of phospholipids on pyrolysis and oxidation characteristics of jatropha biodiesel: TG-FTIR-MS experiment and reaxff-md simulation[J]. Fuel, 2025, 383: 133816 doi: 10.1016/j.fuel.2024.133816
-
[25]
SHELDRICK G M, SCHNEIDER T R. Shelxl: High-resolution refinement[J]. Methods Enzymol., 1997, 277: 319-343
-
[26]
SHELDRICK G M. A short history of SHELX[J]. Acta Crystallogr. Sect. A, 2008, A64: 112-122
-
[27]
MADANHIRE T, DAVIDS H, PEREIRA M C, HOSTEN E C, ABRAHAMS A. Synthesis, characterisation and anticancer activity screening of lanthanide(Ⅲ) acetate complexes with benzohydrazone and nicotinohydrazone ligands[J]. Polyhedron, 2020, 184: 114560 doi: 10.1016/j.poly.2020.114560
-
[28]
WANG C L, XU S L, LIU Z J, REN N, ZHANG J J. Synthesis, structure, fluorescence and thermochemical properties of the lanthanide complexes of 2-chloro-6-fluorobenzoic acid and 2, 2′∶6′2″-tripyridine ligands[J]. J. Solid State Chem., 2022, 315: 123454 doi: 10.1016/j.jssc.2022.123454
-
[29]
杜丹丹, 郝娅帆, 王鑫鑫, 赵金金, 任宁, 张建军. 2-氯-4-氟苯甲酸和5, 5′-二甲基-2,2′-联吡啶镧系配合物的晶体结构、光谱和热行为[J]. 无机化学学报, 2023, 39(9): 1807-1816DU D D, HAO Y F, WANG X X, ZHAO J J, REN N, ZHANG J J. Crystal structure, spectra, and thermal behavior of lanthanide complexes with 2-chloro-4-fluorobenzoic acid and 5, 5′-dimethyl-2,2′-bipyridine[J]. Chinese J. Inorg. Chem., 2023, 39(9): 1807-1816
-
[30]
HE S M, SUN S J, ZHENG J R, ZHANG J J. Molecular spectrum of lanthanide complexes with 2, 3-dichlorobenzoic acid and 2, 2-bipyridine[J]. Spectroc. Acta Pt. A‒Molec. Biomolec. Spectr., 2014, 123: 211-215 doi: 10.1016/j.saa.2013.12.023
-
[31]
赵金金, 韩雅惠, 宋子贺, 张建军. 2-氯-6-氟苯甲酸钆配合物的晶体结构及热分解反应动力学和热力学的研究[J]. 河北师范大学学报(自然科学版), 2024, 48(6): 573-581ZHAO J J, HAN Y H, SONG Z H, ZHANG J J. Crystal structure, thermal decomposition kinetics and thermodynamic properties of gadolinium complex with 2-chloro-6-fluorobenzoic acid[J]. Journal of Hebei Normal University (Natural Science), 2024, 48(6): 573-581
-
[32]
MIKHALYOVA E A, YAKOVENKO A V, ZELLER M, GAVRILENKO K S, LOFLAND S E, ADDISON A W, PAVLISHCHUK V V. Structure, magnetic and luminescence properties of the lanthanide complexes Ln2(Salphen)3·H2O (Ln=Pr, Nd, Sm, Eu, Gd, Tb, Dy; H2Salphen=N, N′-bis(salicylidene)-1, 2-phenylenediamine)[J]. Inorg. Chim. Acta, 2014, 414: 97-104 doi: 10.1016/j.ica.2014.01.034
-
[33]
DU D D, REN N, ZHANG J J. Syntheses, crystal structures, thermodynamic and fluorescent properties of dinuclear lanthanide complexes constructed with 2-fluorobenzoic acid and 5, 5′-dimethyl-2,2′-bipyridine[J]. J. Therm. Anal. Calorim., 2021, 147: 1-10
-
[34]
SASIDHARAN N, HARIHARANATH B, RAJENDRAN A G. Thermal decomposition studies on energetic triazole derivatives[J]. Thermochim. Acta, 2011, 520: 139-144 doi: 10.1016/j.tca.2011.03.031
-
[35]
CARTER K P, POPE A, CAHILL C L. A series of Ln-p-chlorobenzoic acid-terpyridine complexes: Lanthanide contraction effects, supramolecular interactions and luminescent behavior[J]. CrystEngComm, 2014, 16(10): 1873-1884 doi: 10.1039/c3ce42267d
-
[36]
WU W H, LV S F, LIU X, QU H Q, ZHANG H C, XU J Z. Using TG-FTIR and TG-MS to study thermal degradation of metal hypophosphites[J]. J. Therm. Anal. Calorim., 2014, 118(3): 1569-1575 doi: 10.1007/s10973-014-4085-8
-
[37]
PIELICHOWSKA K. Thermooxidative degradation of polyoxymethylene homo-and copolymer nanocomposites with hydroxyapatite: Kinetic and thermoanalytical study[J]. Thermochim. Acta, 2015, 600: 7-19 doi: 10.1016/j.tca.2014.11.016
-
[38]
GUSEV A, KISKIN M, LUTSENKO I, SVETOGOROV R, VEBER S, MINAKOVA O, KORSHUNOV V, TAYDAKOV I, LINERT W. Triazole-based lanthanide(Ⅲ) adducts: Photo-and thermochromic luminescence[J]. J. Lumin., 2021, 238: 118305 doi: 10.1016/j.jlumin.2021.118305
-
[39]
KUMAR M, WU L H, KARIEM M, FRANCONETTI A, SHEIKH H N, LIU S J, SAHOO S C, FRONTERA A. A series of lanthanide-based metal-organic frameworks derived from furan-2, 5-dicarboxylate and glutarate: Structure-corroborated density functional theory study, magnetocaloric effect, slow relaxation of magnetization, and luminescent properties[J]. Inorg. Chem., 2019, 58(12): 7760-7774 doi: 10.1021/acs.inorgchem.9b00219
-
[40]
LI J J, ZHANG X Q, YUE B, WANG A L, KONG L J, ZHOU J, CHU H B, ZHAO Y L. Preparation, crystal structure and luminescence properties of lanthanide complexes with 2, 4, 6-tri(pyridin-2-yl)-1, 3, 5-triazine and organic carboxylic acid[J]. Crystals, 2017, 7: 139 doi: 10.3390/cryst7050139
-
[41]
NEHRA K, DALAL A, HOODA A, KUMAR P, SINGH D, KUMAR S, MALIK R S, KUMAR P. Luminous terbium and samarium complexes with diacetylmethane and substituted 1, 10-phenanthroline derivatives for display applications: Preparation and optoelectronic investigations[J]. J. Lumin., 2022, 249: 119032 doi: 10.1016/j.jlumin.2022.119032
-
[1]
-
Figure 1 (a) Structural unit of complex 3; (b) coordination environment of the Tb3+ ion
Ellipsoid probability: 50%; Symmetry code: #1:-x+1, -y+1, -z.
Figure 2 (a) One-dimensional chain structure of complex 3; (b) 2D layer structure
Symmetry codes: #2: x-1, y, z; #3: x-1, y+1, z; #5:-x, 1-y, -z.
Figure 5 Thermal decomposition curve of complex 3
DTG=differential thermal gravimetry.
Figure 6 (a) Three-dimensional infrared spectra of escaping gases and (b) 2D infrared spectra of escaping gases for complex 3
Table 1. Elemental analysis data of complexes 1-6
Complex wC / % wH / % wN / % Found Calcd. Found Calcd. Found Calcd. 1 55.32 55.22 5.63 5.60 2.75 2.78 2 55.90 55.93 5.69 5.73 2.77 2.74 3 55.51 55.58 5.65 5.60 2.75 2.73 4 55.98 55.86 5.70 5.65 2.78 2.86 5 55.19 55.26 5.62 5.58 2.74 2.78 6 55.60 55.55 5.66 5.63 2.76 2.79  下载: 导出CSV
Table 2. Thermal decomposition data of complexes 1-6
Complex Step Temperature
range / KTp in DTG / K Weight loss rate / % Probable expelled groups Intermediate and residue Found Calcd. 1 Ⅰ 332.20-593.71 416.90 23.10 4.51a 2C2H5OH+2(4,4′-DM-2,2′-bipy) Dy2(3,4-DEOBA)6 447.09 18.05b Ⅱ 593.71-1 009.50 683.26 64.24 59.16c 6(3,4-DEOBA) Dy2O3 777.86 Total 81.34 81.72d 2 Ⅰ 332.01-604.47 450.19 24.60 4.55a 2C2H5OH+2(4,4′-DM-2,2′-bipy) Eu2(3,4-DEOBA)6 18.24b Ⅱ 604.47-1 005.36 680.28 58.66 59.78c 6(3,4-DEOBA) Eu2O3 780.53 Total 83.26 82.57d 3 Ⅰ 338.29-720.29 472.07 59.53 4.52a 2C2H5OH+2(4,4′-DM-2,2′-bipy)+x(3,4-DEOBA) Tb2(3,4-DEOBA)6-x 630.09 18.12b Ⅱ 720.29-1 008.29 815.75 21.03 58.97c (6-x)(3,4-DEOBA) 1/2Tb4O7 Total 80.56 81.61d 4 Ⅰ 337.10-588.29 468.29 22.69 4.56a 2C2H5OH+2(4,4′-DM-2,2′-bipy) 18.27b Sm2(3,4-DEOBA)6 Ⅱ 588.29-1 003.20 678.57 59.74 59.87c 6(3,4-DEOBA) Sm2O3 778.96 Total 82.43 82.70d 5 Ⅰ 335.28-608.84 443.29 21.85 4.50a 2C2H5OH+2(4,4′-DM-2,2′-bipy) Ho2(3,4-DEOBA)6 18.01b Ⅱ 608.84-1 003.36 658.36 57.51 59.02c 6(3,4-DEOBA) Ho2O3 738.41 Total 79.36 81.53d 6 Ⅰ 336.25-727.78 498.14 57.79 4.53a 2C2H5OH+2(4,4′-DM-2,2′-bipy)+x(3,4-DEOBA) Gd2(3,4-DEOBA)6-x 698.18 18.15b Ⅱ 727.78-1 008.15 808.20 23.71 59.46c (6-x)(3,4-DEOBA) Gd2O3 Total 81.50 82.14d a Two ethanol molecules are theoretically removed; b Two 4,4′-DM-2,2′-bipy molecules are theoretically removed; c Six 3,4-DEOBA- ions are theoretically removed; d Total weight loss.
下载: 导出CSV
-


 扫一扫看文章
计量
- PDF下载量: 2
- 文章访问数: 1635
- HTML全文浏览量: 175
