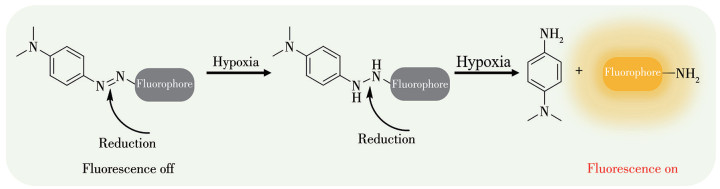
Scheme 1.
Fluorescence turn-on mechanism of AQD toward hypoxia reduction

Hypoxia[1-4] usually happens in many solid tumors because the abnormal metabolism and proliferation of tumor cells will increase the oxygen consumption, in addition to the reason that the insufficient blood vessels in tumors block the transportation of oxygen toward tumor cells[5-6]. Besides, recent studies have found that the dense extracellular matrix[7], solid stress[8], and abnormal vascular structures[9-11] in the tumor microenvironment[12] are also critical factors that may affect the oxygen content in tumor cells. Hypoxia has a great effect on the biological behavior and malignant phenotype of tumor cells, and it mediates the effects of tumor therapy through some complex mechanisms, which are closely related to the poor prognosis of tumors in many patients[13-14]. All these make hypoxia atmosphere become one of the most attractive research hotspots in tumor microenvironment (TME), of which the exact sensing offers a vital guidance for the enhanced molecular diagnostics and image-guided therapeutic applications[15-17].
Of the reported hypoxia detection approaches, functional molecule probes[18-19] allow the covalent connection of fluorophores and hypoxia-responsive moieties together for the selective imaging and therapy of tumors[20-21]. Usually, an azo bond is a well-known hypoxia-triggering group, and the introduction of the azo moiety via a covalent bond into a probe would significantly quench its fluorescence emission[22-25]. When the hypoxia-responsive probe is selectively activated by sodium dithionite (SDT, a hypoxia simulator used to generate and simulate hypoxic conditions in solution tests) under hypoxic conditions, it releases the fluorophore and shows an obvious fluorescence emission[26-30]. This hypoxia-responsive fluorescent detection method makes the imaging and diagnosis of tumors a simple operation, with low cost, good sensitivity, specific selectivity, real-time detection, etc. Although recent advances in probes with azo structures are widely applied for detecting hypoxic tumor cells, which are mainly based on different fluorophores, such as rhodamine[31-32], boron dipyrromethene[33-34], and cyanine[35]. Developing other azo-structure-based probes for the imaging of hypoxic tumor cells is fairly essential to expand the hypoxia probe library, which provides researchers more ways for tumor detection and diagnosis.
Quinoxaline derivative is a heterocyclic compound with a large conjugated planar[36-37], which often has a stable fluorescence property. Moreover, the synthesis procedures of quinoxaline-based fluorophore derivatives often have cheap raw materials, a high reaction efficiency, and a simple post-reaction processing. Quinoxaline fluorophore derivatives possess suitable fluorescence emissions that can be easily distinguished from the environment of cells[38], which shows a relatively low background fluorescent signal in cell imaging tests. Additionally, quinoxaline fluorophore derivatives also exhibit good biological activity and biocompatibility, which have been widely used in tumor cell imaging[39-41].
In this work, a fluorescent probe AQD, based on a quinoxaline fluorophore derivative, was designed to achieve hypoxia detection in tumor cells, which was synthesized by the covalent connection of a quinoxaline fluorophore derivative and a N, N-dimethylaniline moiety with an azo bond. Fluorescent probe AQD showed good selectivity toward hypoxic conditions in solution tests, and its emission intensity gradually enhanced with the increase of hypoxia degree. In addition, AQD was successfully used to conduct the hypoxia A549 cells imaging tests, which implied the potential of this probe for cell imaging applications. When the hypoxia-responsive AQD was activated under hypoxic conditions, its azo linker broke and the probe released the fluorophore[42-43], resulting in an obvious fluorescence emission (Scheme 1).
All chemicals were obtained from commercial suppliers and used without further purification. NMR spectra were measured on a Bruker Avance Ⅱ 400 NMR spectrometer and a Bruker AVANCE Ⅲ 500 NMR spectrometer (in DMSO-d6, CF3COOD or CDCl3, TMS as internal standard). ESI-MS was carried out on a Thermo Scientific Q Exactive Plus LC-MS. Fluorescent spectra were performed on an Edinburgh FLS1000 steady-state fluorescence spectrophotometer. High- performance liquid chromatography (HPLC) analysis tests were conducted in an Agilent 1100 reversed- phase system. Ultrapure water purified by the Milli-Q reference system (Millipore) was used throughout. All compounds were dissolved in DMSO to prepare a stock solution (1, 5, 10 mmol·L-1). Fluorescence cell imaging was performed on an Olympus FV1000 fluorescence microscope with a laser source at a wavelength of 405 nm.
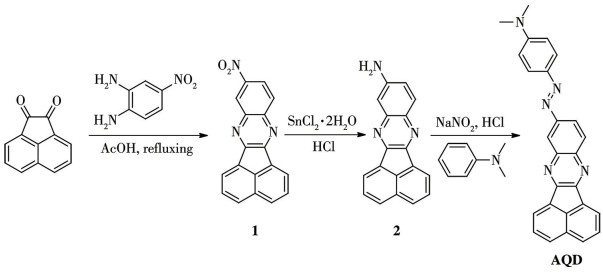
The synthetic route of probe AQD is shown in Scheme 2.
Acenaphthylene-1, 2-dione (1.82 g, 10.0 mmol) and 4-nitrobenzene-1, 2-diamine (1.53 g, 10.0 mmol) were mixed in a round-bottomed flask, and then acetic acid solution (25 mL) was added to the reaction flask. The mixture solution was stirred and refluxed at 110 ℃ for about 12 h, and the reaction solution turned into a brown, turbid liquid. After the reaction was complete, the mixture was filtered while it was hot. The light- yellow solid powder obtained by the filtration was washed with MeOH and CH2Cl2 solution three times, and dried in a vacuum, resulting in a light-yellow powder product compound 1[37]. Yield: 2.78 g, 93%. 1H NMR (500 MHz, CF3COOD): δ 8.92 (s, 1H), 8.42-8.32 (m, 1H), 8.19 (d, J=9.0 Hz, 1H), 8.12 (d, J=8.0 Hz, 1H), 8.04 (d, J=8.0 Hz, 1H), 7.66 (dd, J=15.8, 7.7 Hz, 1H). 13C NMR (101 MHz, CF3COOD): δ 150.04, 146.72, 144.13, 134.81, 131.86, 131.69, 130.07, 129.91, 125.67, 125.40, 124.13, 122.98, 121.58, 121.07, 120.38, 118.60, 118.48. Atmospheric pressure chemical ionization MS (APCI-MS, m/z): [M+H]+ Calcd. for [C18H10N3O2]+ 300.076 8, found 300.076 9.
Compound 1 (1.50 g, 5.0 mmol) and concentrated hydrochloric acid (30 mL) were added to a round- bottom flask and stirred for 10 min. Then, a white powder SnCl2·H2O (4.51 g, 20 mmol) was slowly added into the mixture at room temperature, and the reaction was stirred at 80 ℃ for over 12 h. After the reaction was complete, the reaction solution changed to a black, turbid solution. The crude product was collected by filtration, and then it was washed with hydrochloric acid (1 mol·L-1, 10 mL), NaOH solution (1 mol·L-1, 10 mL), and water (5 mL×3) orderly. Finally, it was dried under vacuum to afford the crude product, which was further recrystallized in CH2Cl2 and methanol solution to obtain the brown yellow solid compound 2. Yield: 1.23 g, 91%. 1H NMR (500 MHz, DMSO-d6): δ 8.28 (d, J=6.9 Hz, 1H), 8.18 (d, J=6.9 Hz, 1H), 8.14 (d, J=8.2 Hz, 1H), 8.09 (d, J=8.2 Hz, 1H), 7.86 (d, J=8.9 Hz, 1H), 7.84-7.78 (m, 2H), 7.25 (dd, J=8.9, 1.9 Hz, 1H), 7.14 (s, 1H), 6.13 (s, 2H). 13C NMR (126 MHz, DMSO-d6): δ 153.20, 150.50, 148.19, 143.20, 134.36, 134.32, 132.18, 131.89, 130.00, 129.51, 129.29, 128.78, 128.65, 128.20, 121.35, 120.96, 120.25, 106.88. APCI-MS (m/z): [M+H]+ Calcd. for [C18H12N3]+ 270.102 6, found 270.102 6.
Compound 2 (269 mg, 1.0 mmol) was dissolved in a mixture of hydrochloric acid (12 mol·L-1, 0.45 mL) and water (15 mL) at 0 ℃. Then, NaNO2 (228 mg, 3.3 mmol) dissolved in 2 mL of water was slowly dripped into the acidified mixture solution. The mixture solution was stirred in an ice bath for 3 h to obtain the reddish brown, clear diazonium salt solution. After that, urea (120 mg, 2.0 mmol) was added to the reaction solution and stirred for 30 min. N, N-dimethylaniline (785 mg, 3.6 mmol) was dissolved in 5 mL EtOH, and the solution was stirred and cooled down to 0-5 ℃[44]. The diazonium salt solution was added dropwise into the above EtOH solution within 30 min. After the mixture had reacted in an ice bath for 12 h, the mixture was poured into 100 mL of saturated brine. The precipitate was collected by filtration and washed with excess water several times (10 mL×6). The residue was purified by column chromatography on silica gel (VCH2Cl2∶Vmethanol=200∶1) to give the probe AQD as a red powder solid. Yield: 315 mg, 78%. 1H NMR (500 MHz, CDCl3): δ 8.58 (d, J=2.0 Hz, 1H), 8.40 (d, J=6.9 Hz, 1H), 8.36 (d, J=6.9 Hz, 1H), 8.26 (dd, J=8.9, 2.1 Hz, 1H), 8.19 (d, J=8.9 Hz, 1H), 8.04 (dd, J=8.2, 2.9 Hz, 1H), 7.93 (d, J=9.0 Hz, 1H), 7.80 (dd, J=14.4, 6.8 Hz, 1H), 6.74 (d, J=9.0 Hz, 1H), 3.07 (s, 1H). 13C NMR (126 MHz, CDCl3): δ 153.44, 152.82, 152.01, 151.70, 142.76, 140.97, 140.83, 135.40, 130.83, 130.77, 129.01, 128.93, 128.43, 127.61, 124.47, 124.17, 120.98, 120.82, 120.78, 110.47, 39.23. ESI-MS (m/z): [M+H]+ Calcd. for [C26H20N5]+ 402.171 3, found 402.171 8.
The probe AQD and the fluorophore (compound 2) stock solution were prepared with dimethyl sulfoxide (DMSO) to a concentration of 10, 5, and 1 mmol·L-1, respectively. AQD stock solution was diluted to obtain 10 μmol·L-1 with phosphate-buffered saline (PBS, 10 mmol·L-1, pH=7.4, 10% DMSO), and the fluorescent tests were performed in that concentration. The emission stability tests of the fluorophore under different pH values (from 5.0 to 8.0) and at different times were conducted to investigate the imaging application potential in solution, which was the basis of the further cell imaging. The excitation wavelength of the fluorophore and probe AQD was set at 400 nm in PBS (10 mmol·L-1, pH=7.4, 10% DMSO), and the maximum emission wavelength of AQD and its hypoxia reduction product showed around 550 nm.
It's necessary to evaluate whether the interference of other ions and biomolecules will affect the accurate imaging and detection results of the probe toward hypoxic tumor cells, which is important for their application potential in the complex life system. With these in mind, a broader range of relevant ions and biomolecules were selected to conducted the tests, including metal ions (Na+, K+, Ca2+, Cu2+, Mg2+, and Zn2+, 20 mmol·L-1), glucose (50 mmol·L-1), adenosine triphosphate (ATP, 10 mmol·L-1), glutathione (GSH, 10 mmol·L-1), H2O2 (10 mmol·L-1), amino acids [L-Glutamic acid (L-Glu), L-Tyrosine (L-Tyr), L-Arginine (L-Arg), L-Aspartic acid (L-Asp), L-Proline (L-Pro), L-Homocysteine (L-Hcy), L-Cysteine (L-Cys), 10 mmol·L-1], bovine serum albumin (BSA, 10 μg·L-1), glucose oxidase (Gluox, 10 μg·L-1), and cytochrome C (Cyt C, 10 μg·L-1). These distractors were mixed with AQD (10 μmol·L-1) for 3 h in PBS (10 mmol·L-1, pH=7.4, 10% DMSO), and the results were compared with those of SDT (5 mmol·L-1) and AQD (10 μmol·L-1). The excitation wavelength of all solutions was set at 400 nm, and the relative intensity at 550 nm was used to evaluate the selectivity of AQD.
HPLC tests were used to evaluate the hypoxia- responsive mechanism of probe AQD. Firstly, fluorophore and AQD solutions (10 mmol·L-1) were configured in DMSO, respectively, and then they were diluted to a concentration of 100 μmol·L-1 in methanol. The initial mobile phase conditions of HPLC were set as 70% methanol and 30% pure water. After 5 min of gradient elution, the mobile phase was changed to 100% methanol and 0% pure water. The subsequent mobile phase was still 100% methanol for 15 min elution. Then, three experimental groups, 100 μmol·L-1 fluorophore, 100 μmol·L-1 AQD, and 100 μmol·L-1 AQD with 100 mmol·L-1 SDT reacting for 12 h, were analyzed for 10 μL under these conditions. The hypoxia-responsive mechanism of AQD can be explained by the peak retention time of the three groups of experiments.
Cell culture and foetal bovine serum were purchased from Gibco (Thermo Fisher Scientific). A549 cells (human alveolar basal epithelial cells derived from lung tissue) were cultured in 1640 medium with 10% foetal bovine serum and % penicillin-streptomycin under 5.0% (volume fraction) CO2 at 37 ℃. All cells were maintained at 37 ℃ under 5% CO2 in air (the standard conditions). Before the experiment, cells were treated under different hypoxic conditions (O2 concentration of 20%, 8%, or 0.1%) for another 8 h. The hypoxic condition of 0.1% O2 was generated with an Anaero Pack TM-Anaero (Mitsubishi Gas Chemical Company, Inc.) and a 2.5 L rectangular jar (Mitsubishi Gas Chemical Company, Inc.). The hypoxic condition of 8% O2 was generated with an Anaero Pack TM-Micro Aero (Mitsubishi Gas Chemical Company, Inc.) and a 2.5 L rectangular jar.
To generate different hypoxia, cells were incubated for 8 h at 37 ℃ under different hypoxic conditions (8% or 0.1% O2). The cells were further incubated with probe AQD (10 μmol·L-1) for another 120 min under different hypoxia levels for cell imaging. Fluorescence imaging of cells was performed by incubation with probe AQD (10 μmol·L-1) for 0, 30, 60, 120, and 180 min. After being washed with PBS three times, the dishes were used for imaging. Fluorescence cell imaging was performed on an Olympus FV1000 fluorescence microscope with a laser source at a wavelength of 405 nm, and fluorescence signals of the cells were collected at 510-610 nm.
The large conjugated planar probe AQD was designed by covalent connection of acenaphtho[1, 2-b]quinoxaline moiety and N, N-dimethylaniline moiety with an azo bond. As shown in Scheme 2, probe AQD was synthesized by a diazotization coupling reaction between fluorophore and N, N-dimethylaniline, resulting in a brick red powder solid product. Structures of intermediates and AQD were confirmed by 1H NMR, 13C NMR, and MS spectra (Fig.S1-S9, Supporting information).
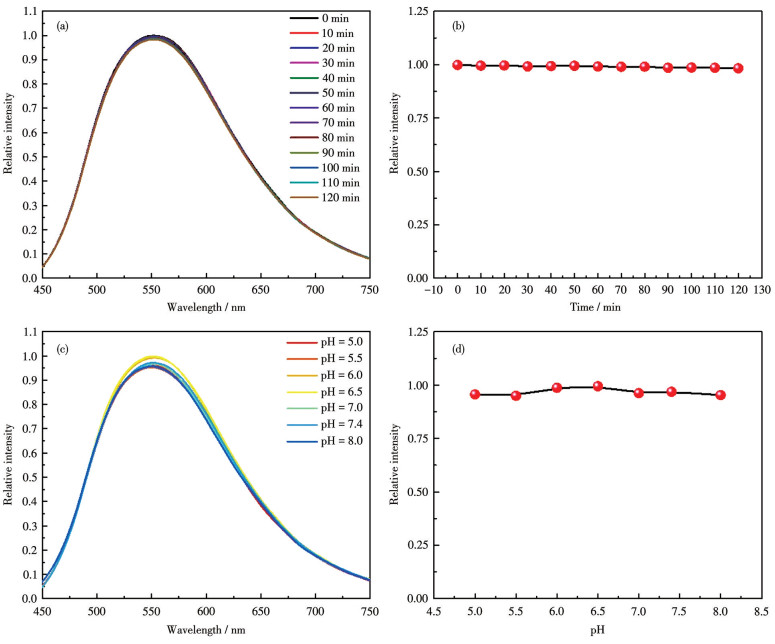
In consideration of the cells′ imaging application of AQD, the stability of the fluorophore (compound 2) needed to be investigated. The fluorophore showed a higher emission intensity with the increase of DMSO content in PBS (Fig.S10), and the solution of fluorescence tests was chosen as PBS (10 mmol·L-1, pH=7.4, 10% DMSO). Time-dependent UV-Vis spectra tests of compound 2 were performed in PBS (Fig.S11), and the UV-Vis absorption showed little changes with time, indicating the good stability of the fluorophore. Similarly, time-dependent fluorescence tests of compound 2 (10 μmol·L-1) were conducted in PBS (Fig. 1a). The results showed that the emission of fluorophore around 550 nm had little change within 3 h, showing its relatively good fluorescence stability (Fig. 1b). This could guarantee a certain stability of the fluorescence signal generated from probe AQD in solution tests or cell imaging tests. In addition, we also conducted the fluorescence tests of the fluorophore (10 μmol·L-1) in various pH values (Fig. 1c and 1d). The data showed that the emission intensity of the fluorophore at 550 nm had little change around physiological pH conditions (from 6.5 to 7.4). All these indicated our probe AQD had a relatively good stability in cell imaging.
λex=400 nm.
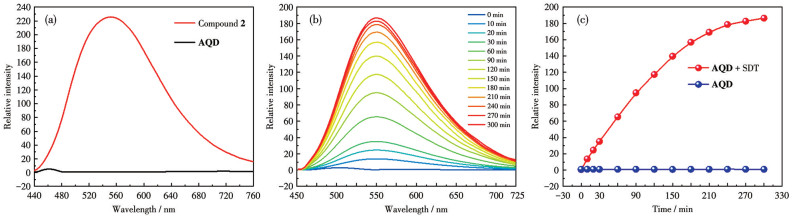
Because of the hypoxia-triggering ability of the azo bond, probe AQD may have a fluorescence response to the hypoxia-reducing atmosphere. To begin with, the fluorescence emission spectra of AQD and compound 2 were conducted in PBS, respectively, to evaluate the potential emission intensity of AQD. Probe AQD in the test had no emission, and compound 2 showed over 200-fold fluorescent emission in the same testing condition (Fig. 2a), which indicated the reduction product of probe AQD (fluorophore compound 2) had a good fluorescence response signal and the test results were not interfered by other compounds without fluorescent emission. In this work, sodium hyposulfite was selected to simulate a hypoxic environment in solution tests, and the added concentration of SDT was positively correlated with the degree of hypoxia. Fluorescence spectra changes of AQD (10 μmol·L-1) with time were recorded to investigate the hypoxia-responsive reaction (Fig. 2b). The relative fluorescence intensity changes of AQD (10 μmol·L-1) at 550 nm with or without the addition of SDT were recorded for 3 h (Fig. 2c). The test results indicated that the fluorescence intensity of the AQD solution increased with time going on after the addition of SDT, and the initial reaction rate was the fastest upon the addition of SDT. The fluorescence spectra of AQD with the addition of SDT were similar to that of fluorophore compound 2, which implied hypoxia reduction of AQD would release the fluorophore and result in a fluorescence emission recovery. All these tests exhibited the good fluorophore response of AQD toward hypoxic conditions.
λex=400 nm, λem=550 nm.
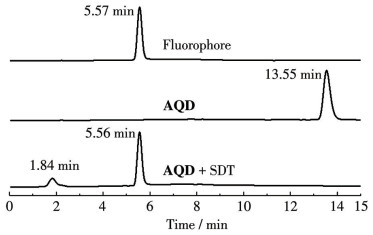
As is known to all, azo compound shows sensitivity toward hypoxia-reducing atmosphere, which will be reduced into amino compounds eventually. Besides, azo compound usually has little fluorescence emission due to their quenching effect on fluorophores. While the hypoxia reduction of AQD would release the fluorophore and show the fluorescence response signal. To investigate this fluorescence response mechanism of AQD, the HPLC tests[45] were performed to analyze its reduction product (Fig. 3). AQD (100 μmol·L-1) reacted with SDT (100 mmol·L-1) for 4 h, and then the reaction mixture was analyzed by HPLC. AQD (100 μmol·L-1) and fluorophore compound 2 (100 μmol·L-1) were also analyzed by HPLC as the control group experiments. According to the HPLC results, the addition of SDT into AQD solution resulted in a peak that had the same retention time as that of fluorophore compound 2, which indicates the break of the azo bond and the release of fluorophore. Therefore, the azo-bond- breaking mechanism is the reason for the fluorescence response of AQD.
Selective response ability and low cytotoxicity are essential for a fluorescent probe to be used in biological applications. Before the application of probe AQD in cell imaging, the interference effect of other ions and biomolecules in living organisms was investigated to determine whether they would affect the detection accuracy of hypoxic conditions[46]. Various ions and biomolecules had little effect on the fluorescence response of AQD, and the results implied that AQD showed good selectivity toward hypoxia among these interfering substances. Additionally, MTT assay was also conducted to evaluate the cytotoxicity of AQD toward A549 cells[47]. The results showed that the cell viability was over 80% with the incubation of different concentrations of AQD, indicating the low cytotoxicity of AQD. These tests prove the selective response ability toward hypoxia and the low cytotoxicity of AQD, and it has potential applications in cell imaging.
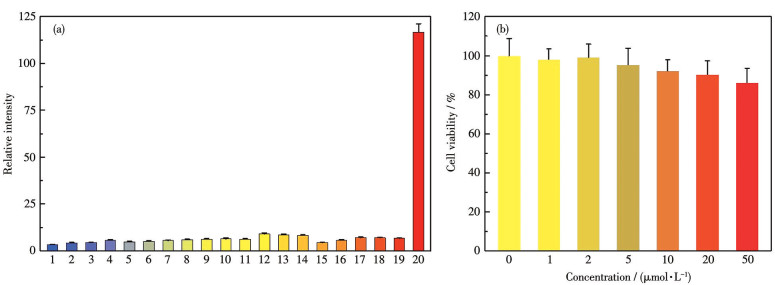
1: Na+, 2: K+, 3: Ca2+, 4: Cu2+, 5: Mg2+, 6: Zn2+, 7: L-Glu, 8: L-Tyr, 9: L-Arg, 10: L-Asp, 11: L-Pro, 12: L-Hcy, 13: L-Cys, 14: GSH, 15: H2O2, 16: ATP, 17: BSA, 18: Gluox, 19: Cyt C, 20: SDT; Data were presented as the mean value±SD (n=3).
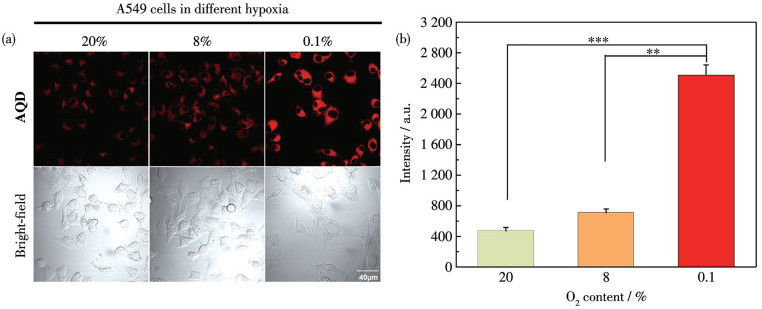
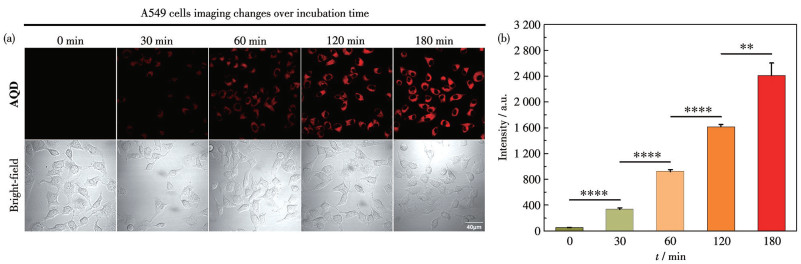
Hypoxia is a general characteristic in many tumors, where the abnormal glycolytic activity results in a lower O2 level than that in normal tissue cells[48-50]. To investigate the imaging performance toward the hypoxic tumor cells[51], AQD was used to conduct the A549 cell imaging tests in different O2 concentrations (20%, 8%, or 0.1%). A549 cells were pretreated with different O2 concentrations for 8 h, and then A549 cells were incubated with AQD for another 3 h to perform the confocal imaging tests (Fig. 5a). The cell imaging effect of AQD became better with the increase of hypoxia degree, after being incubated for the same time. The fluorescence imaging intensity of cells was measured to evaluate the imaging effect in different hypoxic conditions (Fig. 5b). The data indicated that the imaging effect of AQD toward A549 cells in 0.1% O2 was better than that in 8% or 20% O2 condition, showing its selectively response toward hypoxic tumor cells. Additionally, A549 cells were pretreated in 0.1% O2 concentration for 8 h, and then they were incubated with AQD for different time to evaluate the confocal imaging effect with time (Fig. 6a). The fluorescence intensity of cells was measured to investigate the imaging effect with different incubation time in the same hypoxic condition (Fig. 6b). The cell imaging effect of AQD became better with the increase of incubation time in the same hypoxic condition. All these results implied the good hypoxia-responsive imaging ability of AQD in tumor cells.
Scale bar=40 μm; Data were presented as the mean value±SD (n=3, *p < 0.05, **p < 0.01, ***p < 0.001).
Scale bar=40 μm; Data were presented as the mean value±SD (n=3, *p < 0.05, **p < 0.01, ***p < 0.001).
In summary, a novel hypoxia-responsive fluorescent probe AQD was synthesized for the detection and imaging of hypoxic tumor cells, which was obtained by the covalent connection of a large planar conjugated fluorophore and a N, N-dimethylaniline moiety via the azo bond. AQD was used to detect hypoxic conditions by fluorescence enhancement in PBS solution, which showed a significantly fluorescent emission at 550 nm after reduction. AQD exhibited excellent biocompatibility and a good selectivity toward hypoxia, and other ions and biomolecules hardly interfered with the detection results. Additionally, it had been successfully applied for the imaging of hypoxia in A549 cells, providing a way for the detection of hypoxic tumors.
QUEEN A, BHUTTO H N, YOUSUF M, SYED M A, HASSAN M I. Carbonic anhydrase Ⅸ: A tumor acidification switch in heterogeneity and chemokine regulation[J]. Semin. Cancer Biol., 2022, 86: 899-913. doi: 10.1016/j.semcancer.2022.01.001
SINGLETON D C, MACANN A, WILSON W R. Therapeutic targeting of the hypoxic tumour microenvironment[J]. Nat. Rev. Clin. Oncol., 2021, 18: 751-772. doi: 10.1038/s41571-021-00539-4
CHEN Z, HAN F, DU Y, SHI H, ZHOU W. Hypoxic microenvironment in cancer: Molecular mechanisms and therapeutic interventions[J]. Signal Transduct. Target. Ther., 2023, 8: 70. doi: 10.1038/s41392-023-01332-8
LEE P, CHANDEL N S, SIMON M C. Cellular adaptation to hypoxia through hypoxia inducible factors and beyond[J]. Nat. Rev. Mol. Cell Biol., 2020, 12: 468-474.
ZHOU Q, XIANG J J, QIU N S, WANG Y C, PIAO Y, SHAO S Q, TANG J B, ZHOU Z X, SHEN Y Q. Tumor abnormality-oriented nanomedicine design[J]. Chem. Rev., 2023, 123: 10920-10989. doi: 10.1021/acs.chemrev.3c00062
CHEN D P, TANG Y Y, ZHU J W, ZHANG J J, SONG X J, WANG W J, SHAO J J, HUANG W, CHEN P, DONG X C. Photothermal-pHhypoxia responsive multifunctional nanoplatform for cancer photo chemo therapy with negligible skin phototoxicity[J]. Biomaterials, 2019, 221: 119422. doi: 10.1016/j.biomaterials.2019.119422
NIA H T, MUNN L L, JAIN R K. Physical traits of cancer[J]. Science, 2020, 370: eaaz0868. doi: 10.1126/science.aaz0868
STYLIANOPOULOS T, MARTIN J D, CHAUHAN V P, JAIN R K. Causes, consequences, and remedies for growth-induced solid stress in murine and human tumors[J]. Proc. Natl. Acad. Sci. U. S. A., 2012, 109: 15101-15108. doi: 10.1073/pnas.1213353109
ACHARYA S, SAHOO S K. PLGA nanoparticles containing various anticancer agents and tumor delivery by EPR effect[J]. Adv. Drug Deliv. Rev., 2011, 63: 170-183. doi: 10.1016/j.addr.2010.10.008
CHEN Y Z, SONG W T, SHEN L M, QIU N S, HU M Y, LIU Y, LIU Q, HUANG L. Vasodilator hydralazine promotes nanoparticle penetration in advanced desmoplastic tumors[J]. ACS Nano, 2019, 13: 1751-1763.
FUKUMURA D, JAIN R K. Tumor microvasculature and microenvironment: Targets for antiangiogenesis and normalization[J]. Microvasc. Res., 2007, 74: 72-84. doi: 10.1016/j.mvr.2007.05.003
BINNEWIES M, ROBERTS E W, KERSTEN K, CHAN V, FEARON D F, MERAD M, COUSSENS L M, GABRILOVICH D I, ROSENBERG S O, HEDRICK C C, VONDERHEIDE R H, PITTET M J, JAIN R K, ZOU W P, HOWCROFT T K, WOODHOUSE E C, WEINBERG R A, KRUMMEL M F. Understanding the tumor immune microenvironment (TIME) for effective therapy[J]. Nat. Med., 2018, 24: 541-550. doi: 10.1038/s41591-018-0014-x
SEMENZA G L. Hypoxia-inducible factors: Coupling glucose metabolism and redox regulation with induction of the breast cancer stem cell phenotype[J]. EMBO J., 2017, 36: 252-259. doi: 10.15252/embj.201695204
WU J C, WANG X, CHEN L, WANG J N, ZHANG J L, TANG J H, JI Y T, SONG J Y, WANG L, ZHAO Y X, ZHANG H, LI T H, SHENG J P, CHEN D, ZHANG Q, LIANG T B. Oxygen microcapsules improve immune checkpoint blockade by ameliorating hypoxia condition in pancreatic ductal adenocarcinoma[J]. Bioact. Mater., 2023, 20: 259-270.
ZHU H T Z, LI Q, SHI B B, GE F J, LIU Y Z, MAO Z W, ZHU H, WANG S, YU G C, HUANG F H, STANG P J. Dual-emissive platinum(Ⅱ) metallacage with a sensitive oxygen response for imaging of hypoxia and imaging guided chemotherapy[J]. Angew. Chem. - Int. Edit., 2020, 59: 20208-20214. doi: 10.1002/anie.202009442
ZHOU F, FU T, HUANG Q, KUAI H L, MO L T, LIU H L, WANG Q Q, PENG Y B, HAN D M, ZHAO Z L, FANG X H, TAN W H. Hypoxia-activated PEGylated conditional aptamer/antibody for cancer imaging with improved specificity[J]. J. Am. Chem. Soc., 2019, 141: 18421-18427. doi: 10.1021/jacs.9b05063
YAO S Y, YUE Y X, YING A K, HU X Y, LI H B, CAI K, GUO D S. An antitumor dual responsive host guest supramolecular polymer based on hypoxia-cleavable azocalix[J]. Angew. Chem.-Int. Edit., 2023, 62: e202213578. doi: 10.1002/anie.202213578
SHARMA A, ARAMBULA J F, KOO S, KUMAR R, SINGH H, SESSLER J L, KIM J S. Hypoxia targeted drug delivery[J]. Chem. Soc. Rev., 2019, 48: 771-813. doi: 10.1039/C8CS00304A
ZHANG S P, CHEN H, WANG L P, QIN X, JIANG B P, JI S C, SHEN X C, LIANG H. A general approach to design dual ratiometric fluorescent and photoacoustic probes for quantitatively visualizing tumor hypoxia levels in vivo[J]. Angew. Chem.-Int. Edit., 2022, (61): e202107076.
ZHOU S Y, HU X L, XIA R, LIU S, PEI Q, CHEN G, XIE Z G, JING X B. A paclitaxel prodrug activatable by irradiation in a hypoxic microenvironment[J]. Angew. Chem. - Int. Edit., 2020, 59: 2319823205.
DU J J, SHI T C, LONG S R, CHEN P Z, SUN W, FAN J L, PENG X J. Enhanced photodynamic therapy for overcoming tumor hypoxia: From microenvironment regulation to photosensitizer innovation[J]. Coord. Chem. Rev., 2021, 427: 213604. doi: 10.1016/j.ccr.2020.213604
CHEVALIER A, HARDOUIN J, RENARD P Y, ROMIEU A. Universal dark quencher based on"clicked"spectrally distinct azo dyes[J]. Org. Lett., 2013, 15: 6082-6085. doi: 10.1021/ol402972y
CHEVALIER A, MASSIF C, RENARD P Y, ROMIEU A. Bioconjugatable azo-based dark-quencher dyes: Synthesis and application to protease activatable far red fluorescent probes[J]. Chem. - Eur. J., 2013, 19: 1686-1699. doi: 10.1002/chem.201203427
CHEVALIER A, RENARD P Y, ROMIEU A. Azosulforhodamine dyes: A novel class of broad spectrum dark quenchers[J]. Org. Lett., 2014, 16: 3946-3949. doi: 10.1021/ol501753b
VERWILST P, HAN J Y, LEE J, MUN S, KANG H G, KIM J S. Reconsidering azobenzene as a component of small-molecule hypoxiamediated cancer drugs: A theranostic case study[J]. Biomaterials, 2017, 115: 104-114. doi: 10.1016/j.biomaterials.2016.11.023
GENG W C, JIA S R, ZHENG Z, LI Z H, DING D, GUO D S. A noncovalent fluorescence turn on strategy for hypoxia imaging[J]. Angew. Chem.-Int. Edit., 2019, 58: 2377-2381.
LI X D, WEI Y S, WU Y C, YIN L C. Hypoxia-induced pro-protein therapy assisted by a self catalyzed[J]. Angew. Chem. - Int. Edit., 2020, 59: 22544-22553. doi: 10.1002/anie.202004008
SHE D J, HUANG H H, LI J M, PENG S J, WANG H, YU X R. Hypoxia-degradable zwitterionic phosphorylcholine drug nanogel for enhanced drug delivery to glioblastoma[J]. Chem. Eng. J., 2021, 408: 127359. doi: 10.1016/j.cej.2020.127359
DONG B L, SONG W H, KONG X Q, ZHANG N, LIN W Y. Visualizing cellular sodium hydrosulfite (Na2S2O4) using azo-based fluorescent probes with a high signal-to-noise ratio[J]. J. Mater. Chem. B, 2019, 7: 730-733. doi: 10.1039/C8TB02487A
CHEVALIER A, PIAO W, HANAOKA K, NAGANO T, RENARD P Y, ROMIEU A. Azobenzene caged sulforhodamine dyes: A novel class of'turn-on'reactive probes for hypoxic tumor cell imaging[J]. Methods Appl. Fluoresc., 2015, 3: 044004.
PIAO W, TSUDA S, TANAKA Y, MAEDA S, LIU F Y, TAKAHASHI S, KUSHIDA Y, KOMATSU T, UENO T, TERAI T, NAKAZAWA T, UCHIYAMA M, MOROKUMA K, NAGANO T, HANAOKA K. Development of azo based fluorescent probes to detect different levels of hypoxia[J]. Angew. Chem.-Int. Edit., 2013, 52: 13028-13032. doi: 10.1002/anie.201305784
CHEVALIER A, MERCIER C, SAUREL L, ORENGA S, RENARD P Y, ROMIEU A. The first latent green fluorophores for the detection of azoreductase activity in bacterial cultures[J]. Chem. Commun., 2013, 49: 8815-8817. doi: 10.1039/c3cc44798g
CEINOS S G, RIVERO A R, GELLA F R, FUENTE S S, PASTOR S G, CALVO N, ORREGO A H, GUISAN J M, CORRAL I, RODRIGUEZ F S, RIBAGORDA M. Turn-on fluorescent biosensors for imaging hypoxia-like conditions in living cells[J]. J. Am. Chem. Soc., 2022, 144: 8185-8193. doi: 10.1021/jacs.2c01197
KUMARI R, SUNIL D, NINGTHOUjAM R S, KUMAR N A. Azodyes as markers for tumor hypoxia imaging and therapy: An up-todate review[J]. Chem.-Biol. Interact., 2019, 307: 91-104. doi: 10.1016/j.cbi.2019.04.034
WANG C Y, ZHANG S P, HUANG J H, CUI L, HU J, TAN S Y. Novel designed azo substituted semi cyanine fluorescent probe for cytochrome P450 reductase detection and hypoxia imaging in cancer cells[J]. RSC Adv., 2019, 9: 21572-21577. doi: 10.1039/C9RA02741F
MAHESHWARAN M, KUMAR K K S. DFT and electrochemical determination of Hg2+ and Pb2+ in water using polyaniline-quinoxaline composite modified GCE electrode[J]. J. Mol. Liq., 2024, 398: 124317. doi: 10.1016/j.molliq.2024.124317
ZHU W P, DAI M, XU Y F, QIAN X H. Novel nitroheterocyclic hypoxic markers for solid tumor: Synthesis and biological evaluation[J]. Bioorg. Med. Chem., 2008, 16: 3255-3260. doi: 10.1016/j.bmc.2007.12.011
CUI C F, GAO X, JIA X C, JIAO Y, DUAN C Y. A rhodamine Bbased turn on fluorescent probe for selective recognition of mercury(Ⅱ) ions[J]. Inorg. Chim. Acta, 2021, 520: 120285. doi: 10.1016/j.ica.2021.120285
HASANINEjAD A, ZARE A, MOHAMMADIZADEH M R, SHEKOUHY M. Lithium bromide as an efficient, green, and inexpensive catalyst for the synthesis of quinoxaline derivatives at room temperature[J]. Green Chem. Lett. Rev., 2010, 3: 143-148. doi: 10.1080/17518251003619192
ELMES R B P. Bioreductive fluorescent imaging agents: Applications to tumor hypoxia[J]. Chem. Commun., 2016, 52: 8935-8956. doi: 10.1039/C6CC01037G
ZHANG H, FAN J L, WANG J Y, ZHANG S Z, DOU B R, PENG X J. An off-on COX-2-specific fluorescent probe: Targeting the golgi apparatus of cancer cells[J]. J. Am. Chem. Soc., 2013, 135: 11663-11669. doi: 10.1021/ja4056905
LUO S H, LIU Y C, WANG F Y, FEI Q, SHI B, AN J C, ZHAO C C, TUNG C H. A fluorescent turn-on probe for visualizing lysosomes in hypoxic tumor cells[J]. Analyst, 2016, 141: 2879-2882. doi: 10.1039/C6AN00369A
CHEVALIER A, RENARD P Y, ROMIEU A. Azo-based fluorogenic probes for biosensing and bioimaging: Recent advances and upcoming challenges[J]. Chem.-Asian J., 2017, 12: 2008-2028. doi: 10.1002/asia.201700682
YILDIZ E, KARADENIZ B, YILDIZ A M, RENCUZOGULLARI E. 由蒽醌衍生的二价和三价过渡金属配合物及其致突变-畸变作用[J]. 无机化学学报, 2013,29,(3): 595-604. YILDIZ E, KARADENIZ B, YILDIZ A M, RENCUZOGULLARI E. Bivalent and trivalent transition metal complexes of azo compounds derived from anthraquinone and their mutagenic-teratogenic effects[J]. Chinese J. Inorg. Chem., 2013, 29(3): 595-604.
张晶晶, 严鸣, 卢雯, 徐莉, 王小青. 基于香豆素-肟的次氯酸根探针的设计、合成及荧光成像应用[J]. 无机化学学报, 2021,37,(6): 1071-1079. ZHANG J J, YAN M, LU W, XU L, WANG X Q. Bivalent and trivalent transition metal complexes of azo compounds derived from anthraquinone and their mutagenic-teratogenic effects[J]. Chinese J. Inorg. Chem., 2021, 37(6): 1071-1079.
张长丽, 张晶晶, 沈优, 陆嘉成, 黄芳, 徐莉. 一种快速响应的线粒体靶向荧光探针用于检测活细胞和斑马鱼中的次氯酸盐[J]. 无机化学学报, 2022,38,(8): 1623-1632. ZHANG C L, ZHANG J J, SHEN Y, LU J C, HUANG F, XU L. A highly sensitive ratiometric fluorescence probe for Zn2+ detection in living cells[J]. Chinese J. Inorg. Chem., 2022, 38(8): 1623-1632.
王成, 杨曼, 邓祥义, 何明礼. 一种检测亚硫酸氢根的苯并咪唑类荧光增强型探针及其实际应用[J]. 无机化学学报, 2020,36,(4): 762-768. WANG C, YANG M, DENG X Y, HE M L. A fluorescence-enhanced probe based on benzimidazole for bisulfite and its practical application[J]. Chinese J. Inorg. Chem., 2020, 36(4): 762-768.
LIU Y R, ZHANG D T, QU Y W, TANG F, WANG H, DING A X, LI L. Advances in small-molecule fluorescent pH probes for monitoring mitophagy[J]. Chem. Biomed. Imaging, 2024, 2: 81-97. doi: 10.1021/cbmi.3c00070
GONZALEZ G A, OSUjI E U, FIUR N C, CLARK M G, MA S, LUKOV L L, ZHANG C. Alteration of lipid metabolism in hypoxic cancer cells[J]. Chem. Biomed. Imaging, 2025, 3: 25-34. doi: 10.1021/cbmi.4c00050
CHEN Y Y, JIANG H, HAO T T, ZHANG N, LI M Y, WANG X Y, WANG X X, WEI W, ZHAO J. Fluorogenic reactions in chemical biology: Seeing chemistry in cells[J]. Chem. Biomed. Imaging, 2023, 1: 590-619. doi: 10.1021/cbmi.3c00029
时建朝, 田雨蔓, 吴伟娜, 王元, 李小侠. 一例喹喔啉酰腙荧光探针对锌离子的选择性高灵敏识别及细胞成像应用[J]. 无机化学学报, 2023,39,(7): 1295-1302. SHI J C, TIAN Y M, WU W N, WANG Y, LI X X. A quinoxalinecontaining Schiff base probe for the selective and sensitive detection of Zn2+ and imaging application in living cells[J]. Chinese J. Inorg. Chem., 2023, 39(7): 1295-1302.

Figure 1 (a) Time-dependent fluorescence tests of compound 2 (10 μmol•L-1) in PBS (10 mmol•L-1, pH 7.4, 10% DMSO); (b) Relative fluorescence intensity changes against time at 550 nm; (c) Fluorescence tests of compound 2 (10 μmol•L-1) in various pH values (pH=5.0, 5.5, 6.0, 6.5, 7.0, 7.4, 8.0) of PBS (10 mmol•L-1, 10% DMSO); (d) Relative fluorescence intensity changes against various pH values at 550 nm
λex=400 nm.

Figure 2 (a) Fluorescence tests of AQD (10 μmol•L-1) and compound 2 (10 μmol•L-1) in PBS (10 mmol•L-1, pH=7.4, 10% DMSO)under the same excitation light at 400 nm; (b) Fluorescence spectra changes of AQD (10 μmol•L-1) with time after the addition of SDT (20 mmol•L-1); (c) Relative emission intensity changes of AQD at 550 nm as a function of time following the addition of SDT (20 mmol•L-1)
λex=400 nm, λem=550 nm.

Figure 3 HPLC analysis of AQD (100 μmol•L-1), fluorophore compound 2 (100 μmol•L-1), and AQD (100 μmol•L-1) treated withSDT (100 mmol•L-1) for 10 h

Figure 4 (a) Selectivity of AQD (10 μmol•L-1) in the presence of various ions, biomolecules, or SDT in PBS (10 mmol•L-1, pH=7.4, 10% DMSO); (b) Relative cell viability of A549 cells with different concentrations of AQD for 24 h estimated by MTT assay in normoxia
1: Na+, 2: K+, 3: Ca2+, 4: Cu2+, 5: Mg2+, 6: Zn2+, 7: L-Glu, 8: L-Tyr, 9: L-Arg, 10: L-Asp, 11: L-Pro, 12: L-Hcy, 13: L-Cys, 14: GSH, 15: H2O2, 16: ATP, 17: BSA, 18: Gluox, 19: Cyt C, 20: SDT; Data were presented as the mean value±SD (n=3).

Figure 5 (a) Fluorescence confocal microscopy images of A549 cells incubated with probe AQD (10 μmol•L-1) for 3 h at different O2 levels (20%, 8%, and 0.1%); (b) Cells imaging intensity changes of A549 cells incubated with probe AQD (10 μmol•L-1) for 3 h at different O2 levels (20%, 8%, and 0.1%)
Scale bar=40 μm; Data were presented as the mean value±SD (n=3, *p < 0.05, **p < 0.01, ***p < 0.001).

Figure 6 (a) Fluorescence confocal microscopy images of A549 cells incubated with probe AQD (10 μmol•L-1) at 0.1% O2 level for different times (0, 30, 60, 120, and 180 min); (b) Cells imaging intensity changes of A549 cells incubated with probe AQD (10 μmol•L-1) at 0.1% O2 level for different times
Scale bar=40 μm; Data were presented as the mean value±SD (n=3, *p < 0.05, **p < 0.01, ***p < 0.001).

 扫一扫看文章

扫一扫关注我们
 下载:
下载:

 下载:
下载:

 下载:
下载: