Figure 1.
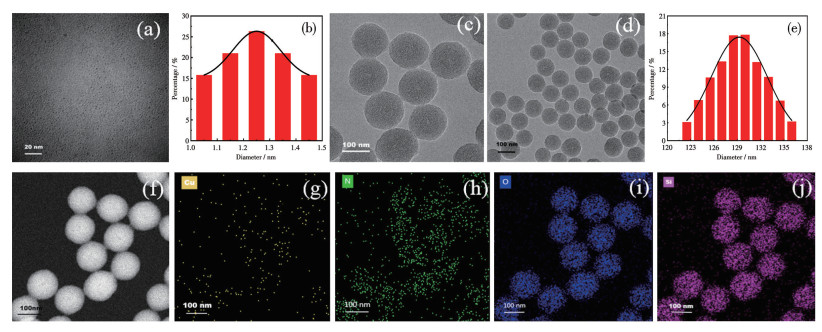
TEM images (a, c, d) and particle size distribution diagrams (b, e) of Cu NCs (a, b) and Cu NCs/CSNPs (c, d, e); HAADF-STEM (f) and EDS elemental mappings (g-j) of Cu NCs/CSNPs
Chitosan/silica-coated copper nanoclusters: Synthesis and application in cefixime detection
Rui TIAN , Jiamin CHAI , Junyu CHEN , Yuan REN , Xuehua SUN , Haoyu LI , Yuecheng ZHANG

In recent years, fluorescence metal nanoclusters have undergone rapid development owing to their molecule-like properties and attractive features, such as discrete energy levels and strong fluorescence[1-2]. These features make them ideal nanomaterials for diverseapplications[3-5]. While most research on fluorescent probes has focused on noble metal nanoclusters (e.g., Au, Ag, and Pd) due to their intense intrinsic fluorescence[6-7]. Unlike noble metals, Cu is an inexpensive and resource-rich metallic element. Compared to noble metal nanoclusters, Cu nanoclusters (Cu NCs) offer the advantages of low preparation costs[8]. Thus, replacing noble metal nanoclusters with low-cost Cu NCs provides significant cost benefits for applications in certain fields. However, the low fluorescence quantum yield (QY), poor stability, and weak fluorescence responsiveness of Cu NCs to some biologically active molecules have severely limited their application in analytical detection. Therefore, enhancing the fluorescence intensity and sensitivity of Cu NCs remains a crucial challenge.
Previous studies have demonstrated that templating agents, such as proteins, peptides, polymers, and DNA, can serve dual roles as both stabilizing andreducing agents, thereby improving the structural stability, biocompatibility, and photoluminescent properties of metal nanoclusters[9-12]. Nevertheless, it should be noted that the fluorescence QY and the stability of most Cu NCs remain suboptimal[13]. Various approaches have been explored to enhance the fluorescence performance of Cu NCs, including noble metal doping[14], template protection[15], and aggregation-induced emission enhancement[16]. Recent advances have shown that spatial confinement of Cu NCs within zero-dimensional[17], two-dimensional[18-19], and three-dimensional[20] matrices can significantly boost fluorescence emission and stability.
Silica has emerged as an excellent matrix material for nanocomposites due to its non-toxicity, biocompatibility, and biodegradability[21]. In recent years, considerable research efforts have been devoted to developing silica-based composite materials[22-24]. As for fluorescent nanosensing applications, many examples include silica-coated carbon dots[25], silica-encapsulated fluorescent dye[26], metal complexes[27], and metal nanoparticles[28]. Compared with other fluorescence enhancement strategies based on confinement effects, silica-encapsulated metal nanoclusters offer distinct advantages in terms of facile functionalization. However, current silica- encapsulated metal nanoclusters exhibit limited fluorescence enhancement capability and poor sensing performance. Therefore, developing novel encapsulation approaches and enhancing the fluorescence sensing performance of silica-composited metal nanoclusters remains of significant importance.
Cefixime (Cfx), as a third-generation oral cephalosporin antibiotic, is widely employed in treating various bacterial infections affecting the respiratory and gastrointestinal systems[29-30]. However, long-term use of such medications can lead to drug resistance and may harm the ecosystem and human health[31]; therefore, quantitative detection of Cfx is essential. Current detection methods for Cfx, including high-performance liquid chromatography (HPLC)[32], electrochemical techniques[33], spectrophotometry[34], and Raman spectroscopy[35], while sensitive and selective, often suffer from operational complexity, high costs, and lengthy procedures. Thus, there is a need to develop novel methods for Cfx detection that are simple, rapid, and cost- effective. Fluorescence-based assays, known for their ease of use, selectivity, and cost-effectiveness, have been widely used for Cfx detection. For example, Masoudyfar et al.[36] reported a gold nanoparticles- based sensor for Cfx detection in pharmaceutical samples, Irani-Nezhad et al.[37] used the tungsten disulfide quantum dots (WS2 QDs) for ratiometric fluorescence detection of Cfx in the milk samples.
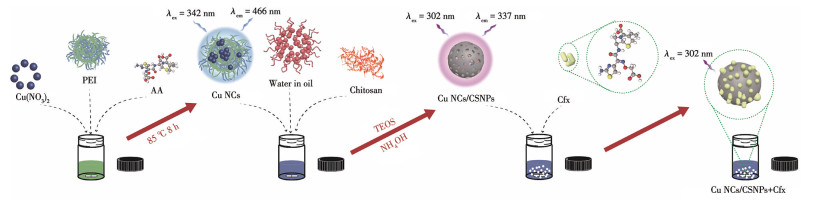
Herein, we developed a sensitive fluorescence probe based on chitosan-functionalized silica nanoparticles (CSNPs)-coated Cu NCs (Cu NCs/CSNPs) for Cfx detection. Cu NCs/CSNPs were synthesized using a reverse microemulsion technique. The composite material demonstrated significantly enhanced fluorescence intensity and sensing capability compared to bare Cu NCs. When used as a fluorescence probe for detecting Cfx, Cu NCs/CSNPs demonstrated good sensitivity and selectivity, making them suitable for the determination of Cfx in real samples.
Ascorbic acid (AA) was purchased from Jindong Tianzheng Fine Chemical Reagent Factory (Tianjin, China). Chitosan was obtained from Aladdin (Shanghai, China). Cupric nitrate (Cu(NO3)2), polyethylenimine (PEI, Mw=10 000), cyclohexane, n-hexyl alcohol, Triton X-100, NH3·H2O, and tetraethyl orthosilicate (TEOS) were purchased from Macklin Biochemical Co., Ltd. (Shanghai, China). All chemicals were of analytical grade and used as received without further purification. Ultra-pure water (18.25 MΩ·cm) was prepared using an ultra-pure water system (ULUPUER, China). Cfx standard substance (99.7%) was purchased from Beijing Zhongkezhijian Biotechnology Co., Ltd.(Beijing, China).
A multi-position magnetic stirrer (IKA, Germany) and a high-speed centrifuge (Cence, China) were used for the preparation of Cu NCs and Cu NCs/CSNPs. The morphologies were characterized using a transmission electron microscope (TEM, Talos F200X, Thermo Fisher Scientific, USA, 120 kV). X-ray photoelectron spectroscopy (XPS, Thermo Escalab 250Xi, USA, Al Kα irradiation, 150 W, λ=0.833 9 nm, U=15 kV, I=12 mA, binding energy range: 0-1 500 eV) analysis was performed to detect the valence states of elements.Fluorescence spectra were acquired with an F-2700 fluorescence spectrofluorometer (Hitachi, Japan).Ultraviolet-visible (UV-Vis) spectra were recorded on a UV-2550 spectrophotometer (Shimadzu, Japan). Fourier transform infrared (FTIR) spectra were obtained with an IR-440 (Shimadzu, Japan), employing the KBr pellet method. The FLS-1000 fluorescence spectrophotometer (Edinburgh Instruments, UK) was used to measure the fluorescence lifespan.
Cu NCs were synthesized by chemical reduction of Cu(NO3)2 in aqueous solution according to a previously reported method with minor modifications[38]. Specifically, 3.00 mL PEI solution (0.01 mol·L-1) was mixed with 9.0 mL ultrapure water under vigorous stirring for 5 min. Subsequently, 0.35 mL of Cu(NO3)2 (0.1 mol·L-1) and 0.10 mL of AA (0.1 mol·L-1) were simultaneously added to the mixture. The reaction mixture was then heated to 85.0 ℃ and maintained under continuous stirring (570 r·min-1) for 8 h. Following the reaction, the solution was dialyzed against ultrapure water using a cellulose dialysis membrane (molecular weight cut off: 3 500 Da) for 48 h to remove unreacted precursors and byproducts. The resulting Cu NCssolution was stored at room temperature in amber vials before use.
Cu NCs/CSNPs were synthesized via a reversed-phase microemulsion method[39]. First, 7.5 mL of cyclohexane, 1.8 mL of n-hexanol, and 1.8 mL of Triton X-100 were thoroughly mixed and stirred for 10 min at room temperature. Subsequently, 200 μL Cu NCs solution was added to the mixture under continuous stirring for 30 min to form a stable water-in-oil reversed-phase microemulsion. Following this, 100 μL of chitosan solution (mass fraction of 0.1% in acetic acid) was added into the system while maintaining stirring. After 30 min of equilibration, 100 μL of TEOS and 100 μL of NH4OH aqueous solution (mass fraction of 25%) were added drop by drop. The reaction was continued for 24 h at room temperature under mechanical stirring. Finally, the microemulsion was demulsified by adding 10 mL of acetone, and Cu NCs/CSNPs were collected by centrifugation (8 000 r·min-1, 10 min). The sediment was washed sequentially with absolute ethanol and ultra-pure water (three cycles each), then redispersed in ultra-pure water to obtain a purified Cu NCs/CSNPs dispersion.
1.25 mL of Cu NCs/CSNPs dispersion and 1.25 mL of KH2PO4-Na2HPO4 buffer (pH=6.09) were mixed to form the fluorescence probe solution, and its initial fluorescence intensity (F0) was recorded. Then, different concentrations of Cfx solutions were added to the solution and incubated at 35 ℃ for 5 min. The quantitative detection of Cfx was achieved by monitoring the fluorescence quenching efficiency, calculated asΔF/F0=(F0-F)/F0, where F0 represents the fluorescence intensity of the pristine probe solution, and F denotes the intensity after Cfx addition, both measured under identical instrumental conditions.
Serum samples were pretreated following a modified literature protocol[40], with the detailed procedure outlined as below: first, the serum samples were sonicated in an ultrasonic bath for 30 min. Then, 1.0 mL of treated serum was vortex-mixed with 3.0 mL of a mass fraction of 15% trichloroacetic acid for protein precipitation. After 10 min of phase separation by centrifugation, the clear supernatant was collected and neutralized to pH 7.0 by dropwise addition of NaOH solution under constant pH monitoring. Finally, the processed sample was filtered through a 0.22 μm nylon membrane and diluted 20-fold with ultrapure water. The final working solutions were used for analysis as soon as possible.
TEM characterization revealed that both Cu NCs (Fig.1a) and Cu NCs/CSNPs (Fig.1c, 1d) exhibited monodisperse spherical morphologies with average particle diameters of (1.3±0.2) nm (Fig.1b) and (128.7±2.6) nm (Fig.1e), respectively. The high-angle annular dark-field scanning transmission electron microscopy (HAADF-STEM) image (Fig.1f) of Cu NCs/CSNPs demonstrated the presence of high-contrast nanodomains in the silica matrix, suggesting successful incorporation of Cu NCs into the silica matrix. The elemental mapping results of the energy dispersive X-ray spectroscopy (EDS) (Fig.1g) demonstrated that the distribution of Cu element was relatively dispersed, while the high-density distribution areas coincided with the distributions of N, O, and Si elements (Fig.1h-1j). This observation further indicates the successful compositing of Cu NCs with the silica matrix. These results collectively indicated that Cu NCs were successfully embedded within the silica matrix while maintaining a well-dispersed state without observable agglomeration.
Fluorescence spectroscopy (the excitation and emission slits were both 10 nm) analysis revealed significant blue shifts in both excitation and emission wavelengths of Cu NCs upon silica encapsulation. The pristine Cu NCs exhibited excitation/emission maximum at 342/466 nm (Fig.2a, dashed line), whereas Cu NCs/CSNPs demonstrated blue-shifted peaks at 302/337 nm (Fig.2a, solid line). Concomitantly, the QY showed a 4-fold enhancement, increasing from 0.95% for Cu NCs to 3.84% for Cu NCs/CSNPs. This trend aligns with previous reports on silica-encapsulated fluorophores[41], where restricted molecular motion and reduced non-radiative decay pathways contribute to the improved photophysical properties. The fluorescence attenuation curve and fluorescence lifetime determination value (Fig.2b and Table 1) further corroborated the modified photodynamics, showing a prolonged average lifetime from 5.45 ns (Cu NCs) to 9.49 ns (Cu NCs/CSNPs). This lifetime extension may originate from the alteration of the microenvironment imposed by the silica matrix. On the one hand, the silica coating reduces surface defects and oxidation of nanoclusters; on the other hand, the rigid matrix restricts molecular movement[42]. Fluorescence stability testing demonstrated the superior photostability of Cu NCs/CSNPs compared to bare Cu NCs at room temperature (Fig.2c). This can be attributed to the silica coating suppressing aggregation and surface oxidation of Cu NCs, improving their stability.
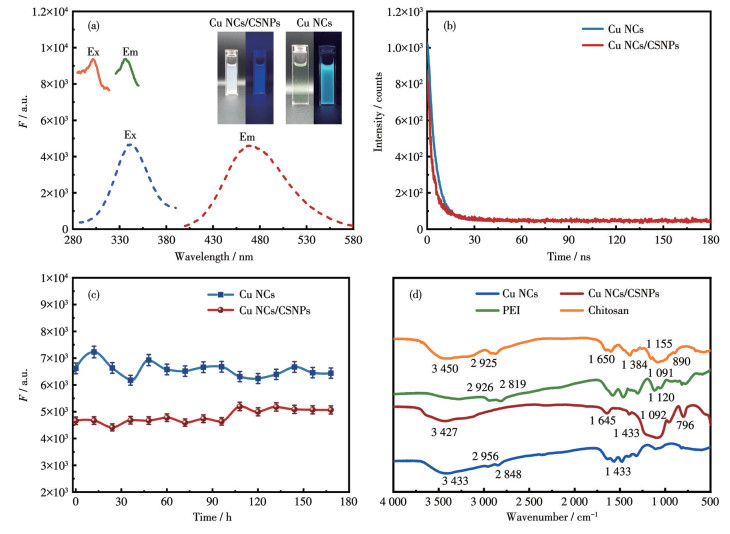
In a: Cu NCs (dashed line) and Cu NCs/CSNPs (solid line); Inset: optical photographs under visible light (left) and ultraviolet light (right).
 下载:
导出CSV
下载:
导出CSV
| Sample | τ1 / ns | A1 / % | τ2 / ns | A2 / % | τ3 / ns | A3 / % | τ / ns |
| Cu NCs | 4.43 | 83.48 | 9.01 | 15.82 | 45.98 | 0.70 | 5.45 |
| Cu NCs/CSNPs | 2.64 | 50.20 | 9.76 | 41.32 | 48.63 | 8.49 | 9.49 |
| *τ: the time constant of fluorescence decay, τ1: the short lifetime, τ2: the intermediate lifetime, τ3: the long lifetime; A: the relative contribution ratio of each life component in the total attenuation, A1: the short lifetime component amplitude, A2: the intermediate lifetime component amplitude, A3: the long lifetime component amplitude. | |||||||
FTIR spectra of Cu NCs and Cu NCs/CSNPs are shown in Fig.2d. The results proved the successful binding of copper atomic clusters with PEI by the presence of N—H stretching vibration (3 433 cm-1), C—N skeletal stretching (1 433 cm-1), and —CH2 asymmetric/symmetric stretching (2 956 and 2 848 cm-1)[43]. For the Cu NCs/CSNPs composite, the spectrum revealed successful integration of chitosan and silica through the characteristic C—C/C—N skeletal vibration at 1 433 cm-1, C—H out-of-plane bending at 796 cm-1, asymmetric stretching vibrations of the Si—O—Si bond at 1 092 cm-1, and Si—OH stretching vibration at 3 427 cm-1 [44]. The diagnostic N—H deformation modes at 1 645 cm-1 (wagging) were preserved in both Cu NCs and Cu NCs/CSNPs, confirming structural retention of PEI and chitosan functionalities[45].
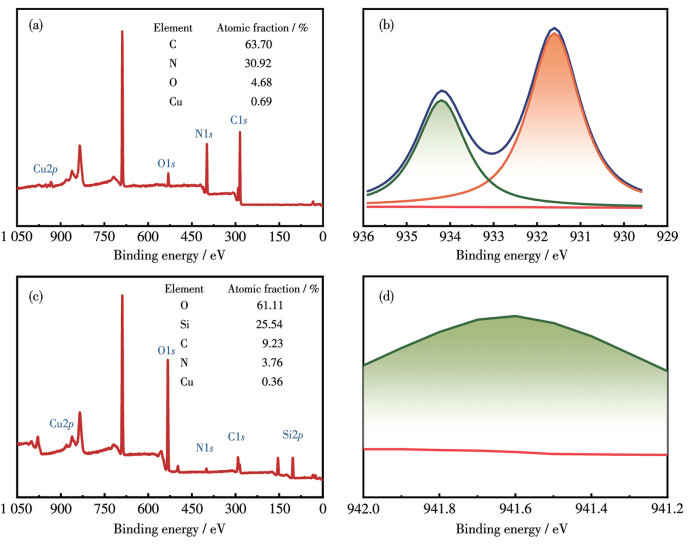
Furthermore, XPS analysis was employed to provide the chemical speciation of copper in both Cu NCs and Cu NCs/CSNPs. The survey XPS spectrum of pristine Cu NCs (Fig.3a) revealed characteristic signals for C1s, N1s, O1s, and Cu2p orbitals. High-resolution Cu2p spectra (Fig.3b) demonstrated two deconvoluted peaks at binding energies of 931.6 and 934.2 eV, indicating the presence of Cu0 and Cu2+ species[46-47]. Since the binding energy difference between Cu0 and Cu+ is only about 0.1 eV, the existence of Cu+ cannot be completely excluded[48]. Further analysis by Auger electron spectroscopy (Fig.S1, Supporting information) indicates the presence of Cu0 in CuNCs[49]. In contrast, the XPS survey spectrum of Cu NCs/CSNPs (Fig.3c) exhibited additional Si2p signatures, confirming successful silica incorporation. As for Cu NCs/CSNPs, the XPS survey spectrum showed the typical elements C, N, O, Cu, and Si (Fig.3c), and the Cu2p spectrum (Fig.3d) demonstrated a dominant peak at 941.6 eV, which can be attribute to Cu2+ [50].
FL: fluorescence.
All these results indicate that Cu NCs were successfully incorporated into the silica matrix, leading to a significant enhancement in the fluorescence intensity of Cu NCs/CSNPs. Furthermore, the synthesized Cu NCs/CSNPs demonstrate potential as highly sensitive fluorescent probes for analytical applications. These findings suggest that Cu NCs/CSNPs may have broad applications in multiple fields, including but not limited to fluorescent sensing, bioimaging, and environmental monitoring. The synthesis strategy of Cu NCs/CSNPs is schematically illustrated in Scheme 1.
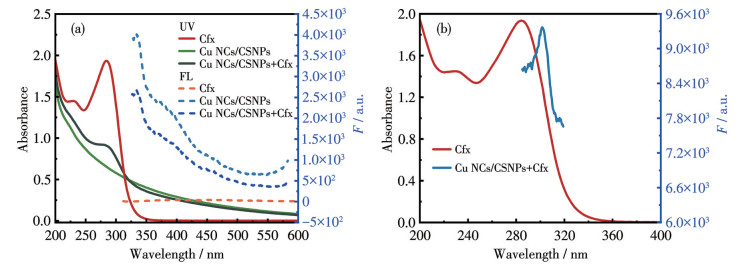
Preliminary fluorescence tests revealed that Cfx induced significant fluorescence quenching in Cu NCs/CSNPs, whereas bare Cu NCs exhibited no suchresponse. To investigate the quenching mechanism, systematic spectral analyses were performed (Fig.4). As can be seen from Fig.4a, the introduction of Cfx to the Cu NCs/CSNPs system resulted in the emergence of new absorption peaks, which were distinct from the characteristic bands of pure Cfx or Cu NCs/CSNPs alone. This observation suggests the formation of a non-fluorescent ground-state complex between Cfx and Cu NCs/CSNPs, indicative of static quenching[51]. Furthermore, Fig.4b revealed a partial overlap between theabsorption peak of Cfx and the emission peak of Cu NCs/CSNPs, suggesting that an inner filter effect (IFE) may contribute to the observed fluorescence quenching[52]. UV-Vis adsorption spectroscopy further confirmed significant spectral changes upon Cfx addition, supporting the proposed dual quenching mechanism involving both static quenching and IFE.
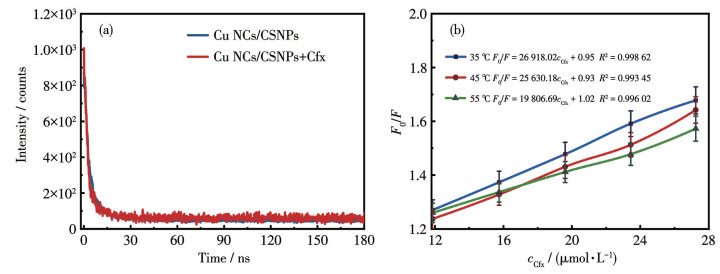
To further investigate the quenching mechanism, complementary analyses were performed through fluorescence lifetime measurements and temperature- dependent Stern-Volmer studies. The fluorescence lifetime analysis revealed nearly identical decay profiles for Cu NCs/CSNPs before (9.49 ns) and after (9.43 ns) Cfx addition (20.0 μmol·L-1), as demonstrated in Fig.5a and Table 2. This negligible variation in lifetime (Δτ=0.06 ns) strongly supports a static quenching mechanism rather than dynamic collision-based quenching[53]. The Stern-Volmer relationship wasemployed to quantitatively analyze the quenchingbehavior: F0/F=1+KSVcCfx, where F0 and F represent the fluorescence intensities of Cu NCs/CSNPs in the absence and presence of Cfx, respectively, cCfx denotes the Cfx concentration, and KSV is the Stern-Volmer quenching constant. As shown in Fig.5b, the KSV values exhibited a characteristic temperature-dependentdecrease from 35 to 55 ℃. This inverse correlation between temperature and KSV provides additional evidence for the ground-state complex, confirming the static quenching nature of the interaction[54].
 下载:
导出CSV
下载:
导出CSV
| Sample | τ1 / ns | A1 / % | τ2 / ns | A2 / % | τ3 / ns | A3 / % | τ / ns |
| Cu NCs/CSNPs | 2.64 | 50.20 | 9.76 | 41.32 | 48.63 | 8.49 | 9.49 |
| Cu NCs/CSNPs+Cfx | 1.92 | 65.70 | 10.32 | 29.34 | 103.36 | 4.97 | 9.43 |
Based on the above, we conceive that the fluorescence quenching is attributed to the combined static quenching and IFE. A proposed mechanistic illustration of this process is presented in Scheme 1.
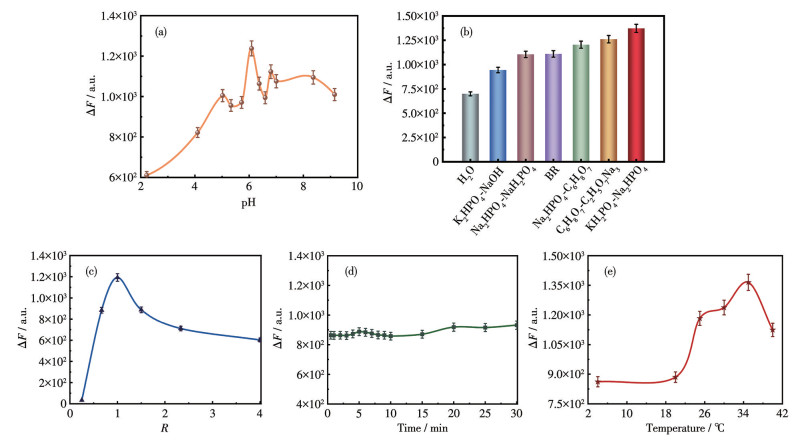
To establish a sensitive detection method for Cfx, the detection conditions were investigated in detail.Under experimental conditions, with other factors unchanged, the effects of pH, buffer type, dilution ratio, and reaction time on detection sensitivity were separately examined. First of all, considering the effect on fluorescence stability of Cu NCs/CSNPs and the sensing ability to Cfx, the appropriate pH value and type of buffer medium of the sensing system were determined. As depicted in Fig.6a, pH-dependent fluorescence quenching analysis revealed significant variations in quenching efficiency across the tested pH range (2-10). The ΔF value exhibited a progressive enhancement with increasing pH, reaching maximum response at pH 6.09. This optimal pH condition was subsequently employed for buffer medium selection. Comparative evaluation of different buffer systems demonstrated superior ΔF response in potassium phosphate buffer (KH2PO4-Na2HPO4), as evidenced in Fig.6b, establishing it as the optimal medium for subsequent analyses.
Other conditions were kept consistent as follows, except for the variables. Buffer solution: KH2PO4-Na2HPO4, pH=6.09, volume of buffer: 1.25 mL, volume of Cu NCs/CSNPs: 1.25 mL, temperature: 35 ℃, reaction time: 5 min, and Cfx: 20.0 μmol·L-1; BR=Britton-Robinson buffer solution.
Subsequently, the effects of buffer dilution ratio, incubation time, and temperature on the ΔF of the Cu NCs/CSNPs system were investigated. As illustrated in Fig.6c, ΔF increased as the volume ratio (R) of Cu NCs/CSNPs to buffer solution varied from 0.25 to 4, and reached a maximum at a ratio of 1. Therefore, an optimal ratio of 1 was selected for subsequent experiments. The influence of incubation time on ΔF revealed that the signal stabilized within 5.0 min and remained constant for up to 30 min (Fig.6d), suggesting rapid binding kinetics. Hence, 5.0 min was chosen as the detection time. Furthermore, the action temperature test results showed that ΔF increased continuously when the temperature increased from 4 to 40 ℃ and reached a maximum at 35 ℃, likely due to enhanced molecular interactions at moderately elevated temperatures (Fig.6e).
Under optimal conditions, the fluorescence quenching behavior of Cu NCs/CSNPs by Cfx wasinvestigated (Fig.7). The experimental results demonstrated that the fluorescence intensity at 337 nm progressively decreased with increasing Cfx concentration. A linear correlation was established between the quenching efficiency ΔF/F0 and cCfx ranging from 3.98 to 38.5 μmol·L-1, which could be described by the regression equation: ΔF/F0=1.21×104cCfx+0.065 4 (R2=0.999). The limit of detection (LOD) calculated using the 3σ criterion (three times the standard deviation of blank signals divided by the slope of the calibration curve) was determined to be 0.045 5 μmol·L-1 (equivalent to 20.6 μg·L-1). Comparative analysis with existing literature (as shown in Table 3) revealed that the proposed method exhibits superior or comparable analytical performance to previously reported approaches.
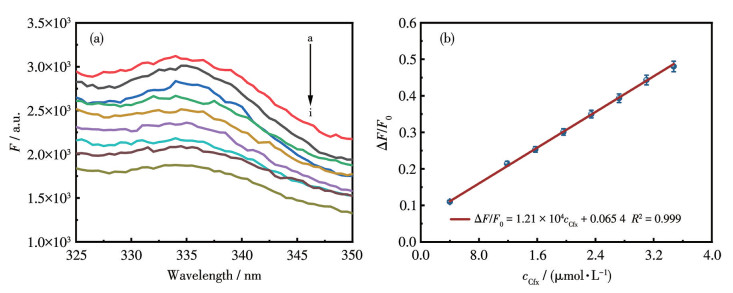
From a to j, the concentrations were 0, 4.0, 11.9, 15.7, 19.6, 23.4, 27.2, 31.0, 34.7, 38.5 μmol·L-1, respectively.
下载:
导出CSV
| Method | Sensing material | Linear range / (μmol·L-1) | LOD / (μmol·L-1) | Ref. |
| Electrochemical | CdO NPs | 0.1-12 | 0.06 | [55] |
| Electrochemical | IL/CoFe2O4/rGO | 0.06-700 | 0.035 | [56] |
| Fluorometry | Carbon dots | 0.2-8 | 0.05 | [57] |
| Fluorometry | [Zn(dia)(bpeh)]·3H2O | 0-28.0 | 0.17 | [58] |
| Fluorometry | Cu NCs/CSNPs | 3.98-38.5 | 0.045 5 | This work |
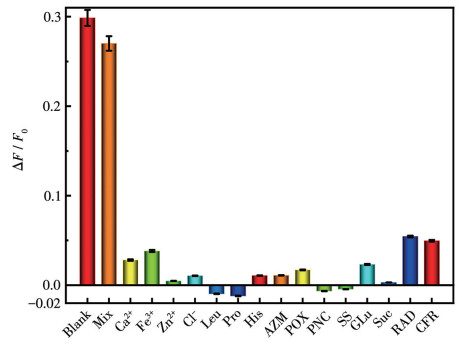
To evaluate the selectivity of the proposed sensing method, a comprehensive interference study was conducted using common substances such as Ca2+, Fe3+, Zn2+, Cl-, L-leucine (Leu), L-proline (Pro), L-histidine (His), azithromycin (AZM), roxithromycin (ROX), penicillin sodium (PNC), soluble starch (SS), glucose (GLu), sucrose (Suc), cefradine (RAD), and cefadroxil (CFR). As shown in Fig.8, under the same experimental conditions employed for Cfx detection, the responses often-fold concentrations of interferents could be ignored except for RAD and CFR. Since their analogous therapeutic profiles, these cephalosporins will not be clinically co-administered, thereby influencing the results in terms of drug quality identification or therapeutic drug monitoring applications. Notably, when challenged with mixtures containing Cfx (20.0 μmol·L-1) and ten-fold concentrations of interferents, the detection system maintained satisfactory results. These findings collectively demonstrate that the developed sensing platform possesses satisfactory anti-interference capability and holds significant promise for Cfx determination in complex samples.
To validate the practical applicability of the Cu NCs/CSNP-based sensing platform, spike-and-recovery experiments on Cfx-free biological matrices (including bovine serum, human serum, and rabbit serum) following the experimental method. Known concentrations of Cfx standard solutions were introduced into these matrices, followed by quantitative analysis using the proposed method. As shown in Table 4, the spiked recoveries of Cfx in serum samples ranged from 93.01%-106.7% with relative standard deviation (RSD) between 1.01% to 3.99%. This performance metric not only validates the method′s reliability in real-sample analysis but also demonstrates its potential applicability for therapeutic drug monitoring in complex biological systems.
下载:
导出CSV
| Sample | Measured concentration / (μmol·L-1) |
Spiked concentration / (μmol·L-1) |
Found concentration / (μmol·L-1) |
Recovery / % | RSD / % |
| Calf serum | — | 11.9 | 11.1 | 93.28 | 2.75 |
| 19.6 | 18.7 | 95.41 | 1.86 | ||
| 27.2 | 25.3 | 93.01 | 3.99 | ||
| Human serum | — | 11.9 | 11.1 | 93.28 | 3.22 |
| 19.6 | 20.7 | 105.6 | 1.27 | ||
| 27.2 | 26.4 | 97.06 | 1.62 | ||
| Rabbit serum | — | 11.9 | 12.7 | 106.7 | 1.59 |
| 19.6 | 19.8 | 101.0 | 3.79 | ||
| 27.2 | 25.8 | 94.85 | 1.01 |
In conclusion, Cu NCs were successfully encapsulated within a silica matrix through a facile reversed-phase microemulsion method. The resultant Cu NCs/CSNP composite exhibited superior fluorescence characteristics compared to pristine Cu NCs, including enhanced QY and improved photostability. Based on the Cu NCs/CSNPs, a fluorescence-quenching-based sensing platform was developed for high-performance Cfx detection, demonstrating excellent analytical parameters. The validated method was effectivelyapplied to Cfx quantification in multi-species serum samples with satisfactory recoveries (93.01%-106.7%) and precision (RSD < 4%). The method not only offers a practical way to sensitive and accurate analysis of Cfx in biological samples, but also pioneers a generic strategy for engineering metal nanoclusters-doped silica nanocomposites, and opens up new avenues for pharmaceutical analysis through rational nanomaterial design.
LI Q, MOSQUERA M A, JONES L, PARAKH A, CHAI J S, JIN R C, SCHATZ G C, GU X W. Pressure-induced optical transitions in metal nanoclusters[J]. ACS Nano, 2020, 14(9): 11888-11896 doi: 10.1021/acsnano.0c04813
FAN W T, YANG Y, YOU Q, LI J, DENG H T, YAN N, WU Z K. Size- and shape-dependent photoexcitation electron transfer in metal nanoclusters[J]. J. Phys. Chem. C, 2023, 127(1): 816-823 doi: 10.1021/acs.jpcc.2c07678
HAN S, ZHANG Z C, LI S P, QI L M, XU G B. Chemiluminescence and electrochemiluminescence applications of metal nanoclusters[J]. Sci. China Chem., 2016, 59(7): 794-801 doi: 10.1007/s11426-016-0043-3
TANG X Q, LU M H, WANG J J, MAN S L, PENG W P, MA L. Recent advances of DNA-templated metal nanoclusters for food safety detection: From synthesis, applications, challenges, and beyond[J]. J. Agric. Food. Chem., 2024, 72(11): 5542-5554 doi: 10.1021/acs.jafc.3c09621
WANG Y, LIANG S, MEI M L, ZHAO Q W, SHE G W, SHI W S, MU L X. Sensitive and stable thermometer based on the long fluorescence lifetime of Au nanoclusters for mitochondria[J]. Anal. Chem., 2021, 93(45): 15072-15079 doi: 10.1021/acs.analchem.1c03092
MASTRACCO P, GONZÀLEZ-ROSELL A, EVANS J, BOGDANOV P, COPP S M. Chemistry-informed machine learning enables discovery of DNA-stabilized silver nanoclusters with near-infrared fluorescence[J]. ACS Nano, 2022, 16(10): 16322-16331 doi: 10.1021/acsnano.2c05390
XU D D, ZHENG B, SONG C Y, LIN Y, PANG D W, TANG H W. Metal-enhanced fluorescence of gold nanoclusters as a sensing platform for multi-component detection[J]. Sens. Actuator B‒Chem., 2019, 282: 650-658 doi: 10.1016/j.snb.2018.11.122
LIU X, ASTRUC D. Atomically precise copper nanoclusters and their applications[J]. Coord. Chem. Rev., 2018, 359: 112-126 doi: 10.1016/j.ccr.2018.01.001
AN Y, REN Y, BICK M, DUDEK A, WAWORUNTU E H W, TANG J, CHEN J, CHANG B S. Highly fluorescent copper nanoclusters for sensing and bioimaging[J]. Biosens. Bioelectron., 2020, 154: 112078 doi: 10.1016/j.bios.2020.112078
WANG M K, WANG L, LIU Q, SU X G. A fluorescence sensor for protein kinase activity detection based on gold nanoparticles/copper nanoclusters system[J]. Sens. Actuator B‒Chem., 2018, 256: 691-698 doi: 10.1016/j.snb.2017.09.213
XU J M, ZHOU H M, ZHANG Y X, ZHAO Y, YUAN H, HE X X, WU Y, ZHANG S J. Copper nanoclusters-based fluorescent sensor array to identify metal ions and dissolved organic matter[J]. J. Hazard. Mater., 2022, 428: 128158 doi: 10.1016/j.jhazmat.2021.128158
BUSI K B, DAS S, PALANIVEL M, GHOSH K K, GULYÁS B, PADMANABHAN P, CHAKRABORTTY S. Surface ligand influences the Cu nanoclusters as a dual sensing optical probe for localized pH environment and fluoride ion[J]. Nanomaterials, 2023, 13: 529 doi: 10.3390/nano13030529
SALEH S M, EL-SAYED W A, EL-MANAWATY M A, GASSOUMI M, ALI R. An eco-friendly synthetic approach for copper nanoclusters and their potential in lead ions sensing and biological applications[J]. Biosensors, 2022, 12: 197 doi: 10.3390/bios12040197
LIU J, WU Z N, TIAN Y, LI Y C, LIN A, LI T T, ZOU H Y, LIU Y, ZHANG X D, ZHANG H, YANG B. Engineering the self-assembly induced emission of Cu nanoclusters by Au doping[J]. ACS App. Mater. Interfaces, 2017, 9(29): 24899-24907 doi: 10.1021/acsami.7b06371
FAN Y C, YU W H, LIAO Y W, JIANG X H, WANG Z H, CHENG Z J. Ratiometric detection of doxycycline in pharmaceutical based on dual ligands-enhanced copper nanoclusters[J]. Spectroc. Acta Pt. A‒Molec. Biomolec. Spectr., 2022, 267: 120509 doi: 10.1016/j.saa.2021.120509
SHI Y E, MA J Z, FENG A R, WANG Z G, ROGACH A L. Aggregation-induced emission of copper nanoclusters[J]. Aggregate, 2021, 2: e112 doi: 10.1002/agt2.112
AO H, FENG H, PAN S F, BAO Z Y, LI Z H, CHEN J R, QIAN Z S. Synthesis and functionalization of stable and bright copper nanoclusters by in situ generation of silica shells for bioimaging and biosensing[J]. ACS Appl. Nano Mater., 2018, 1(10): 5673-5681 doi: 10.1021/acsanm.8b01286
FU L Y, LIU H M, YAN L, FU Y Y, ZHU Y, JIN L, LIANG R Z. Fabrication of CuNCs/LDHs films with excellent luminescent properties and exploration of thermosensitivity[J]. Ind. Eng. Chem. Res., 2019, 58(19): 8009-8015 doi: 10.1021/acs.iecr.8b06236
CHEN S H, LI Z, LI W J, HUANG Z Z, JIA Q. Confining copper nanoclusters on exfoliation-free 2D boehmite nanosheets: Fabrication of ultra-sensitive sensing platform for α-glucosidase activity monitoring and natural anti-diabetes drug screening[J]. Biosens. Bioelectron., 2021, 182: 113198 doi: 10.1016/j.bios.2021.113198
MU J, XU W H, HUANG Z Z, JIA Q. Encapsulating copper nanoclusters in 3D metal-organic frameworks to boost fluorescence for bio-enzyme sensing, inhibitor screening, and light-emitting diode fabrication[J]. Microchem. J., 2023, 189: 108533 doi: 10.1016/j.microc.2023.108533
YOO J, HAN S, PARK W, LEE T, PARK Y, CHANG H, HAHN S K, KWON W. Defect-induced fluorescence of silica nanoparticles for bioimaging applications[J]. ACS Appl. Mater. Interfaces, 2018, 10: 44247-44256 doi: 10.1021/acsami.8b16163
FEDORENKO S, GILMSNOVA D, MUKHAETSHINA A, NIZAMEEV I, KHOLIN K, AKHMADEEV B, VOLOSHINA A, SAPUNOVA A, KUZNETSOVA S, DAMINOVA A, KATSYUBA S, ZAIROV R, MUSTAFINA A. Silica nanoparticles with dual visible-NIR luminescence affected by silica confinement of Tb(Ⅲ) and Yb(Ⅲ) complexes for cellular imaging application[J]. J. Mater. Sci., 2019, 54: 9140-9154 doi: 10.1007/s10853-019-03532-6
YANG Q S, LI L, ZHAO F, HAN H Y, WSNG W H, TIAN Y C, WSNG Y W, YE Z S, GUO X H. Hollow silica-polyelectrolyte composite nanoparticles for controlled drug delivery[J]. J. Mater. Sci., 2019, 54: 2552-2565 doi: 10.1007/s10853-018-2996-7
ZYGOURI E, STATHIS A, COURIS S, TANGOULIS V. Nanocomposites based on spin-crossover nanoparticles and silica-coated gold nanorods: A nonlinear optical study[J]. Molecules, 2023, 28: 4200 doi: 10.3390/molecules28104200
LIU C, BAO L, TANG B, ZHAO J Y, ZHANG Z L, XIONG L H, HU J, WU L L, PANG D W. Fluorescence-converging carbon nanodots-hybridized silica nanosphere[J]. Small, 2016, 12(34): 4702-4706 doi: 10.1002/smll.201503958
SON T, KIM M, CHOI M, NAM S H, YOO A, LEE H, HAN E H, HONG K S, PARK H S. Advancing fluorescence imaging: Enhanced control of cyanine dye-doped silica nanoparticles[J]. J. Nanobiotechnol., 2024, 22: 347 doi: 10.1186/s12951-024-02638-7
STOIAN M C, MIHALACHE I, MATACHE M, RDAOI A. Terbium-functionalized silica nanoparticles for metal ion sensing by fluorescence quenching[J]. Dyes Pigment., 2021, 187: 109144 doi: 10.1016/j.dyepig.2021.109144
YE J Z, CHEN Z K, CHEN W W, ZHAO Y, DING C P, HUANG Y J. Gold nanoparticles coated with silica shells as high-performance fluorescence nanoprobe[J]. ACS Appl. Nano Mater., 2024, 7(5): 5543-5553 doi: 10.1021/acsanm.4c00243
AL-HAKKANI M F, GOUDA G A, HASSAN S H A, MOHAMED M M A, NAGIUB A M. Cefixime wastewater management via bioengineered Hematite nanoparticles and the in-vitro synergetic potential multifunction activities of cefixime@hematite nanosystem[J]. Surf. Interfaces, 2022, 30: 101877 doi: 10.1016/j.surfin.2022.101877
QIN G X, WANG J, LI L, YUAN F F, ZHA Q Q, BAI W B, NI Y H. Highly water-stable Cd-MOF/Tb3+ ultrathin fluorescence nanosheets for ultrasensitive and selective detection of cefixime[J]. Talanta, 2021, 221: 121421 doi: 10.1016/j.talanta.2020.121421
RAHMAN Z U, SHAH U, ALAM A, SHAH Z, SHAHEEN K, KHAN S B, KHAN S A. Photocatalytic degradation of cefixime using CuO-NiO nanocomposite photocatalyst[J]. Inorg. Chem. Commun., 2023, 148: 110312 doi: 10.1016/j.inoche.2022.110312
ESKANDARI H, AMIRZEHNI M, SAFAVI E, HASSANZADEH J. Synthesis of Zn metal-organic framework doped magnetic graphene oxide for preconcentration and extraction of cefixime followed by its measurement using HPLC[J]. Microchem. J., 2021, 169: 106537 doi: 10.1016/j.microc.2021.106537
SAGAR P, SRIVASTAVA M, PRAKASH R, SRIVASTAVA S K. The fabrication of an MoS2 QD-AuNP modified screen-printed electrode for the improved electrochemical detection of cefixime[J]. Anal. Methods, 2020, 12: 3014-3024 doi: 10.1039/D0AY00899K
MAHROUSE M A, ELWY H M, SALEM E M. Simultaneous determination of cefixime and erdosteine in combined dosage form using validated spectrophotometric methods[J]. Spectroc. Acta Pt. A‒Molec. Biomolec. Spectr., 2020, 241: 118647 doi: 10.1016/j.saa.2020.118647
BAJWA J, NAWAZ H, MAJEED M I, HUSSAIN A I, FAROOQ S, RASHID N, BAKKAR M A, AHMAD S, HYAT H, BASHIR S, ALI S, KASHIF M. Quantitative analysis of solid dosage forms of cefixime using Raman spectroscopy[J]. Spectroc. Acta Pt. A‒Molec. Biomolec. Spectr., 2020, 238: 118446 doi: 10.1016/j.saa.2020.118446
MASOUDYFAR Z, ELHAMI S. Surface plasmon resonance of gold nanoparticles as a colorimetric sensor for indirect detection of cefixime[J]. Spectroc. Acta Pt. A‒Molec. Biomolec. Spectr., 2019, 211: 234-238 doi: 10.1016/j.saa.2018.12.007
IRANI-NEAHAD M H, JALILI R, KOHAN E, KHATAEE A, YOON Y. Tungsten disulfide (WS2)/fluorescein ratiometric fluorescent probe for detection of cefixime residues in milk[J]. Environ. Res., 2022, 205: 112512 doi: 10.1016/j.envres.2021.112512
HUANG X M, LAN M J, WANG J, GUO L H, LIN Z Y, ZHANG F, ZHANG T, WU C M, QIU B. A dual-mode strategy for sensing and bio-imaging of endogenous alkaline phosphatase based on the combination of photoinduced electron transfer and hyperchromic effect[J]. Anal. Chim. Acta, 2021, 1142: 65-72 doi: 10.1016/j.aca.2020.09.059
TIAN R, QU Y J, ZHENG X W. Amplified fluorescence quenching of lucigenin self-assembled inside silica/chitosan nanoparticles by Cl-[J]. Anal. Chem., 2014, 86: 9114-9121 doi: 10.1021/ac5018502
LIU M Y, DU X J, XU K, YAN B W, FAN Z B, GAO Z D, REN X Q. A cationic quantum dot-based ratiometric fluorescent probe to visually detect berberine hydrochloride in human blood serums[J]. J. Anal. Sci. Technol., 2021, 12: 11 doi: 10.1186/s40543-021-00261-x
SON T, KIM M, CHOI M, NAM S H, YOO A, LEE H, HAN E H, HONG K S, PARK H S. Advancing fuorescence imaging: Enhanced control of cyanine dye-doped silica nanoparticles[J]. J. Nanobiotechnol., 2024, 22: 347 doi: 10.1186/s12951-024-02638-7
KANG B, SCHRADE A, XU Y, CHAN Y, ZIENER U. Synthesis and characterization of dually labeled Pickering-type stabilized polymer nanoparticles in a downscaled miniemulsion system[J]. Langmuir, 2012, 28(25): 9347-9354 doi: 10.1021/la301326p
CAI Z F, LI H Y, WANG X S, MIN C, WEN J Q, FU R X, DAI Z Y, CHEN J, GUO M Z, YANG H J, BAI P P, LU X M, WU T, WU Y. Highly luminescent copper nanoclusters as temperature sensors and "turn off" detection of oxytetracycline[J]. Colloid Surf. A‒ Physicochem. Eng. Asp., 2022, 647: 129202 doi: 10.1016/j.colsurfa.2022.129202
HAN W J, PIAO S H, CHOI H J, SEO Y. Core-shell structured mesoporous magnetic nanoparticles and their magnetorheological response[J]. Colloid Surf. A‒Physicochem. Eng. Asp., 2017, 524: 79-86 doi: 10.1016/j.colsurfa.2017.04.016
GHIORGHITA C A, DINU M V, DRAGAN E S. Burst-free and sustained release of diclofenac sodium from mesoporous silica/PEI microspheres coated with carboxymethyl cellulose/chitosan layer-by-layer films[J]. Cellulose, 2022, 29: 395-412 doi: 10.1007/s10570-021-04282-y
YAO Z X, LIU H M, LIU Y S, DIAO Y X, HU G X, ZHANG Q F, LI Z. FRET-based fluorometry assay for curcumin detecting using PVP-templated Cu NCs[J]. Talanta, 2021, 223: 121741 doi: 10.1016/j.talanta.2020.121741
NIU W Z, MOEH T, ADAMS P, ZHANG X, LEFÈVEREF R, CRUZ A M, ZENG P, KUNZE K, YANG W, TILLEY S D. Crystal orientation-dependent etching and trapping in thermally-oxidised Cu2O photocathodes for water splitting[J]. Energy Environ. Sci., 2022, 15: 2002-2010 doi: 10.1039/D1EE03696C
ZHU X, LIU L L, CAO W W, YUAN R, WANG H J. Ultra-sensitive microRNA biosensor based on strong aggregation-induced electrochemiluminescence from bidentate ligand-stabilized copper nanoclusters in polymer hydrogel[J]. Anal. Chem., 2023, 95: 5553-5560 doi: 10.1021/acs.analchem.2c04565
杨斌, 杨防祖, 黄令, 许书楷, 姚光华, 周绍民. 2, 2'-联吡啶在化学镀铜中的作用研究[J]. 电化学, 2007, 13(4): 425-430 doi: 10.3969/j.issn.1006-3471.2007.04.015YANG B, YANG F Z, HUANG L, XU S K, YAO G H, ZHOU S M. Study on the role of 2, 2'-bipyridine in chemical copper plating[J]. Electrochemistry, 2007, 13(4): 425-430 doi: 10.3969/j.issn.1006-3471.2007.04.015
LIU Z C, JING X, ZHANG S J, TIAN Y. A copper nanocluster-based fluorescent probe for real-time imaging and ratiometric biosensing of calcium ions in neurons[J]. Anal. Chem., 2019, 91: 2488-2497 doi: 10.1021/acs.analchem.8b05360
ZHAO S A, DENG Y, YAN T Y, YANG X L, XU W D, LIU D H, WANG W J. Explore the interaction between ellagic acid and zein using multi-spectroscopy analysis and molecular docking[J]. Foods, 2022, 11: 2764 doi: 10.3390/foods11182764
REN H X, MAO M X, LI M, ZHANG C Z, PENG C F, XU J G, WEI X L. A fluorescent detection for paraquat based on β-CDs-enhanced fluorescent gold nanoclusters[J]. Foods, 2021, 10: 1178 doi: 10.3390/foods10061178
DU J Y, YANG Y, SHAO T L, QI S Q, ZHANG P, ZHOU S J, ZHU C Q. Yellow emission carbon dots for highly selective and sensitive OFF-ON sensing of ferric and pyrophosphate ions in living cells[J]. J. Colloid Interf. Sci., 2021, 587: 376-384 doi: 10.1016/j.jcis.2020.11.108
MA D M, ZHANG L B, YIN Y W, GAO Y X, WANG Q. Spectroscopic studies of the interaction between phosphorus heterocycles and cytochrome P450[J]. J. Pharm. Anal., 2021, 11: 757-763 doi: 10.1016/j.jpha.2020.12.004
KAVEH S, NOROUZI B, NAMI N, MIRABI A. Phytochemical synthesis of CdO nanoparticles: Fabrication of electrochemical sensor for quantification of cefixime[J]. J. Mater. Sci. ‒Mater. Electron., 2021, 32: 8932-8943 doi: 10.1007/s10854-021-05564-8
DARABI R, NOOSHABADI M S. Development of an amplified nanostructured electrochemical sensor for the detection of cefixime in pharmaceuticals and biological samples[J]. J. Pharm. Biomed. Anal., 2022, 212: 114657 doi: 10.1016/j.jpba.2022.114657
AKHGARI F, SAMADI N, FARHADI K. Fluorescent carbon dot as nanosensor for sensitive and selective detection of cefixime based on inner filter effect[J]. J. Fluoresc., 2017, 27: 921-927 doi: 10.1007/s10895-017-2027-0
WANG K M, DONG Y Q, BAI X L, ZHAO X, ZHAO R T, ZHOU J, YU H M, LI L F, TANG H J, MA Y L. A water-stable Zn(Ⅱ) coordination polymer as a fluorescence sensor for multifunctional detection of cefixime in milk, honey, beef and chicken[J]. J. Mol. Struct., 2023, 1285: 135495 doi: 10.1016/j.molstruc.2023.135495

Figure 1 TEM images (a, c, d) and particle size distribution diagrams (b, e) of Cu NCs (a, b) and Cu NCs/CSNPs (c, d, e); HAADF-STEM (f) and EDS elemental mappings (g-j) of Cu NCs/CSNPs

Figure 2 (a) Fluorescence excitation (Ex) and emission (Em) spectra, (b) fluorescence attenuation curves, and (c) fluorescence stabilities of Cu NCs and Cu NCs/CSNPs; (d) FTIR spectra of PEI, chitosan, Cu NCs, and Cu NCs/CSNPs
In a: Cu NCs (dashed line) and Cu NCs/CSNPs (solid line); Inset: optical photographs under visible light (left) and ultraviolet light (right).

Figure 3 XPS survey spectra of CuNCs (a) and Cu NCs/CSNPs (c); Cu2p XPS spectra of CuNCs (b) and CuNCs/CSNPs (d)
FL: fluorescence.

Figure 4 (a) UV-Vis absorption and fluorescence emission spectra of Cfx (1.0 mmol·L-1), Cu NCs/CSNPs, and Cu NCs/CSNPs+Cfx (20.0 μmol·L-1); (b) UV-Vis absorption spectrum of Cfx (1.0 mmol·L-1) and fluorescence excitation spectrum of Cu NCs/CSNPs

Figure 5 (a) Fluorescence attenuation curves of Cu NCs/CSNPs without and with Cfx; (b) Stern-Volmer plots of Cu NCs/CSNPs after interaction with Cfx at 35, 45, and 55 ℃

Figure 6 Influence of (a) pH, (b) buffer solution, and (c) volume ratio of Cu NCs/CSNPs to buffer solution, (d) incubation time, and (e) temperature on ΔF
Other conditions were kept consistent as follows, except for the variables. Buffer solution: KH2PO4-Na2HPO4, pH=6.09, volume of buffer: 1.25 mL, volume of Cu NCs/CSNPs: 1.25 mL, temperature: 35 ℃, reaction time: 5 min, and Cfx: 20.0 μmol·L-1; BR=Britton-Robinson buffer solution.

Figure 7 (a) Fluorescence spectra of the Cu NCs/CSNPs-based fluorescence sensor against various cCfx; (b) Calibration curve of ΔF/F0 versus cCfx
From a to j, the concentrations were 0, 4.0, 11.9, 15.7, 19.6, 23.4, 27.2, 31.0, 34.7, 38.5 μmol·L-1, respectively.
Table 1. Parameters of the fluorescence attenuation curves of Cu NCs and Cu NCs/CSNPs*
| Sample | τ1 / ns | A1 / % | τ2 / ns | A2 / % | τ3 / ns | A3 / % | τ / ns |
| Cu NCs | 4.43 | 83.48 | 9.01 | 15.82 | 45.98 | 0.70 | 5.45 |
| Cu NCs/CSNPs | 2.64 | 50.20 | 9.76 | 41.32 | 48.63 | 8.49 | 9.49 |
| *τ: the time constant of fluorescence decay, τ1: the short lifetime, τ2: the intermediate lifetime, τ3: the long lifetime; A: the relative contribution ratio of each life component in the total attenuation, A1: the short lifetime component amplitude, A2: the intermediate lifetime component amplitude, A3: the long lifetime component amplitude. | |||||||
 下载: 导出CSV
Table 2. Parameters of the fluorescence attenuation curves of Cu NCs/CSNPs without and with Cfx
| Sample | τ1 / ns | A1 / % | τ2 / ns | A2 / % | τ3 / ns | A3 / % | τ / ns |
| Cu NCs/CSNPs | 2.64 | 50.20 | 9.76 | 41.32 | 48.63 | 8.49 | 9.49 |
| Cu NCs/CSNPs+Cfx | 1.92 | 65.70 | 10.32 | 29.34 | 103.36 | 4.97 | 9.43 |
下载: 导出CSV
Table 3. Comparison of analytical parameters for Cfx
| Method | Sensing material | Linear range / (μmol·L-1) | LOD / (μmol·L-1) | Ref. |
| Electrochemical | CdO NPs | 0.1-12 | 0.06 | [55] |
| Electrochemical | IL/CoFe2O4/rGO | 0.06-700 | 0.035 | [56] |
| Fluorometry | Carbon dots | 0.2-8 | 0.05 | [57] |
| Fluorometry | [Zn(dia)(bpeh)]·3H2O | 0-28.0 | 0.17 | [58] |
| Fluorometry | Cu NCs/CSNPs | 3.98-38.5 | 0.045 5 | This work |
下载: 导出CSV
Table 4. Detection results of Cfx in real samples by Cu NCs/CSNPs (n=3)
| Sample | Measured concentration / (μmol·L-1) |
Spiked concentration / (μmol·L-1) |
Found concentration / (μmol·L-1) |
Recovery / % | RSD / % |
| Calf serum | — | 11.9 | 11.1 | 93.28 | 2.75 |
| 19.6 | 18.7 | 95.41 | 1.86 | ||
| 27.2 | 25.3 | 93.01 | 3.99 | ||
| Human serum | — | 11.9 | 11.1 | 93.28 | 3.22 |
| 19.6 | 20.7 | 105.6 | 1.27 | ||
| 27.2 | 26.4 | 97.06 | 1.62 | ||
| Rabbit serum | — | 11.9 | 12.7 | 106.7 | 1.59 |
| 19.6 | 19.8 | 101.0 | 3.79 | ||
| 27.2 | 25.8 | 94.85 | 1.01 |
下载: 导出CSV

 扫一扫看文章

扫一扫关注我们