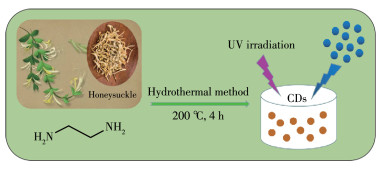
图 1.
N-CDs的合成示意图
Figure 1.
Schematic diagram for the synthesis of N-CDs


尽管需求量非常低,钴(Co)仍是一种生理必需的矿物质,在人体内Co主要通过形成维生素B12发挥生物学作用及生理功能。此外,Co对铁的代谢、血红蛋白合成、细胞发育及酶功能等均有重要生理作用[1]。随着人类对Co的开发利用,Co污染越来越严重。常注射Co制剂或暴露于过量的原始钴环境中,可引起中毒[2-3]。美国规定灌溉用水Co的最大容许浓度为0.2 mg·L-1[1]。及时掌握Co浓度对于有效修复受Co污染的土壤及水体至关重要,因此快速准确地检测Co浓度的方法便受到了科学家们的广泛关注。目前,Co的测定方法有原子吸收法、等离子发射光谱法和分光光度法等,但这些方法存在检测过程复杂、设备费用高、耗时长或者灵敏度低的缺点[4-6]。近年来,荧光纳米材料(如有机纳米材料、半导体量子点)已被大量用于传感领域[7-8]。遗憾的是,这些材料的高细胞毒性和低生物相容性使其在生物医学方面的应用大打折扣。因此,寻找一种新型的功能材料用于准确灵敏地检测Co2+是极具挑战性的。
碳点(CDs)作为一种新型的碳材料和发光纳米材料,自2004年首次出现以来,凭借其独特的理化特性而备受关注[9]。CDs是直径小于10 nm的碳纳米颗粒,具有合成简单、优异的光学灵敏度和稳定性、低毒性、高的生理清除率[10]等特点。与传统的半导体量子点和有机染料相比,CDs克服了水溶性低、功能化困难、毒性大等缺陷[11]。通过表面修饰可以有效调节CDs的水溶性及靶向识别能力[12]。目前,CDs已广泛应用于离子传感、催化、光电器件、防伪、生物成像和药物递送等领域[13-14]。
CDs作为荧光探针具有快速、简单、选择性好和灵敏度高等优势。CDs在金属离子检测方面是非常有前景的,其原理主要是CDs表面的官能基团易与金属离子发生螯合而产生电子转移,这可以增大或者减小CDs的荧光强度[15]。故CDs用作金属离子传感器时,其灵敏度和选择性取决于CDs表面的活性官能团和靶向金属离子之间的亲和力[16-17],通过掺杂杂原子来改进或构建CDs表面上的活性官能团[18-19]对于特异性识别目标离子十分关键。
考虑到绿色化学以及进一步扩大其在食品和医疗领域的实际应用,来自自然资源的CDs受到了越来越多的关注。例如,Raveendran等通过薄荷叶制备的CDs用于生物传感器、绿色还原剂和生物标志物[20]。Wang等以菠菜为原料合成CDs并用于Cr(Ⅵ)的检测[21]。Mishra等以橙汁制备的CDs用于抗癌活性研究[22]。生物质基CDs因其成本低、丰度高、制备条件温和、环境友好等优点而备受欢迎[23]。金银花作为一种常见的中药材,广泛易得且价格低廉,含有大量绿原酸类化合物[24],非常适合作为绿色碳源大规模地制备CDs。在本工作中,我们以生物质材料金银花作为碳源,乙二胺作为氮源,通过水热法制备出性能优良的荧光氮掺杂CDs(N-CDs)。所制备的荧光N-CDs粒径小、水溶性好、光稳定性高。基于其优异的光学性能,N-CDs显示出对Co2+超高的选择性和灵敏度,检测限低至1.38 nmol·L-1,为Co2+的高灵敏检测提供了一个新思路。此外,鉴于所制备的N-CDs具有好的生物相容性和低细胞毒性,其还可用于细胞成像及细胞内Co2+传感,这为其后续在生物医学方面的应用奠定了基础。
金银花购买于当地药店。乙二胺(C2H8N2,AR)购于天津市登丰化学品有限公司。磷酸氢二钠、磷酸二氢钾购于天津市风船化学试剂科技有限公司。硫酸奎宁购自上海阿拉丁生化科技有限公司。高糖培养基(DMEM)购自上海北诺生物科技有限公司。胎牛血清(FBS)购于杭州四季青生物工程有限公司。噻唑蓝(MTT)、青链霉素混合液、胰酶-EDTA消化液、多聚甲醛(PFA)购于北京索莱宝科技有限公司。HeLa细胞由山西大学基因工程中心提供。0.1 mol·L-1的各种金属阳离子(Cr3+、Pb2+、Ca2+、Fe3+、Bi3+、K+、Na+、Cu2+、Ba2+、Mn2+、Hg2+、Mg2+、Cd2+、Zn2+、Al3+、Ag+、Co2+)是用它们的氯化物制备的(氯化物购自天津市化学试剂三厂)。蒸馏水、二次蒸馏水为实验室自制。
取0.5 g金银花于50 mL烧杯中,用蒸馏水洗净并置于80 ℃的烘箱中干燥,在不断搅拌下加入5 mL乙二胺,然后再加10 mL去离子水,转移至50 mL水热釜中,最后将其放到210 ℃的电热鼓风干燥箱中反应4 h。反应结束后,冷却至室温,将反应液取出,离心10 min,取上清液,用500~1 000 Da截留分子量的透析袋透析48 h,得到纯净的N-CDs水溶液,置于冰箱冷藏备用。N-CDs粉末通过冷冻干燥可得。
透射电子显微镜(TEM)图由加速电压为200 kV(JEOL,日本)的JEM-2100仪器获取。荧光光谱是在F-280型荧光光谱仪(天津港东科技)上测得的。紫外可见吸收光谱是使用Cary 50 Bio UV-vis光谱仪(美国Varian公司)获得。红外光谱在FTIR-8400S(日本岛津)光谱仪上获得。在Bruker Senterra色散拉曼显微镜上采集拉曼光谱。X射线光电子能谱(XPS)使用AXIS ULTRA DLD电子光谱仪(日本岛津)进行。荧光寿命在FLS920光谱仪(英国爱丁堡)上测量。细胞成像使用激光扫描共聚焦显微镜(LSCM,徕卡TCSSP5,德国)和荧光显微镜(蔡司,Vert,A1,德国)。
N-CDs的荧光量子产率(Φ)通过公式ΦS=ΦR(kS/kR)(ηS2/ηR2)测定。其中k为荧光强度对吸光度梯度(即斜率),η为溶剂的折射率。下标S和R分别代表N-CDs和参比溶液(0.1 mol·L-1 H2SO4中的硫酸奎宁)。为了防止重吸收效应,我们制备了一系列不同浓度的N-CDs和参比溶液,通过调整浓度使其在360 nm处的光学吸光度值在0~0.1之间。
首先进行离子选择性测试。将300 μL的N-CDs水溶液(1.2 mg·mL-1)加入700 μL的Tris-HCl(pH 5.0)溶液中,测量其原始荧光强度。在该溶液的不同等分试样中,加入5 μL浓度为0.1 mol·L-1的各种金属阳离子(Cr3+、Pb2+、Ca2+、Fe3+、Bi3+、K+、Na+、Cu2+、Ba2+、Mn2+、Hg2+、Mg2+、Cd2+、Zn2+、Al3+、Ag+、Co2+),待反应30 s后测量其荧光强度。之后进行不同浓度Co2+的灵敏性测试,在上述同等条件下,先测量原始N-CDs溶液的荧光强度,然后加入已知浓度的Co2+溶液并逐渐增加其浓度,测量各浓度下的荧光强度。重复上述操作3次。设置激发波长为390 nm,激发和发射狭缝宽度均为5 nm。
首先为了证明该传感器可以用于实际样品的检测,将自来水(太原市)以6 000 r·min-1的速度离心10 min以去除宏观颗粒物,再通过孔径0.45 μm的滤膜过滤。用700 μL pH 5.0的Tris-HCl溶液稀释300 μL N-CDs(1.2 mg·mL-1)水溶液,测量其起始荧光强度(F0)。然后将含有Co2+标准溶液的上述自来水样品加入到N-CDs溶液中(Co2+的最终浓度:1.0、1.5和2.0 nmol·L-1),再次测量荧光强度(F)。根据线性方程即可计算得到Co2+浓度。
用MTT法评估N-CDs的细胞毒性。将HeLa细胞接种到96孔培养板中18 h待其完全贴附。然后移除培养基,用磷酸盐缓冲液(PBS,pH 7.4)洗涤细胞3次,然后用含有不同浓度N-CDs的新鲜培养基再孵育细胞24 h,再次弃去培养板中的旧培养基,用PBS洗涤细胞3次。接下来,加入200 μL含有20 μL MTT(5 mg·mL-1)试剂的新鲜培养基,并在37.5 ℃下继续孵育4~6 h。最后吸走上清液,向细胞中加入150 mL DMSO并静置10 min,使用酶标仪记录490 nm处的吸光度。
将HeLa细胞(密度1.0×10⁵ mL-1)接种在含DMEM的35 mm培养皿中,置于37.5 ℃恒温细胞培养箱中过夜。取出细胞生长良好的培养皿,弃去旧的培养液,加入新的含400 μg·mL-1 N-CDs的DMEM培养基继续孵育HeLa细胞2 h。结束后除去该培养液,用1 mL pH 7.4的PBS轻轻洗涤3次,除去游离的N-CDs颗粒。然后加入新鲜的1 mL PBS,并立即置于LSCM下进行细胞成像。最后,将3 μL 0.1 mol·L-1的Co2+溶液添加到上述培养皿,通过LSCM记录并拍摄不同时间下细胞的荧光成像。
我们首次以金银花为碳源、乙二胺为氮源,通过水热法成功合成N-CDs(图 1)。所得到的N-CDs极易溶于水,显示出很好的分散性,在紫外光照射下发出明亮的蓝色荧光。TEM图像(图 2a)显示N-CDs呈球形且分散良好。高分辨率TEM(HRTEM)图(图 2a插图)显示N-CDs具有晶格间距为0.219 nm的晶体结构,这对应于石墨的平面内晶格间距(100 facet)[25]。从图 2b可以看出,N-CDs尺寸分布在2.4~5.3 nm范围内,主要粒径为3.4 nm。
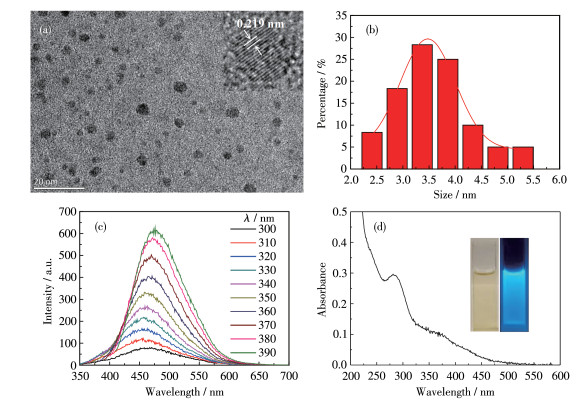
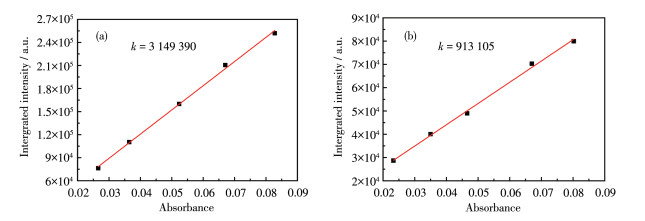
N-CDs的光学性质通过荧光光谱和紫外可见吸收光谱来测量。从N-CDs的荧光光谱(图 2c)可以看出,随着激发波长的逐渐增加,N-CDs的荧光强度逐渐增强且发射波长红移,当激发波长为390 nm时,N-CDs荧光最强,发射峰位于476 nm。这种荧光高度依赖于激发波长的特性[26]对于其在生物医学方面的应用非常重要。图 2d为N-CDs的UV-Vis谱图,图中显示2个最明显的吸收峰分别位于282和323 nm,其中282 nm处的峰是sp2结构域中C=C键的π-π*跃迁引起的,而323 nm处的峰则是由C=O键的n-π*跃迁引起[27]。图 2d中的插图显示,N-CDs水溶液在日光灯下为浅棕色,而在365 nm的紫外光照射下发出强烈的蓝色荧光。此外,以硫酸奎宁为参照,测得N-CDs的荧光量子产率为15.6%(图 3和表 1)。

 下载:
导出CSV
下载:
导出CSV
| Parameter | Quinine sulfate | N-CDs | ||||||||
| Absorbance | 0.026 6 | 0.036 5 | 0.052 4 | 0.067 1 | 0.082 8 | 0.023 3 | 0.035 0 | 0.046 6 | 0.067 0 | 0.080 2 |
| Integrated intensity | 76 364 | 110 229 | 159 867 | 210 527 | 251 938 | 28 694 | 40 026 | 48 943 | 70 303 | 79 921 |
| k | 3 149 390 | 913 105 | ||||||||
| Φ/% | 54 | 15.6 | ||||||||
N-CDs的拉曼光谱(图 4a)显示2个峰,分别在1 376 cm-1(D波段)和1 545 cm-1处(G波段),这分别归因于N-CDs结构中的无序表面和sp2碳网络[28]。计算得到D和G带的强度比(ID/IG)为0.78,说明N-CDs有类似于石墨的无定形碳相[29]。
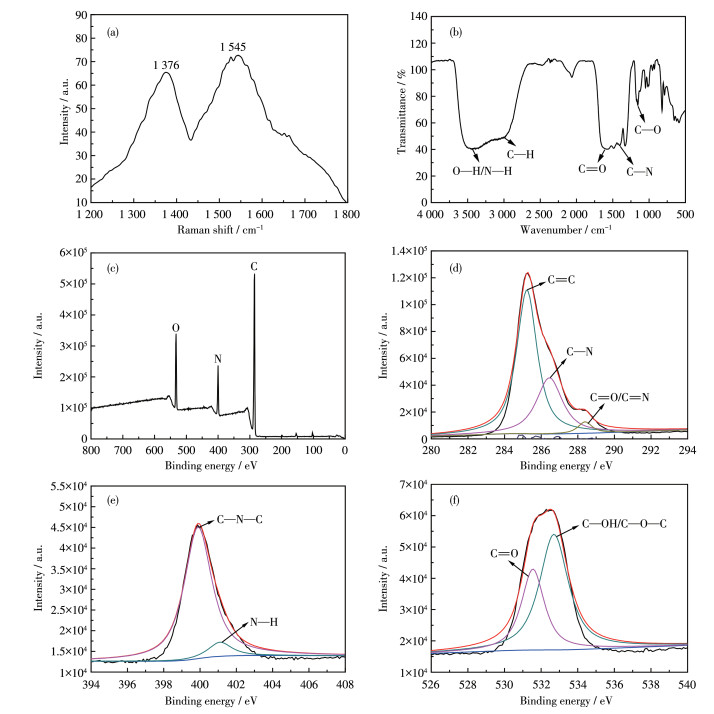
N-CDs的表面结构通过FTIR光谱和XPS来表征。图 4b为FTIR谱图,从中可以看出N-CDs的表面主要有O—H/N—H(3 447 cm-1)、C—H(3 056 cm-1),C=O(1 586 cm-1)、C—N(1 404 cm-1)、C—O (1 154 cm-1)等官能团。XPS谱图(图 4c)表明,N-CDs主要由C、H、O和N组成,285.1、400.1和532.1 eV处的3个峰分别属于C1s、N1s、O1s。C1s谱图(图 4d)揭示了3种不同类型碳的存在,285.2、286.5和288.4 eV处的峰分别对应石墨或脂肪族碳C=C、C—N和C=O/C=N。在N1s谱图中(图 4e),399.9和401.1 eV处的2个峰分别对应C—N—C和N—H基团。O1s谱图(图 4f)包含2个不同的峰:531.5 eV处对应C=O,532.7 eV处对应C—OH/C—O—C。XPS与FTIR结果一致,表明N元素成功掺杂到CDs中。另外,测得N-CDs的ζ电位为-17 mV,这可能是N-CDs表面上的—COOH基团引起的。
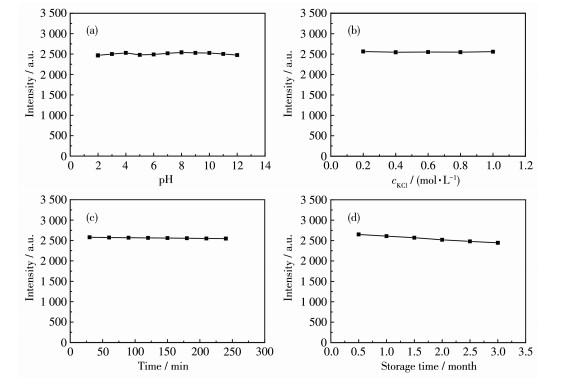
接下来,我们研究了N-CDs的荧光在各种环境下的稳定性。如图 5a所示,在pH=2~12的范围内,N-CDs的荧光强度基本保持不变,表明强酸强碱的环境基本不影响N-CDs的荧光。同样,N-CDs的荧光强度也与离子强度无关(图 5b)。图 5c和5d显示,即使在持续的紫外线照射(365 nm,16 W)4 h和室温存储3个月后,N-CDs荧光强度基本不受影响。实验结果表明,N-CDs具有优秀的稳定性及抗光漂白能力,这对于其用于生物领域至关重要。
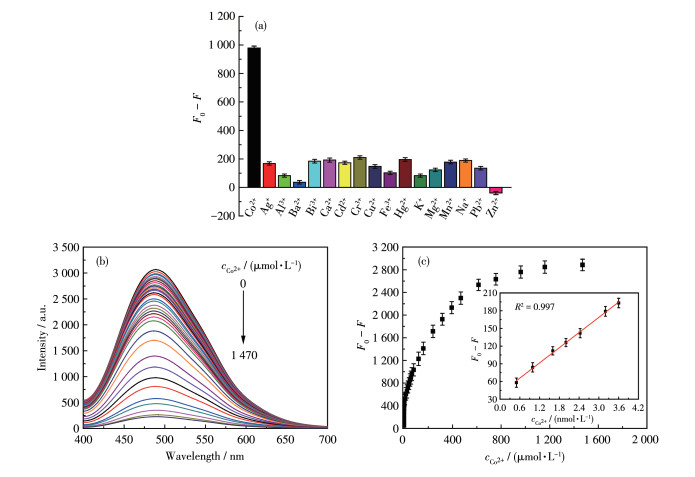
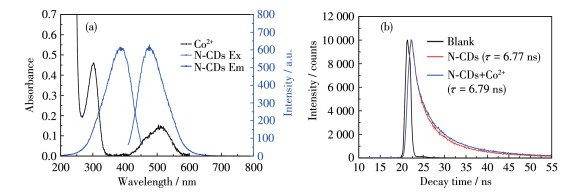
为了探索N-CDs在传感方面的应用,我们评估了不同金属离子对N-CDs荧光光谱的影响。如图 6a所示,除了Co2+外,其他离子的加入对N-CDs的荧光强度几乎没有影响,说明N-CDs对Co2+具有优异的选择性。进一步的灵敏度实验证明了N-CDs的荧光强度对Co2+剂量的依赖性(图 6b),随着Co2+浓度的增加,N-CDs的荧光强度逐渐减弱,进一步证实了N-CDs作为Co2+荧光探针的适用性。图 6c揭示了Co2+浓度与N-CDs荧光强度之间的关系,其中在0.5~3.6 nmol·L-1范围之间线性良好。根据检出限公式LOD=3σ/k(σ为空白样品信噪比,k为线性斜率),计算得到N-CDs对Co2+的检测限为1.38 nmol·L-1。然后,我们探讨了Co2+对N-CDs的荧光猝灭机制。图 7a显示Co2+的吸收光谱与N-CDs的发射光谱有较大重叠,从而导致其内滤效应(IFE)的产生[30]。另外,Co2+吸收光谱与N-CDs的激发光谱的部分重叠也进一步提升了IFE的效率。IFE荧光现象通常发生在吸收剂和荧光团之间,这是检测系统中的吸收剂吸收了激发和/或发射光而引起的。有效的IFE要求吸收剂的吸收带与荧光团的激发和/或发射带互补重叠[31]。图 7b显示的Co2+加入并不影响N-CDs的荧光寿命,表明其猝灭可能是N-CDs和Co2+之间特定的相互作用引起的静态猝灭[32]。综上所述,Co2+猝灭N-CDs荧光的机制既有IFE也有静态猝灭。
F0 and F represent the fluorescence intensities of N-CDs before and after the addition of Co2+, respectively.
为了证实该传感器可适用于实际样品中Co2+的检测,我们利用加标法检测自来水中Co2+的含量。在自来水中加入已知量的Co2+(最终浓度:1.0、1.5和2.0 nmol·L-1),测得Co2+的回收率分别为96.2%、103.1%和98.1%(表 2),表明N-CDs适用于环境中Co2+的定量检测。此外,与先前报道相比[33],我们所制备的Co2+探针更加灵敏、检测限更低(表 3)。
下载:
导出CSV
| Sample | Co2+ concentration/(nmol·L-1) | RSD*/% | Recovery/% | |
| Added | Detected | |||
| 1 | 1.0 | 0.980 | 3.04 | 96.2 |
| 2 | 1.5 | 1.518 | 2.55 | 103.1 |
| 3 | 2.0 | 1.982 | 1.79 | 98.1 |
| * Relative standard deviation. | ||||
下载:
导出CSV
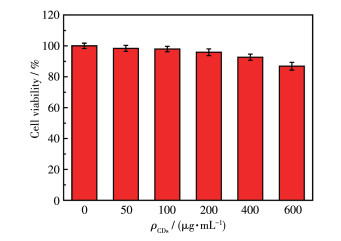
MTT试验用于评估N-CDs对HeLa细胞的体外细胞毒性。如图 8所示,用不同浓度的N-CDs孵育HeLa细胞24 h后,即使在非常高的浓度下(600 μg·mL-1),细胞存活率依然在86%以上,表明N-CDs兼具低毒性和优异的生物相容性,这也是其用于生物领域的前提和基础。
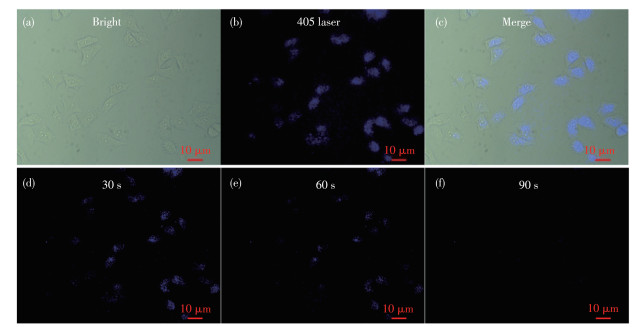
为了验证N-CDs在生物领域的应用潜能,我们进行了细胞成像以及体外检测能力的探究。图 9a~9c显示了与N-CDs孵育的HeLa细胞的荧光图像,可以看出N-CDs进入到HeLa细胞的细胞质和细胞核,且分布均匀,HeLa细胞呈现出明亮的蓝色荧光。然而当向系统内加入Co2+后,细胞内荧光强度随着时间的延长而逐渐减弱直至消失(图 9d~9f)。结果表明,N-CDs在细胞成像和细胞内传感中具有很好的应用前景。
在本工作中,我们以金银花为碳源,乙二胺为氮源,利用水热法合成了N-CDs。制备的N-CDs具有可忽略的细胞毒性、优秀的光致发光性能、极佳的细胞渗透性。同等条件下加入金属离子后,只有Co2+能明显猝灭N-CDs的荧光,表明N-CDs对Co2+有良好的选择性。N-CDs在0.5~3.6 nmol·L-1范围内对Co2+表现出良好的线性响应,对应的检出限低至1.38 nmol·L-1。在此基础上,建立了一种Co2+的超高灵敏检测方法并应用于实际样品分析,取得了满意的结果。此外,N-CDs已成功地用于细胞成像及细胞内传感,表明N-CDs在生物传感和生物医学等方面具有广阔的应用前景。
Awual M R, Ismael M, Yaita T. Efficient detection and extraction of cobalt(Ⅱ) from lithium ion batteries and wastewater by novel composite adsorbent[J]. Sens. Actuator B-Chem., 2014, 191: 9-18. doi: 10.1016/j.snb.2013.09.076
Stoica A I, Peltea M, Baiulescu G E, Ionica M. Determination of cobalt in pharmaceutical products[J]. J. Pharm. Biomed. Anal., 2004, 36(3): 653-656. doi: 10.1016/j.jpba.2004.07.030
Barras F, Fontecave M. Cobalt stress in Escherichia coli and Salmonella enterica: Molecular bases for toxicity and resistance[J]. Metallomics, 2011, 3(11): 1130-1134. doi: 10.1039/c1mt00099c
Bano D, Kumar V, Chandra S. Synthesis of highly fluorescent nitrogen-rich carbon quantum dots and their application for the turn-off detection of cobalt(Ⅱ)[J]. Opt. Mater., 2019, 92: 311-318. doi: 10.1016/j.optmat.2019.04.045
Wu Y Y, Liu Y D, Yin J Y. Nitrogen-doped carbon dots synthesized from acrylic acid and ethylenediamine for simple and selective determination of cobalt ions in aqueous media[J]. J. Lumin., 2019, 206: 169-175. doi: 10.1016/j.jlumin.2018.10.059
Zhao C X, Li X, Cheng C S. Green and microwave-assisted synthesis of carbon dots and application for visual detection of cobalt(Ⅱ) ions and pH sensing[J]. Microchem. J., 2019, 147: 183-190. doi: 10.1016/j.microc.2019.03.029
Chen H, Yuan F, Xu J. Simple and sensitive detection method for cobalt(Ⅱ) in water using CePO4: Tb3+ nanocrystals as fluorescent probes[J]. Spectroc. Acta Pt. A-Molec. Biomolec. Spectr., 2013, 107: 151-155. doi: 10.1016/j.saa.2013.01.020
Zi L, Huang Y, Yan Z. Thioglycolic acid-capped CuInS2/ZnS quantum dots as fluorescent probe for cobalt ion detection[J]. J. Lumin., 2014, 148: 359-363. doi: 10.1016/j.jlumin.2013.12.051
Xu X Y, Ray R, Gu Y L, Ploehn H J, Gearheart L, Raker K, Scrivens W A. Electrophoretic analysis and purification of fluorescent single-walled carbon nanotube fragments[J]. J. Am. Chem. Soc., 2004, 126(40): 12736-12737. doi: 10.1021/ja040082h
Yu J K, Yong X, Tang Z Y, Yang B, Lu S Y. Theoretical understanding of structure-property relationships in luminescence of carbon dots[J]. J. Phys. Chem. Lett., 2021, 12: 7671-7687. doi: 10.1021/acs.jpclett.1c01856
孙博, 赵宁, 徐欣, 姜来, 陆峰, 范曲立, 黄维. Fe掺杂CuS纳米颗粒的合成及其在光热/化学动力学联合治疗中的应用[J]. 无机化学学报, 2023,39,(4): 671-679. SUN B, ZHAO N, XU X, JIANG L, LU F, FAN Q L, HUANG W. Synthesis of Fe doped CuS nanoparticles and its application in photothermal/Chemical kinetics combined therapy[J]. Chinese J. Inorg. Chem., 2023, 39(4): 671-679.
Yao Z, Lai Z Q, Chen C C, Xiao S T, Yang P H. Full-color emissive carbon-dots targeting cell walls of onion for in situ imaging of heavy metal pollution[J]. Analyst, 2019, 144(11): 3685-3690. doi: 10.1039/C9AN00418A
Zhou Y Q, Mintz K J, Sharma S K, Leblanc R M. Carbon dots: Diverse preparation, application, and perspective in surface chemistry[J]. Langmuir, 2019, 35: 9115-9132. doi: 10.1021/acs.langmuir.9b00595
Yue L L, Li H L, Sun Q, Zhang J, Luo X G, Wu F S, Zhu X J. Red-emissive ruthenium containing carbon dots for bioimaging and photodynamic cancer therapy[J]. ACS Appl. Nano Mater., 2020, 3(1): 869-876. doi: 10.1021/acsanm.9b02394
Sahoo P R, Prakash K, Kumar S. Synthesis of an oxadiazole through an indole mediated single step procedure for selective optical recognition of Cu2+ ions[J]. Sens. Actuator B-Chem., 2017, 242: 299-304. doi: 10.1016/j.snb.2016.11.047
Zuo J, Jiang T, Zhao X J, Xiong X H, Xiao S J, Zhu Z Q. Preparation and application of fluorescent carbon dots[J]. J. Nanomater., 2015, : 787862.
Sharma R, Ragavan K V, Thakur M S, Raghavarao K S M S. Recent advances in nanoparticle based aptasensors for food contaminants[J]. Biosens. Bioelectron., 2015, 74: 612-627. doi: 10.1016/j.bios.2015.07.017
Zeng Y W, Ma D K, Wang W, Chen J J, Zhou L, Zheng Y Z, Yu K, Huang S M. N, S co-doped carbon dots with orange luminescence synthesized through polymerization and carbonization reaction of amino acids[J]. Appl. Surf. Sci., 2015, 342: 136-143. doi: 10.1016/j.apsusc.2015.03.029
Xu G F, Niu Y S, Yang X C, Jin Z Y, Wang Y, Xu Y H, Niu H T. Preparation of Ti3C2Tx MXene-derived quantum dots with white/blue-emitting photoluminescence and electrochemiluminescence[J]. Adv. Opt. Mater., 2018, 6(24): 1800951. doi: 10.1002/adom.201800951
Raveendran V, Kizhakayil R N. Fluorescent carbon dots as biosensor, green reductant, and biomarker[J]. ACS Omega, 2021, 6: 23475-23484. doi: 10.1021/acsomega.1c03481
Wang S P, Zhao H R, Yang J L, Dong Y H, Guo S Z, Cheng Q, Li Y, Liu S X. Preparation of multicolor biomass carbon dots based on solvent control and their application in Cr(Ⅵ) detection and advanced anti-counterfeiting[J]. ACS Omega, 2023, 8: 6550-6558. doi: 10.1021/acsomega.2c06942
Mishra S, Kaustav D, Chatterjee S, Sahoo P, Kundu S, Pal M, Bhaumik A, Ghosh C K. Facile and green synthesis of novel fluorescent carbon quantum dots and their silver heterostructure: An in vitro anticancer activity and imaging on colorectal carcinoma[J]. ACS Omega, 2023, 8: 4566-4577. doi: 10.1021/acsomega.2c04964
张清梅, 张路鹏, 郑开文, 杨国庆, 何松杰, 杜秀娟, 陈峰华, 李冰. 高稳定性黑米碳点的绿色合成及其细胞成像应用[J]. 无机化学学报, 2023,39,(4): 735-745. ZHANG H Q, ZHANG L P, ZHENG K W, YANG G Q, HE S J, DU X J, CHEN F H, LI B. Green synthesis of high stability black rice carbon dots and its application in cell imaging[J]. Chinese J. Inorg. Chem., 2023, 39(4): 735-745.
刘晓龙, 李春燕, 薛金涛. 金银花主要活性成分及药理作用研究进展[J]. 新乡医学院学报, 2021,38,(10): 992-995. LIU X L, LI C Y, XUE J T. Research progress on main active components and pharmacological effects of honeysuckle[J]. Journal of Xinxiang Medical University, 2021, 38(10): 992-995.
Deng Y H, Zhao D X, Chen X, Wang F, Song H, Shen D Z. Long lifetime pure organic phosphorescence based on water soluble carbon dots[J]. Chem. Commun., 2013, 49(51): 5751-5753. doi: 10.1039/c3cc42600a
Jiang J, He Y, Li S Y, Cui H. Amino acids as the source for producing carbon nanodots: microwave assisted one-step synthesis, intrinsic photoluminescence property and intense chemiluminescence enhancement[J]. Chem. Commun., 2012, 48: 9634-9636. doi: 10.1039/c2cc34612e
Li X M, Zhang S L, Kulinich S A, Liu Y L, Zeng H B. Engineering surface states of carbon dots to achieve controllable luminescence for solid-luminescent composites and sensitive Be2+ detection[J]. Sci. Rep., 2014, 4: 4976. doi: 10.1038/srep04976
Li H, Kang Z, Liu Y, Lee S T. Carbon nanodots: Synthesis, properties and applications[J]. J. Mater. Chem., 2012, 22(46): 24230-24253. doi: 10.1039/c2jm34690g
Zu F L, Yan F Y, Bai Z J, Xu J X, Wang Y Y, Huang Y C, Zhou X G. The quenching of the fluorescence of carbon dots: A review on mechanisms and applications[J]. Microchim. Acta, 2017, 184(7): 1899-1914. doi: 10.1007/s00604-017-2318-9
Bai Z J, Yan F Y, Xu J X, Zhang J, Wei J F, Luo Y M, Chen L. Dual-channel fluorescence detection of mercuric(Ⅱ) and glutathione by down-and up-conversion fluorescence carbon dots[J]. Spectroc. Acta Pt. A-Molec. Biomolec. Spectr., 2018, 205: 29-39. doi: 10.1016/j.saa.2018.07.012
Shang L, Dong S J. Design of fluorescent assays for cyanide and hydrogenperoxide based on the inner filter effect of metal nanoparticles[J]. Anal. Chem., 2009, 81(4): 1465-1470. doi: 10.1021/ac802281x
Wen X P, Zhao Z H, Zhai S Q, Wang X D, Li Y Q. Stable nitrogen and sulfur co-doped carbon dots for selective folate sensing, in vivo imaging and drug delivery[J]. Diam. Relat. Mat., 2020, 105: 107791-107801. doi: 10.1016/j.diamond.2020.107791
Tian M, Liu Y M, Wang Y T, Zhang Y. Facile synthesis of yellow fluorescent carbon dots for highly sensitive sensing of cobalt ions and biological imaging[J]. Anal. Methods, 2019, 11: 4077-4083. doi: 10.1039/C9AY01244C

图 2 (a) N-CDs的TEM图(插图: HRTEM图); (b) N-CDs相应大小的分布直方图; (c) 不同激发波长下N-CDs的荧光光谱; (d) N-CDs的紫外可见吸收光谱, 插图: 日光(左)和365 nm紫外灯辐照(右)下N-CDs水溶液的照片
Figure 2 (a) TEM image of N-CDs (inset: HRTEM image); (b) Distribution histogram of corresponding size of N-CDs; (c) Fluorescence spectra of N-CDs at different excitation wavelengths; (d) UV-Vis absorbance spectrum of N-CDs, inset: photographs of N-CDs under daylight (left) and 365 nm UV light (right), respectively

图 3 (a) 硫酸奎宁和(b)N-CDs在激发波长360 nm处的吸光度与荧光积分强度关系图
Figure 3 Relationship of integrated fluorescence intensity against absorbance of (a) quinine sulfate and (b) N-CDs at λex of 360 nm

图 4 N-CDs表面官能团的表征: (a) 拉曼谱图; (b) FTIR谱图; (c) XPS谱图; N-CDs的(d) C1s、(e) N1s和(f) O1s的XPS谱图
Figure 4 Characterization of surface functional groups on N-CDs: (a) Raman spectrum; (b) FTIR spectrum; (c) XPS spectrum; XPS spectra of (d) C1s, (e) N1s, and (f) O1s of N-CDs

图 5 (a) 在pH=2~12的溶液中N-CDs的荧光强度; (b) 不同浓度KCl的离子强度对N-CDs荧光强度的影响; (c) 在连续紫外灯辐照下(365 nm), N-CDs的荧光强度随时间的变化; (d) 储存时间对N-CDs荧光强度的影响
Figure 5 (a) Fluorescent intensity of N-CDs in a solution with pH=2-12; (b) Effect of ionic strengths by various concentrations of KCl on the fluorescent intensity of N-CDs; (c) Changes in the fluorescence intensity of N-CDs with time under continuous UV light irradiation (365 nm); (d) Effect of storage time on the fluorescence intensity of N-CDs

图 6 N-CDs对Co2+的荧光检测: (a) 在Co2+(500 μmol·L-1)和其他常见金属离子存在下, N-CDs溶液的荧光强度差(F0-F); (b)不同浓度的Co2+ (0~1 470 μmol·L-1)对N-CDs荧光光谱的影响; (c) F0-F与Co2+浓度之间的关系
Figure 6 Fluorescence sensing of N-CDs to Co2+: (a) fluorescence intensity differences (F0-F) of N-CDs solution in the presence of Co2+ (500 μmol·L-1) and other common metal ions; (b) effect of different Co2+ concentrations (0-1 470 μmol·L-1) on the fluorescence spectrum of N-CDs; (c) relationship between F0-F and Co2+ concentration
F0 and F represent the fluorescence intensities of N-CDs before and after the addition of Co2+, respectively.

图 7 (a) Co2+的紫外可见吸收光谱(黑线)和N-CDs的激发光谱和发射光谱(蓝线); (b) 在不存在(红线)和存在Co2+ (200 μmol·L-1, 蓝线)的情况下N-CDs的荧光衰减寿命
Figure 7 (a) UV-Vis absorption spectrum (black curve) of Co2+ and the excitation and emission (blue curve) spectra of N-CDs; (b) Fluorescence decay lifetimes of N-CDs in the absence (red curve) and presence of Co2+ (200 μmol·L-1, blue curve)

图 9 HeLa细胞用含N-CDs(400 μg·mL-1)的培养液孵育2 h后的细胞成像: (a) 明场、(b) 405 nm激发、(c) 合场; 添加Co2+后(d) 30 s、(e) 60 s和(f) 90 s的细胞荧光成像
Figure 9 Cellular imaging of HeLa cells incubated with N-CDs (400 μg·mL-1) for 2 h: (a) bright field, (b) 405 nm excitation, (c) overlapped images; Cellular imaging followed by adding Co2+ for (d) 30 s, (e) 60 s, and (f) 90 s
表 1 在激发波长360 nm处的吸光度与荧光积分强度的相关数据
Table 1. Relevant data of integrated fluorescence intensity against absorbance of quinine sulfate and N-CDs at λex of 360 nm
| Parameter | Quinine sulfate | N-CDs | ||||||||
| Absorbance | 0.026 6 | 0.036 5 | 0.052 4 | 0.067 1 | 0.082 8 | 0.023 3 | 0.035 0 | 0.046 6 | 0.067 0 | 0.080 2 |
| Integrated intensity | 76 364 | 110 229 | 159 867 | 210 527 | 251 938 | 28 694 | 40 026 | 48 943 | 70 303 | 79 921 |
| k | 3 149 390 | 913 105 | ||||||||
| Φ/% | 54 | 15.6 | ||||||||
 下载: 导出CSV
表 2 N⁃CDs对自来水样品中Co2+的检测
Table 2. Detection of Co2+ by N-CDs in tap water samples
| Sample | Co2+ concentration/(nmol·L-1) | RSD*/% | Recovery/% | |
| Added | Detected | |||
| 1 | 1.0 | 0.980 | 3.04 | 96.2 |
| 2 | 1.5 | 1.518 | 2.55 | 103.1 |
| 3 | 2.0 | 1.982 | 1.79 | 98.1 |
| * Relative standard deviation. | ||||
下载: 导出CSV

 扫一扫看文章


扫一扫关注我们