Figure 1.
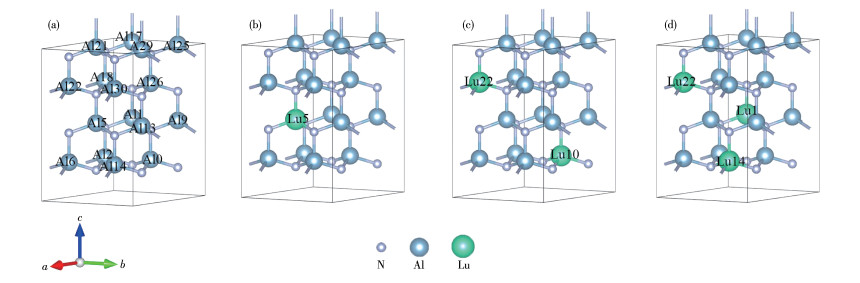
Supercell models of Al1-xLuxN: (a) x=0, (b) x=0.062 5, (c) x=0.125, (d) x=0.187 5
First-principles study on electronic structure and optical properties of Lu-doped AlNLu
Rui-Liang ZHANG , Sheng-Shang LU , Qing-Quan XIAO , Quan XIE

With the rapid development of electronic information technology, the performance requirements of semiconductor materials are getting higher[1]. As a classic Ⅲ - Ⅴ compound semiconductor material, AlN has attracted much attention because of its advantages, such as a wide direct bandgap[2], high electron mobility, high thermal conductivity[3], low thermal expansion coefficient[4], good chemical stability and mechanical strength, and good resistance to high temperature and corrosion. Therefore, AlN can be used as substrate material for ultraviolet LEDs, ultraviolet lasers, detectors, and other devices. AlN has great market application prospects in various optoelectronics devices, because of its good optical and mechanical properties[5].
Rare earth elements have been widely used in electronics, petrochemical, and other fields. Due to the low melting points of rare earth metals, with a unique electron shell of rare - earth metal atoms, the doping of rare - earth elements can effectively adjust the photoelectric properties of AlN. Doping has been used to change the conductive type of semiconductors and electronic structure, produce new impurity energy levels and different types of carriers, and then change the optical and electrical properties of the material. Sc[6], La, Er[7], Mg[8], Cr[9], Tm[10], Tb, Ce, or Eu[11] doped AlN has been investigated by experimental and theoretical research. Generally, the bandgap of AlN decreases with the increase of rare-earth element doping concen-trations, and the absorption in the visible light region is enhanced, thereby expanding the absorption region of AlN.
Lu is the hardest and densest metal element in rare earth elements, it can be used as a catalyst for chemical synthesis and the preparation of scintillation crystals. Li et al.[12] discussed the effect of Lu3+ addition on the microstructure and optical properties of phosphor through experiments, the results showed that the Lu - doped samples had higher luminescence intensity. This suggests that Lu doping could improve the optical properties of the crystal. To our knowledge, few theoretical data have been reported on the electronic structure and optical properties of Lu-doped AlN. Therefore, theoretical research about the electronic structure and optical properties of Lu-doped AlN (denoted as Al1-xLuxN, where x is the atomic fraction of Lu) is necessary. In this paper, the effects of Lu doping concentrations on the bandgap, density of states, and optical properties of AlN are studied by first-principles, which provide a theoretical basis for the preparation of various AlN-related electronic devices.
In this work, AlN is a hexagonal fiber zinc ore structure, the spatial point group is P63mc (No.186), and the lattice constants are a=b=0.311 2 nm, c=0.497 9 nm.
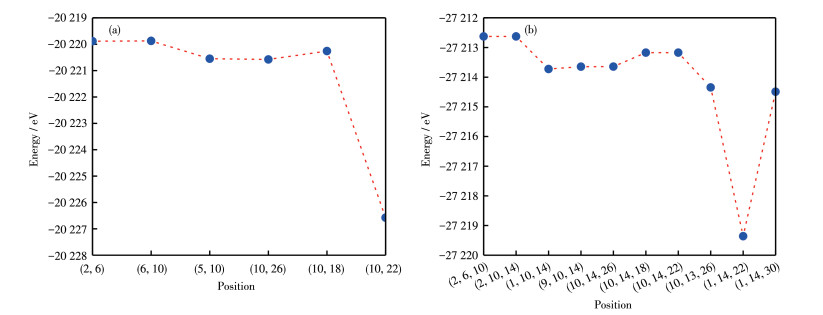
A 2×2×2 AlN supercell consisting of 16 Al atoms and 16 N atoms was constructed. The doping process was to substitute Al atoms with Lu atoms, and the doping concentrations were 0.062 5, 0.125, and 0.187 5, respectively. Fig. 1 shows the crystal structures of Al1-x LuxN (x=0, 0.062 5, 0.125, 0.187 5) supercells with different Lu doping concentrations after geometry optimization, In Fig. 1a, x=0, so it is the actual supercell of intrinsic AlN. The number of Al or Lu indicates the positions of atoms in the supercell. For example, Al5 represents the position of the fifth Al atom in the supercell, and Lu10 means that a Lu atom occupied the tenth position. When the doping concentration is 0.125, the expression (2, 6) means the occupancy of the second and sixth places by Lu atoms. Therefore, when the concentration of Lu doping is 0.125 and 0.187 5, Fig. 2 shows the energy after optimization of different Lu doping positions. By comparing the energy of the crystal structure when the doped atoms are in different positions, the preferred position of the doped atoms in the crystal structure can be determined. The crystal structure is more stable if its energy is lower. Therefore, the calculations in this work were based on the two structures shown in Fig. 1.
The calculations used for this work were carried out in the Cambridge Serial Total Energy Package (CASTAT) module of Materials Studio (Accelrys Company, 2019 Version) software package, a quantum mechanical program based on density functional theory that calculates from scratch. The BFGS (Broyden-Fletcher-Goldfarb-Shanno) algorithm was used to geometrically optimize the crystal geometry model, and then the electronic structure and optical properties of the geometrically optimized structure were calculated. The generalized gradient approximation (GGA) of Perdew - Burke - Ernzerhof (PBE) was selected to deal with the exchange - correlation potential. The base group used by the atom was the plane wave base group, and the method of plane wave ultrasoft pseudopotential was used to deal with the interaction between ions and electrons in the paper. The plane - wave cutoff energy was optimized to be 500 eV, and 8×8×4 K-point grids were selected to sample the Brillouin zone. The calculation parameters were set as follows: the energy convergence accuracy was 5×10⁻⁷ eV per atom, the maximum interaction force was 0.1 GPa, the convergence accuracy of interatomic forces was 0.1 eV·nm-1, the maximum interaction force was 0.05 GPa, and the maximum displacement was 2×10⁻⁴ nm. The calculation of energy was performed in the inverted space. The valence electrons involved in the calculations were N: 2s22p3, Al: 3s23p1, and Lu: 4f 145s25p65d16s2.
The supercell volume and bandgap of Al1-xLuxN with different Lu doping concentrations after geometry optimization were shown in Table 1. Obviously, with the increase of Lu doping concentration, the supercell volume increases, and the bandgap decreases. Since the atomic radius of Lu is larger than that of Al, as Al atoms are substituted by Lu atoms, the supercell volume of AlN increases. Although a larger supercell volume should be obtained with a higher doping concentration, it is difficult to obtain a doping concentration higher than 0.187 5 due to the limitation of Lu solid solubility.
 下载:
导出CSV
下载:
导出CSV
| Lu doping concentration (x) | a / nm | b / nm | c / nm | Supercell volume / nm3 | Bandgap / eV |
| 0 | 0.627 | 0.627 | 1.004 | 0.342 | 3.980 |
| 0.062 5 | 0.635 | 0.635 | 1.014 | 0.353 | 3.579 |
| 0.125 | 0.644 | 0.644 | 1.021 | 0.365 | 3.329 |
| 0.187 5 | 0.652 | 0.651 | 1.027 | 0.377 | 3.075 |
The top of the valence band and the bottom of the conduction band of intrinsic AlN are located at the same point in the Brillouin zone, as shown in Fig. 3, which indicates the intrinsic AlN is a direct bandgap semiconductor, the bandgap value is 3.890 eV, the results of this work do not differ significantly from those of Zou et al[13]. The calculated bandgap of the intrinsic AlN is much smaller than the experimental value of 6.2 eV[14], which is consistent with other literature due to the underestimation within GGA[15]. The bandgap value calculated by the GGA method is much smaller than the experimental value, and the relevant theoretical calculations show that the bandgap error calculated by the GGA method has a positive correlation trend with the bandgap value of the material itself. As a result, the bandgap error for a material calculated using the GGA method will be very small when the band gap is zero. The bandgap error for a material calculated using the GGA method will also be very large when the bandgap is large. For Ⅲ-Ⅴ main group compound semiconductors, the discontinuity of the wave function at CBM and VBM is the main reason for the small bandgap calculated by the GGA method[16]. This is a common problem in many articles[13, 17-18], but it does not affect our qualitative analysis of AlN.
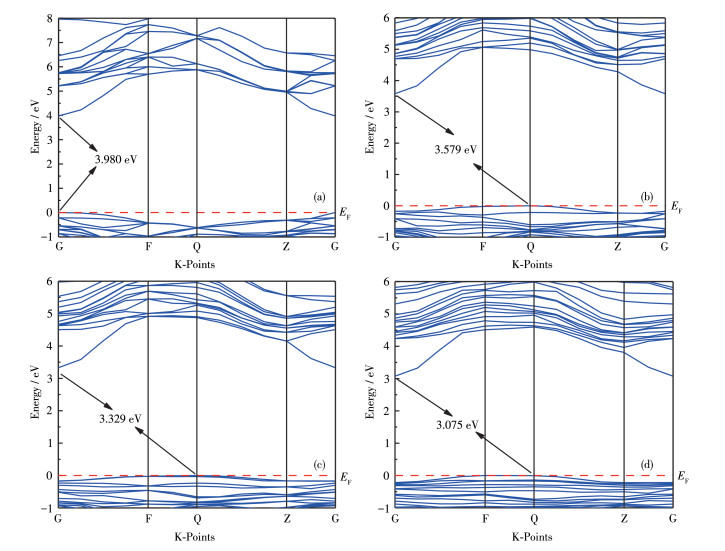
The top of the valence band and the bottom of the conduction band of Al 1 -xLuxN (x ≠0) are located at points F and G in the Brillouin zone, respectively, which indicates the Al1-xLuxN (x ≠0) is an indirect band-gap semiconductor. As the doping concentration increases, the bottom of the conduction band moves downwards, the band gap width narrows, and the band curve of the doped system becomes denser. This is due to the incorporation of rare earth elements, which cause lattice distortion and introduce new impurity energy levels into the energy band.
The bandgap is related to the electronic structure, so the electronic structure of Al1-xLuxN (x=0, 0.062 5, 0.125, 0.187 5) was further investigated by calculating the electronic density of states (DOS) as shown in Fig. 4.
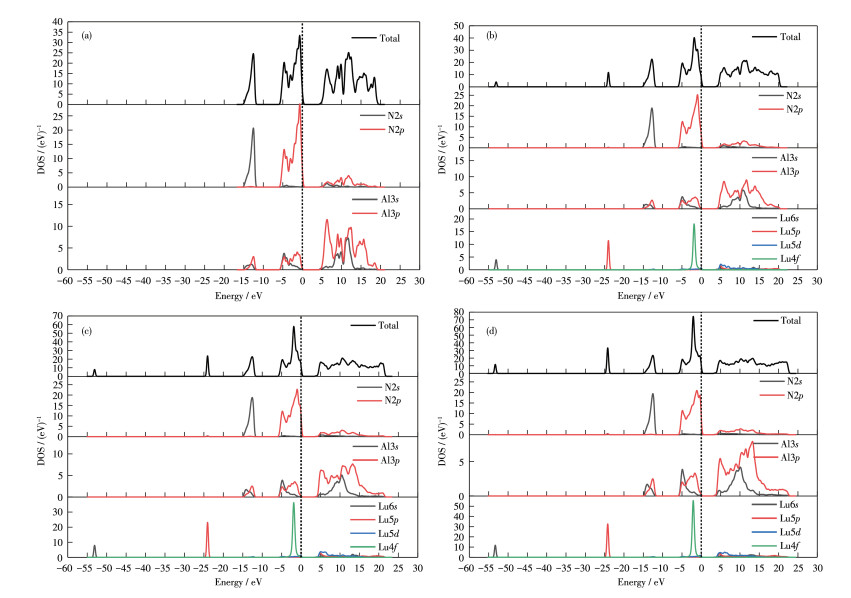
The total DOS (TDOS) spectrum shows three regions: the lower valence band (LVB) region at -15 to -11 eV, the upper valence band (UVB) region at -6 to 0 eV, and the conduction band (CB) region at 0 to 20 eV. For the intrinsic AlN, the TDOS is dominated by N2s, N2p, and Al3p states. In the TDOS of Al1-xLuxN (x=0, 0.062 5, 0.125, 0.187 5), LVB is mainly contributed by N2s states, the UVB is mainly contributed by N2 p and Lu4f hybrid orbitals, and the CB is dominated by Al3s, Al3p, and Lu5d states. In addition, an additional peak around -24 eV dominated by Lu5p is observed. With the increase of Lu doping concentration, the contributions of N2p state orbital hybridization to UVB gradually decrease, while the contribution of Lu4f state orbital hybridization to UVB increases. In the CB part, the bottom of the conduction band moves towards the lower energy. Therefore, the bandgap of AlN decreases with the increase of Lu doping concentration.
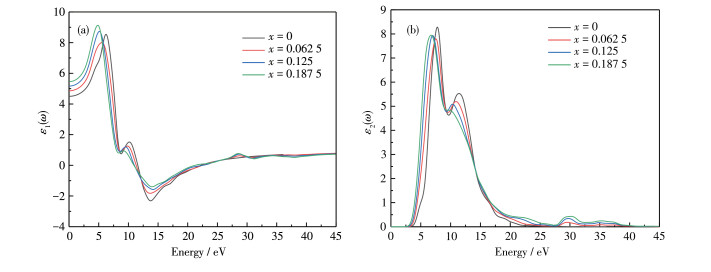
The optical properties of AlN are related to the transition of electrons between energy levels, and the probability and intensity of electronic transitions can be conducted by the study of the dielectric function. The dielectric function is expressed as[19]:
|
|
(1) |
where the imaginary part of the dielectric function ε2(ω) can be obtained by calculating the matrix ele-ments of the wave function in the unoccupied state, as shown below[20]:
|
|
(2) |
Where C and V are the conduction band and valence band, respectively; k and ω are the reciprocal lattice vector and angular frequency, respectively; BZ is the first Brillouin zone; e·MCV(k) is the matrix element of momentum warp; EC(k) and EV(k) are the intrinsic ener-gy level of the conduction band and valence band, respectively.
The real part ε1(ω) can be derived from the imaginary part ε2(ω) through the Kramers-Kronig relation:
|
|
(3) |
where P is the value of principal integration.
The real and imaginary parts of the dielectric function for Al1 -xLuxN are shown in Fig. 5. The real part is the static dielectric constant under the electrostatic field. As shown in Fig. 5a, the static dielectric constant ε1(0) are 4.50, 4.86, 5.17, and 5.46, respectively, when the energy value is zero and x=0.062 5, 0.125, 0.187 5. The ε1(0) increases with the increase of Lu doping concentration due to the increase of system energy and volume.
The imaginary part mainly reflects the optical absorption characteristics of the semiconductor. As shown in Fig. 5b, the peaks of the imaginary part are all lower than the intrinsic AlN, but its peaks increase with the increase of Lu doping concentration, and when x=0, 0.062 5, 0.125, and 0.187 5, the corresponding peaks are 8.28, 7.79, 7.93, and 7.95 eV, respectively. In addition, Lu doping makes the imaginary part of the dielectric function for AlN move towards the lower energy direction as a whole. This is mainly due to the incorporation of Lu impurity level, and Lu5d, N2p, and Al3 p work together at the top of the valence band, so the bandgap width of the system decreases with the increase of Lu doping concentration, and the electron transition is more prone to occur. Furthermore, the degree of the red shift is enhanced with the increase of Lu doping concentrations, which corresponds to the decrease in the bandgap of AlN.
The optical properties such as reflectivity R(ω), absorption coefficient α(ω), energy-loss spectrum L(ω), and photoconductivity were calculated using relations given by earlier workers. Fig. 6a shows the reflectivity of Al1 -xLuxN (x=0, 0.062 5, 0.125, 0.187 5). Al1-xLuxN shows high reflectivity in the ultraviolet region, and the strength of the reflection peak in the ultraviolet region decreases with the increase of Lu doping concentrations and shifts to the lower energy.
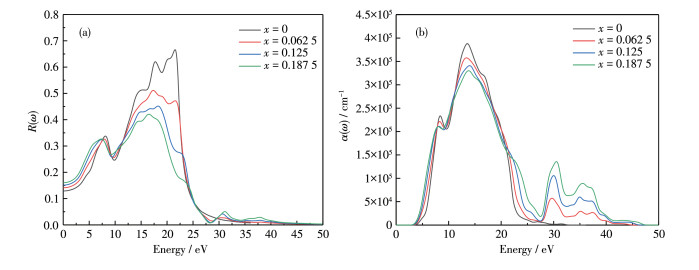
The absorption spectrum is the percentage of timeintensity decay of light waves propagating per unit distance in a semiconductor medium. As shown in Fig. 6b, the absorption coefficients of Al1-xLuxN (x=0, 0.062 5, 0.125, 0.187 5) are all at 105 cm-1 level, indicating that they all have good absorption performance. In the deep ultraviolet region, the peak intensity decreases gradually with the increase of Lu doping concentration. While in the visible and infrared regions, the absorption coefficients increase with the increase of Lu doping concentration. The illustration on the upper right shows that the absorption edges of AlN, Al0.937 5Lu0.062 5N, Al0.875Lu0.125N, Al 0.812 5Lu0.18 75N are equal to 2.43, 1.98, 1.66, and 1.53 eV, respectively, which are consistent with the change of the bandgap. Compared with intrinsic AlN, Al1-xLu x N (x≠0) has an extra absorption peak at 30 eV. Since the energy level of generated impurities is in the bandgap, the absorption of visible light increases, and the absorption zone broadens.
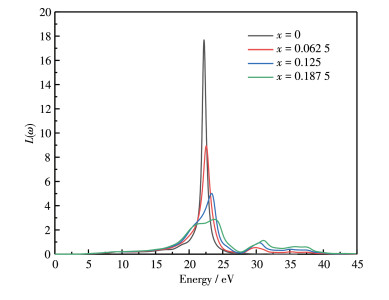
The energy loss when the electron passes through the uniform dielectric can be further deduced from the dielectric function. The energy - loss L(ω) spectra of Al1-xLuxN (x=0, 0.062 5, 0.125, 0.187 5) are shown in Fig. 7, and its characteristic peak is related to plasma oscillation[21]. The peak values are 17.68, 8.94, 5.01, and 2.87, respectively. The peaks of Al1-xLux N (x ≠0) are lower than that of intrinsic AlN, indicating that the emissivity of secondary electrons is extremely high after doping. In addition, the peak position exhibits a blue shift with the increase of doping concentration, indicating that Lu doping into AlN enhances the electronic transition of the upper valence band.
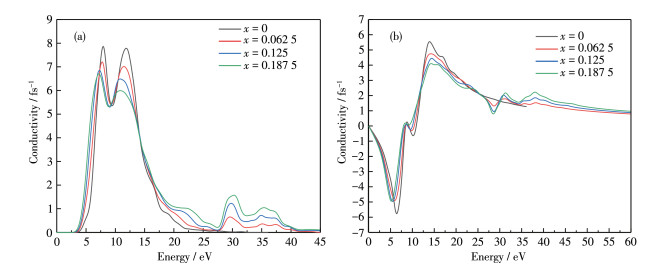
The real and imaginary parts of the photoconductivity of Al1-xLuxN (x=0, 0.062 5, 0.125, 0.187 5) are shown in Fig. 8. The real part is observed that photoconductivity increases sharply in the low - energy region with the increase of energy, which confirms that there are more free electron transitions in the conduction band. The imaginary part of the photoconductivity of Al1-xLuxN (x=0, 0.062 5, 0.125, 0.187 5) is 0 at the initial position. Lu doping makes the imaginary part of the photoconductivity for AlN move toward the lower energy direction. The minimum value gradually becomes larger, while the maximum value gradually becomes smaller. After the energy is greater than 60 eV, the conductivity overlaps and is relatively stable.
Detailed first - principles investigations have been done on the electronic structure and optical properties of Al1-x LuxN (x =0, 0.062 5, 0.125, 0.187 5) with different Lu doping concentrations. The results show that the conduction band moves down and the bandgap becomes narrower with the increase of Lu doping concentration. Therefore, it is easier for electrons to transition from the valence band to the conduction band, resulting in the redshift of reflectivity, and absorption coefficient. The static dielectric constant increases with the increase of Lu doping concentration, however, the peak intensities of reflectivity, absorption coefficient, energy loss function, and photoconductivity decrease with the increase of Lu doping concentration. Lu doping enhances the absorption coefficient of AlN in the visible and infrared regions, which would make AlN a potential candidate in the photoelectrochemical application.
Bernien H, Schwartz S, Keesling A, Levine H, Omran A, Pichler H, Choi S, Zibrov A S, Endres M, Greiner M, Vuletic V, Lukin M D. Probing many-body dynamics on a 51-atom quantum simulator[J]. Nature, 2017, 551(7682): 579-584. doi: 10.1038/nature24622
Aubert T, Assouar M B, Legrani O, Elmazria O, Tiusan C, Robert S. Highly textured growth of AlN films on sapphire by magnetron sputtering for high temperature surface acoustic wave applications[J]. J. Vac. Sci. Technol. A, 2011, 29(2): 021010. doi: 10.1116/1.3551604
Iriarte G F, Rodríguez J G, Calle F. Synthesis of c-axis oriented AlN thin films on different substrates: A review[J]. Mater. Res. Bull., 2010, 45(9): 1039-1045. doi: 10.1016/j.materresbull.2010.05.035
Kale A, Brusa R S, Miotello A. Structural and electrical properties of AlN films deposited using reactive RF magnetron sputtering for solar concentrator application[J]. Appl. Surf. Sci., 2012, 258(8): 3450-3454. doi: 10.1016/j.apsusc.2011.11.095
Pelegrini M V, Alvarado M A, Alayo M I, Pereyra I. Deposition and characterization of AlN thin films obtained by radio frequency reactive magnetron sputtering[J]. Can. J. Phys., 2014, 92(7/8): 940-942. doi: 10.1139/cjp-2013-0556
Momida H, Teshigahara A, Oguchi T. Strong enhancement of piezoelectric constants in ScxAl1-xN: First-principles calculations[J]. AIP Adv., 2016, 6(6): 065006. doi: 10.1063/1.4953856
Soares M J, Leitão J P, da Silva M I N, González J C, Matinaga F M, Lorenz K, Alves E, Peres M, Monteiro T. Structural and optical properties of Er implanted AlN thin films: Green and infrared photoluminescence at room temperature[J]. Opt. Mater., 2011, 33(7): 1055-1058. doi: 10.1016/j.optmat.2010.09.005
Sun X L, Xiong J, Zhang W H, Liu L, Gu H S. Investigation of blue luminescence in Mg doped AlN films[J]. J. Alloy. Compd., 2015, 621: 314-318. doi: 10.1016/j.jallcom.2014.10.018
Caldwell M L, Martin A L, Dimitrova V I, Van Patten P G, Kordesch M E, Richardson H H. Emission properties of an amorphous AlN: Cr3+ thin-film phosphor[J]. Appl. Phys. Lett., 2001, 78(9): 1246-1248. doi: 10.1063/1.1351531
Nepal N, Zavada J M, Lee D S, Steckl A J. Dynamics of ultraviolet emissions in Tm -doped AlN using above band gap excitation[J]. Appl. Phys. Lett., 2008, 93(6): 061110. doi: 10.1063/1.2970993
Aldabergenova S B, Osvet A, Frank G, Strunk H P, Taylor P C, Andreev A A. Blue, green and red emission from Ce3+, Tb3+ and Eu3+ ions in amorphous GaN and AlN thin films[J]. J. Non-Cryst. Solids, 2002, 299(Part 1): 709-713.
李金银, 彭志雄, 余丽萍, 周文理, 邱忠贤, 李承志, 廉世勋. Si, Lu掺杂Ca0.8Zn0.2TiO3: Pr3+荧光粉的光学性能改善[J]. 发光学报, 2018,39,(5): 643-652. LI J Y, PENG Z X, YU L P, ZHOU W L, QIU Z X, LI C Z, LIAN S X. Si, Lu doped Ca0.8Zn0.2TiO3: Improvement of optical properties of Pr3+ phosphor[J]. Chinese Journal of Luminescence, 2018, 39(5): 643-652.
邹江, 李平, 谢泉. (La, Y)掺杂AlN的电子结构和光学性质的第一性原理研究[J]. 人工晶体学报, 2021,50,(11): 2036-2044. doi: 10.3969/j.issn.1000-985X.2021.11.005ZOU J, LI P, XIE Q. First-principle study on electronic structure and optical properties of (La, Y)-doped AlN[J]. Journal of Synthetic Crystals, 2021, 50(11): 2036-2044. doi: 10.3969/j.issn.1000-985X.2021.11.005
Xie F W, Yang P, Li P, Zhang L Q. First-principle study of optical properties of (N, Ga) codoped ZnO[J]. Opt. Commun., 2012, 285(10/11): 2660-2664.
Tai Z W, Yang C T, Hu X W, Xie Y W. Structural and optical prop- erties of Er-doped AlN[J]. Integr. Ferroelectr., 2019, 192(1): 154-163.
张泽群, 孙庆德. 密度泛函理论计算半导体材料的带隙误差研究[J]. 济南大学学报(自然科学版), 2021,35,(6): 580-584. ZHANG Z Q, SUN Q D. Research on error in calculation band gap of semiconductor materials by using density functional theory[J]. Journal of University of Jinan (Science and Technology), 2021, 35(6): 580-584.
贾晓凤, 刘玉慧, 王赫. 稀土元素La掺杂对AlN性能影响的第一性原理研究[J]. 原子与分子物理学报, 2021,38,(4): 175-180. JIA X F, LIU Y H, WANG H. First principles study on the effect of rare earth element La doping on the properties of AlN[J]. Chinese Journal of Atomic and Molecular Physics, 2021, 38(4): 175-180.
王腊节, 聂招秀. C掺杂AlN的电子结构和光学性质的第一性原理研究[J]. 原子与分子物理学报, 2019,36,(1): 116-122. WANG L J, NIE Z X. First-principles study on the electronic structure and optical properties of C-doped AlN[J]. Chinese Journal of Atomic and Molecular Physics, 2019, 36(1): 116-122.
Li H L, Lv Y B, Li J Z, Yu K. Experimental and first-principles studies of structural and optical properties of rare earth (RE=La, Er, Nd) doped ZnO[J]. J. Alloy. Compd., 2014, 617: 102-107.
Zhao L J, Zhang X C, Fan C M, Liang Z H, Han P D. First-principles study on the structural, electronic and optical properties of BiOX (X=Cl, Br, I) crystals[J]. Physica B, 2012, 407(17): 3364-3370.
Radzwan A, Ahmed R, Shaari A, Lawal A. First -principles study of electronic and optical properties of antimony sulphide thin film[J]. Optik, 2020, 202: 163631.

Figure 1 Supercell models of Al1-xLuxN: (a) x=0, (b) x=0.062 5, (c) x=0.125, (d) x=0.187 5

Figure 2 Lowest energy plots of different doped positions of Al1-xLuxN: (a) x=0.125, (b) x=0.187 5

Figure 3 Band structures of Al1-xLuxN: (a) x=0, (b) x=0.062 5, (c) x=0.125, (d) x=0.187 5

Figure 4 Electronic density of states (DOS) of Al1-xLuxN: (a) x=0, (b) x=0.062 5, (c) x=0.125, (d) x=0.187 5

Figure 6 Optical properties of Al1-xLuxN: (a) reflective index R(ω), (b) absorption coefficient α(ω)
Table 1. Supercell lattice constant and bandgap of Al1-xLuxN
| Lu doping concentration (x) | a / nm | b / nm | c / nm | Supercell volume / nm3 | Bandgap / eV |
| 0 | 0.627 | 0.627 | 1.004 | 0.342 | 3.980 |
| 0.062 5 | 0.635 | 0.635 | 1.014 | 0.353 | 3.579 |
| 0.125 | 0.644 | 0.644 | 1.021 | 0.365 | 3.329 |
| 0.187 5 | 0.652 | 0.651 | 1.027 | 0.377 | 3.075 |
 下载: 导出CSV

 扫一扫看文章

扫一扫关注我们