Table 1.
Crystal data and structural refinement summary of CPs 1 and 2
Citation:
Long TANG, Lu-Yuan CHEN, Xiang-Yang HOU, Xiao WANG, Ji-Jiang WANG. Two cadmium-based coordination polymers with tripodal carboxylate and imidazolyl ligands: Syntheses, structures, and fluorescent properties[J]. Chinese Journal of Inorganic Chemistry,
2023, 39(1): 168-180.
doi:
10.11862/CJIC.2022.273

基于三脚架羧酸和咪唑基配体的两种镉基配合物的合成、结构与荧光性质
摘要:
通过水热法合成了2种镉基配位聚合物[Cd (Htatb)(1,4-bimb)]·H2O (1)和[Cd (Htatb)(1,4-bib)(H2O)]·DMF (2)(H3tatb=4,4',4″-s-三嗪-2,4,6-三苯甲酸,1,4-bimb=1,4-双(咪唑-1-甲基)苯,1,4-bib=1,4-双(1-咪唑基)苯),并用X射线单晶衍射、热重分析、红外光谱和元素分析等手段对其进行了表征。1是一个2D层结构,这些层进一步通过O—H⋯O氢键连接,形成四重互穿3D结构。2也是2D层结构,通过O—H⋯O氢键进一步连接,形成二重穿插的3D结构。配合物1和2具有荧光性质。1通过不同的检测机制对硝基苯和Fe3+离子具有高度的选择性和敏感性,而2对2,4,6-三硝基苯酚和CrO42-离子具有高度的选择性和敏感性。
English
Two cadmium-based coordination polymers with tripodal carboxylate and imidazolyl ligands: Syntheses, structures, and fluorescent properties
Abstract:
Two cadmium-based coordination polymers [Cd(Htatb) (1,4-bimb)] ·H2O (1) and [Cd(Htatb) (1,4-bib) (H2O)]·DMF (2) (H3tatb=4, 4', 4″-s-triazine-2,4,6-tribenzoic acid, 1,4-bimb=1,4-bis(imidazole-1-ylmethyl) benzene, 1,4-bib=1,4-bis(1-imidazoly) benzene) were synthesized by hydrothermal reactions and characterized by single-crystal X-ray diffraction, thermogravimetric analyses, IR spectroscopy, elemental analysis, etc. 1 displays a 2D layer structure, further these layers are joined by O—H⋯O hydrogen bonding to generate a four-fold interpenetrating 3D architecture. 2 shows a 2D layer structure, further joined through O—H⋯O hydrogen bonding to produce a two-fold interpenetrating 3D architecture. Complexes 1 and 2 had fluorescent properties. 1 was highly selective and sensitive towards nitrobenzene and Fe3+ ion through different detection mechanisms, while CP 2 was highly selective and sensitive towards 2,4,6-trinitrophenol and CrO42- ion.
-
Key words:
- cadmium(Ⅱ)
- / coordination polymers
- / crystal structure
- / fluorescent properties
-
0. Introduction
Metal-organic coordination polymers (MOCPs) of mixed-ligand assembly have become a very attractive research field[1-4]. Due to its many advantages, it has applications in many fields, such as absorption, heterogeneous catalysis, electrochemistry, ion exchange, and fluorescence sensing[5-8]. The mixed-ligand strategy by the judicious choice of various organic linkers has been proven to be high-efficient for the construction of MOCPs. Among such systems, the most outstanding is the incorporation of polycarboxylates and N-donors co-ligands, which has successfully been utilized to generate more diverse and interesting polymeric net-works with potential properties and contributes to refin-ing our knowledge of self-assembly processes[9-11]. Within polycarboxylate ligands, aromatic polycarboxyl compounds have extensively been documented as multifunctional structures, owing to their versatile linking capability by virtue of both covalent bonding and supramolecular interactions[12-14]. Luminescent metal-organic coordination polymers (LMOCPs) are a very important branch of MOCPs. At present, lots of studies have proved that LMOCPs as fluorescent sensors are feasible and effective in detecting pollutants. LMOCPs generally emit light in the following ways: organic ligands emit light, and the charge transfer between metal ions and ligands can emit light[15-17]. The tunable structures and properties of cadmium-based coordination polymers provide an important advantage to fluorescence sensing materials.
In our strategy, multidentate O- or N-donor ligands have also been employed in the construction of coordination polymers (CPs). Among the family of organic carboxylate, tripodal carboxylate shows more superiority, the ligand 4, 4′, 4″-s-triazine-2,4,6-tribenzoic acid (H3tatb) as a class example of tripodal ligands has been utilized, and some MOCPs based on H3tatb have also been investigated[18-21]. To explore the influence of N-donor ligands on achieving different dimensional and topological structures based on tripodal carboxylate ligands, we also employ 1,4-bis(imidazole-1-ylmethyl) benzene(1,4-bimb) and 1,4-bis(1-imidazoly) benzene(1,4-bib) with different conformations as co-ligands. Two cadmium-based CPs, [Cd(Htatb) (1,4-bimb)]·2O (1) and [Cd(Htatb)(1,4-bib)(H2O)]·MF (2), were synthesized and characterized. In addition, their fluorescent properties were also investigated.
1. Experimental
1.1 Materials and chemical analysis
The H3tatb, 1,4-bimb, and 1,4-bib ligands were purchased in the Jinan Henghua Sci. & Technol. Co., Ltd. All other reagents and solvents employed were commercially available and used without further purification. Elemental analyses were performed with a Perkin-Elmer 2400 CHN Elemental analyzer. Infrared spectra on KBr pellets were recorded on a Nicolet 170SX FT-IR spectrophotometer in a range of 400-4 000 cm-1. Thermogravimetric (TG) analyses were conducted with a Nietzsch STA 449C micro analyzer under the atmosphere at a heating rate of 5 ℃·min-1. Powder X-ray diffraction (PXRD) patterns were recorded on a Shimadzu XRD-7000 diffractometer analyzer. The working voltage was 40 kV, the current was 40mA, the radiation source was Cu Kα (λ=0.154 18 nm), and the scanning range was 20°-80° The fluorescence spectra were obtained using a Hitachi F-7100 fluorescence spectrophotometer at room temperature.
1.2 Synthesis of CP 1
A mixture of Cd(NO3)2·4H2O (0.1 mmol, 0.031 g), H3tatb (0.1 mmol, 0.044 g), 1,4-bimb (0.1 mmol, 0.024 g) and 8 mL DMF-H2O (1:1, V/V) was stirred for 30 min in the air. The mixture was then transferred to a 20 mL airtight glass reactor and kept at 100 ℃ for 5 d under autogenous pressure, and then cooled to room temperature at a rate of 5 ℃·h-1. Colorless crystals of 1 were obtained and washed with DMF and dried in the air (Yield: 49% based on Cd). Elemental analysis Calcd. for C38H29N7O7Cd(%): C, 56.48; H, 3.62; N, 12.13. Found(%): C, 56.62; H, 3.72; N, 12.24. IR data (KBr, cm-1): 3 424(w), 3 108(s), 1 719(s), 1 656(w), 1 581 (w), 1 522(vs), 1 364(m), 1 122(w), 1 063(m), 1 013(w), 933(w), 822(m), 766(s), 647(w).
1.3 Synthesis of CP 2
The preparation of 2 was the same as that of 1 except using 1,4-bib ligand (0.1 mmol, 0.021 g) instead of 1,4-bimb. Colorless crystals of 2 were obtained and washed with DMF and dried in the air (yield: 51% based on Cd). Elemental analysis Calcd. for C39H32N8O8Cd(%): C, 54.91; H, 3.78; N, 13.13. Found (%): C, 54.83; H, 3.87; N, 13.21. IR data (KBr, cm-1): 3 429(w), 3 122(w), 1 713(m), 1 655(w), 1 540(m), 1 516 (vs), 1 401(m), 1 362(s), 1 237(m), 1 112(m), 1 088(m), 1 016(m), 939(w), 833(m), 771(s), 650(w).
1.4 X-ray crystallographic studies
Diffraction intensities for CPs 1 and 2 were collected at 293 K on a Bruker SMART 1000 CCD diffractometer employing graphite-monochromated Mo Kα radiation (λ=0.071 073 nm). A semi-empirical absorption correction was applied using the SADABS program[22]. The structures were solved by direct methods and refined by full-matrix least-squares on F2 using the SHELXS 2014 and SHELXL 2014 programs, respectively[23-24]. Non-hydrogen atoms were refined anisotropically and hydrogen atoms were placed in geometrically calculated positions and refined using a riding model. The crystallographic data for CPs 1 and 2 are listed in Table 1, and selected bond lengths and angles are listed in Table S1 (Supporting information).
Table 1

 下载:
导出CSV
下载:
导出CSV
Parameter 1 2 Empirical formula C38H29CdN7O7 C39H32CdN8O8 Formula weight 808.08 853.12 Crystal system Triclinic Triclinic Space group P1 P1 a/nm 0.884 21(6) 0.852 66(17) b/nm 1.174 70(9) 1.306 8(2) c/nm 1.695 04(12) 1.761 1(3) α/(°) 90.573 0(10) 107.122(3) β/(°) 102.532 0(10) 93.698(3) γ/(°) 94.004 0(10) 90.617(3) V/nm3 1.713 9(2) 1.870 5(6) Dc/(g·m-3) 1.566 1.515 Z 2 2 μ/mm-1 0.700 0.649 θ range for data collection/(°) 2.366-25.000 2.395-25.000 Reflection collected, unique 8 649, 5 975 (Rint=0.014 0) 9 356, 6 533 (Rint=0.024 8) Data, restraint, number of parameters 5 975, 2, 487 6 533, 15, 515 Goodness-of-fit on F2 1.053 1.030 Final R indices[I > 2σ(I)] R1=0.029 3, wR2=0.074 1 R1=0.049 1, wR2=0.120 0 Largest difference in peak and hole/(e·m-3) 861 and -469 1 102 and -579 2. Results and discussion
2.1 Description of the structure
2.1.1 Crystal structures of CP 1
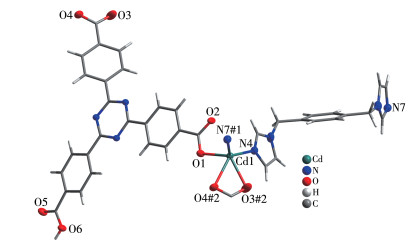
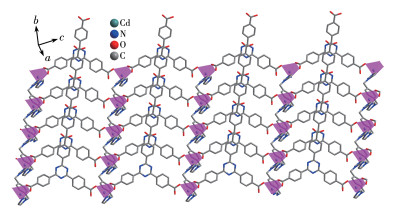
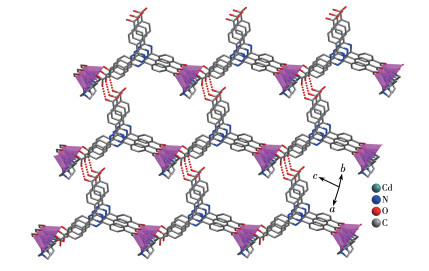
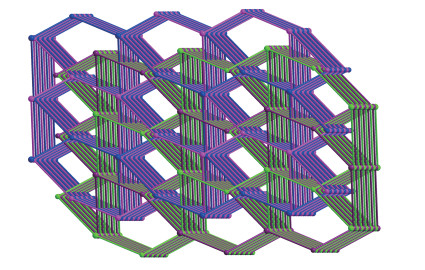
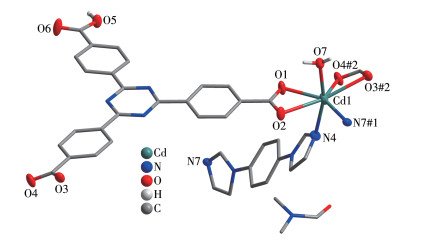
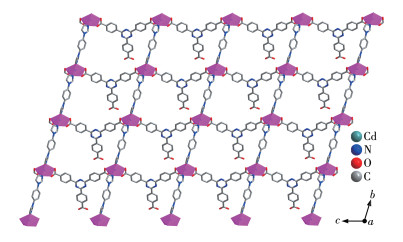
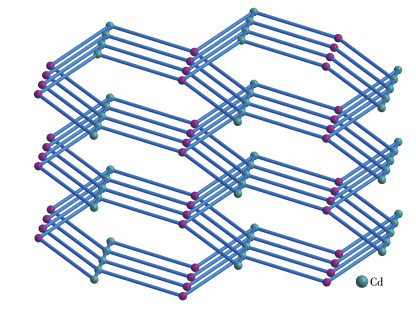
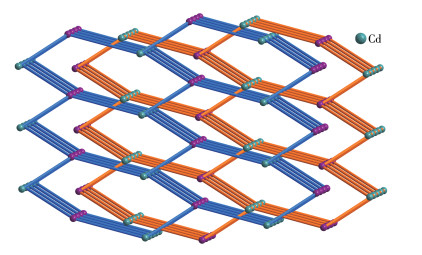
Single-crystal X-ray analysis reveals that CP 1 exhibits a 4-fold interpenetrating 3D structure. The asymmetric unit of 1 comprises one CdⅡ ion, one Htatb2- ion, one 1,4-bimb molecule, and one free water molecule. Each five-coordinated CdⅡ center is surrounded by two nitrogen atoms coming from two 1,4-bimb molecules, and three oxygen atoms from two Htatb2- ions, taking a distorted square pyramidal geometry (Fig. 1). The bond lengths of Cd—O/N are in a range of 0.220 25(18)-0.244 1(2) nm, and the O/N—Cd—O/N bond angles cover a range of 53.80(8)°-134. 41(9)°. In CP 1, the tripodal carboxylate ligands are partly deprotonated and one carboxylate group adopts μ1-η1-η0 to link one CdⅡ ion, and another one adopts μ1-η1-Ⅱ1 chelating mode to link one CdⅡ ion, resulting in a 1D chain structure, further through 1,4-bimb ligand bridging, the adjacent chains are connected to generate a 2D layer structure (Fig. 2). These 2D layers are further joined by O—H⋯O hydrogen bonding (O6⋯O2 distance: 0.257 8(3) nm, O6—H6⋯O2 angle: 162.3(4)°) to produce a 3D architecture (Fig. 3). To simplify the 3D framework, we considered the Htatb2- anion as a 3-connected node and CdⅡ ion as a 5-connected node, 1,4-bimb ligand as linkers, and topological analysis by TOPOS program suggests that the 3D framework can be simplified as a 3, 5-connected net with a point symbol of (3·72) (32·75·83) (Fig. S1). However, due to the absence of large guest molecules to fill the void space, the potential voids are filled via mutual interpenetration of three independent equivalent frameworks, generating a four-fold interpenetrating 3D architecture (Fig. 4).
Figure 1
 Figure 1. Coordination environment of Cd(Ⅱ) ion in CP 1
The free H2O molecules are omitted for clarity; Displacement ellipsoids are drawn at the 40% probability level; Symmetry codes: #1: x+1, y+1, z; #2: x+1, y, z+1
Figure 2
Figure 3
Figure 4
2.1.2 Crystal structures of CP 2
CP 2 shows a 2-fold interpenetrating 3D structure. Each seven-coordinated CdⅡ ion is located in a [CdO5N2] distorted pentagonal bipyramid geometry and is coordinated to five oxygen atoms of two Htatb2- ions and a coordination water molecule, and two nitrogen atoms of two 1,4-bib molecules, as shown in Fig. 5. The bond lengths of Cd—O and Cd—N are in a range of 0.225 1(4)-0.263 7(3) nm, these bond lengths are similar to those found in related cadmium-based coordination polymers[25]. Compared with CP 1, the carboxylic groups of 2 adopt μ1-η1-η1 and μ1-η1-η1 chelating mode to link CdⅡ ions, resulting in a 1D chain structure(Fig. S2), and through 1,4-bib ligand bridging, the adjacent chains are connected to generate a 2D layer structure (Fig. 6). These 2D layers are further joined through O—H⋯O hydrogen bonding (O5⋯O2 distance: 0.259 7 (5) nm, O5—H5⋯O2 angle: 161.76(4)° to produce a 3D architecture (Fig. S3). Topological analysis by the TOPOS program suggests that the 3D framework can be simplified as a 3, 5-connected net with a point symbol of (3·72) (32·75·83) (Fig. 7). It is noteworthy that there are large open channels in CP 2. It is apt to form interpenetrating frameworks, accordingly, the final structure of CP 2 is a two-fold interpenetrating 3D framework (Fig. 8).
Figure 5
 Figure 5. Coordination environment of Cd(Ⅱ) ion in CP 2
Hydrogen atoms are omitted for clarity except for the carboxyl group and coordination water; Displacement ellipsoids are drawn at the 40% probability level; Symmetry codes: #1: x, y+1, z; #2: x, y, z-1
Figure 6
Figure 7
Figure 8
2.2 TG analysis
The experimental diffraction patterns featured peaks that are almost consistent with the simulated patterns, indicating that the products are almost pure phases (Fig. S4 and S5). To study the thermal stability of CPs 1 and 2, TG analyses were performed on the polycrystalline samples under a nitrogen atmosphere (Fig. S6 and S7). TG curve of 1 revealed that the first weight loss of 2.4% from 50 to 110 ℃ corresponds to the loss of the lattice water molecules (Calcd. 2.23%), and then the larger weight loss (Obsd. 84.3%) occurred in a range of 240-490 ℃, corresponding to the decomposition of the Htatb2- and 1,4-bimb ligands (Calcd. 83.86%). The TG curve of 2 showed two-step weight losses. The first weight loss in a range of 60-170 ℃ (Obsd. 10.9%, Calcd. 10.68%) is assignable to the loss of DMF and coordination water molecules. The second weight loss of 76.4% in a temperature range of 240-460 ℃ corresponds to the release of the Htatb2- and 1,4-bib ligands (Calcd. 76.14%). The final decomposition products of 1 and 2 were confirmed to be CdO, which has also been further confirmed by the PXRD patterns of the CPs.
2.3 Infrared spectra of CPs 1 and 2
IR spectra of CPs 1 and 2 showed features attributable to compositions of the coordination polymers (Fig. S8 and S9). The observed strong characteristic peaks appearing around 3 424 and 3 429 cm-1 in spectra are attributed to the O—H stretching vibrations, respectively. Due to partial deprotonation of carboxylate in 1 and 2, the absorptions of about 1 719 and 1 713 cm-1 can be attributed to the stretching vibrations of the νCOOH in the carboxylate. The presence of the characteristic bands at 1 656 and 1 655 cm-1 for 1 and 2 suggests the ν—C=N— stretching vibrations of Htatb2- ion. The intense characteristic peaks appearing around 1 581 and 1 522, 1 364 cm-1 for 1, 1 540 and 1 516, 1 401 cm-1 for 2 in the IR spectra correspond to asymmetric and symmetric stretching vibrations of carboxylic groups, respectively. The presence of the characteristic bands at 1 122 and 1 112 cm-1 for 1 and 2 suggests the νC—O stretching vibrations. The presence of the characteristic bands at 1 063 cm-1 for 1 and 1 088 cm-1 for 2 suggests the νC—N stretching vibrations of the imidazole ring. The absorptions of 640-850 cm-1 of 1 and 2 can be attributed to the γC—H out-of-plane bending vibration of the phenyl ring.
2.4 Photoluminescence properties
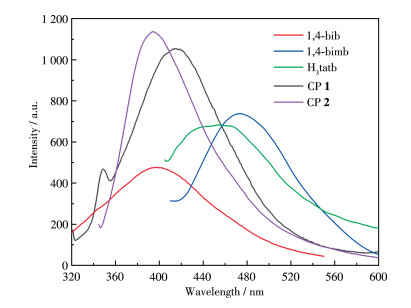
The luminescent emission spectra of CPs 1 and 2 were examined in the solid state at room temperature as shown in Fig. 9. The main emission peak of the free H3tatb appeared at 454 nm (λex=364 nm), which can be assigned to the intra-ligand π*-π transitions[26]. CP 1 showed a strong emission peak at 409 nm (λex=369 nm), however, the intense emission of 1,4-bimb was observed at 473 nm (λex=400 nm), respectively. Relative to their ligands, 1 showed a blue shift, probably owing to ligand-to-metal charge transfer (LMCT) [27-28]. CP 2 showed an emission peak at 394 nm (λex=334 nm), in comparison with that of free H3tatb and 1,4-bib (an intense emission at 398 nm with λex=306 nm), which are attributed to H3tatb or 1,4-bib ligand-based charge transfer[29-30].
Figure 9
2.5 Detection of nitroaromatic compounds
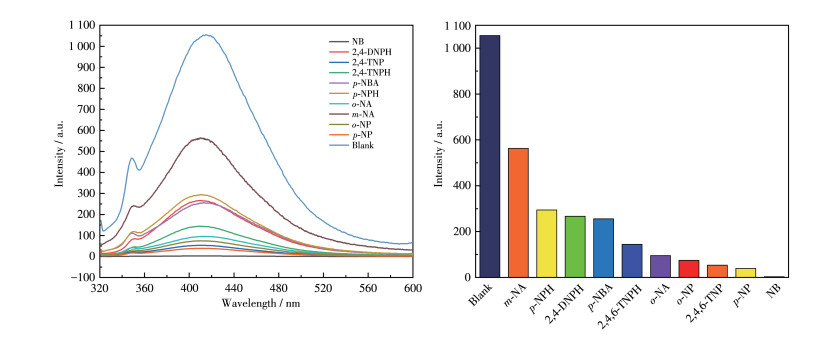
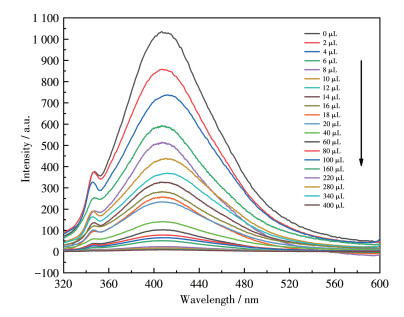
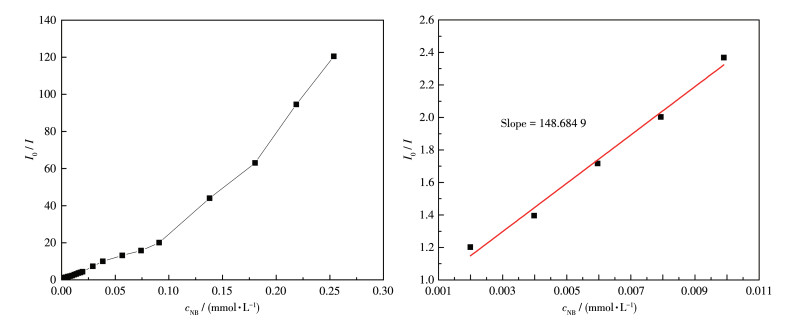
The luminescent responses of CPs 1 and 2 were investigated by treating suspensions (2 mg dispersed in 2 mL aqueous solution) with 50 μmol·L-1 different analytes such as p-nitrobenzoic acid (p-NBA), m-nitroani-line (m-NA), o-nitroaniline (o-NA), o-nitrophenol (o-NP), p-nitrophenol (p-NP), p-nitrophenylhydrazine (p-NPH), nitrobenzene (NB), 2, 4-dinitrophenylhydra-zine (2, 4-DNPH), 2,4,6-trinitrophenol (2,4,6-TNP), and 2,4,6-trinitrophenyl hydrazine (2,4,6-TNPH), respec-tively. Among these nitroaromatic compounds, NB almost quenched the luminescent intensity of 1 (Fig. 10). The result indicates that 1 may be regarded as a potential luminescent sensor for detecting NB. The luminescent intensities gradually decreased with the increasing concentration of NB. The best quenching efficiency observed for NB was calculated to be 99.17% upon incremental addition of 0-400 μL 1 mmol·L-1 NB solution (Fig. 11). To further analyze the luminescent titration results, the Stern-Volmer equa-tion: I0/I=1+KsvcNB was used to calculate the luminescence quenching constant, in which I0 and I are the luminescence intensities before and after the addition of NB, Ksv is the quenching constant (L·mol-1), and cNB is the concentration of NB (mmol·L-1), respectively[31-32]. At low concentrations, the Stern-Volmer curves displayed an almost linear relationship, and the linear equation was I0/I=0.851 58+148.684 9cNB. The Ksv for NB was calculated to be 1.49×10⁵ L·mol-1 (Fig. 12). The Stern-Volmer curve deviated from the linear correlation when the concentration increased, demonstrating the simultaneous involvement of both the static and dynamic quenching process. Further detailed analysis denoted that the LOD (limit of detection) was 0.197 μmol·L-1 according to 3σ/k (σ and k represent the standard error and slope, respectively)[33-34].
Figure 10
 Figure 10. Fluorescent spectra (left) and fluorescent intensities (right) of CP 1 dispersed in aqueous solutions of different nitroaromatic analytes
Figure 11
 Figure 11. Fluorescence response of CP 1 upon incremental addition of 1 mmol·L-1 NB in aqueous solutions
Figure 12
 Figure 12. Stern-Volmer plot of I0/I vs cNB in the aqueous dispersion of CP 1 (left); The area enlarged view for linearity of the plot at lower concentrations of NB (right)
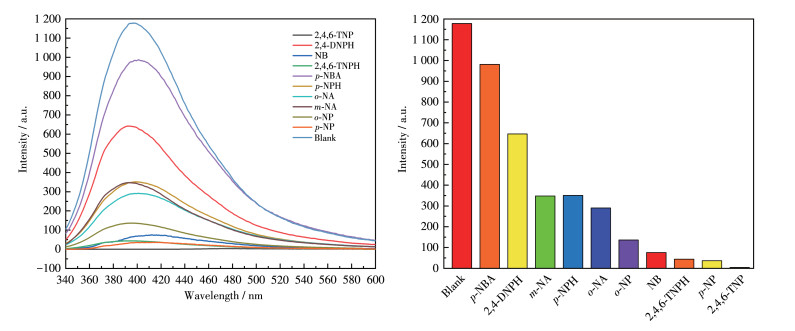
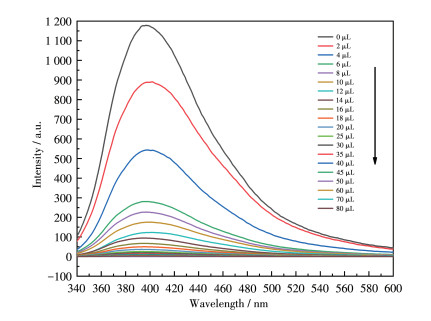
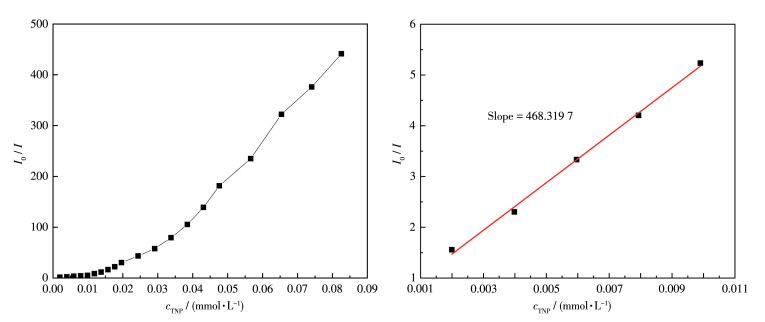
In the fluorescence titration, emission profiles of CP 2 showed selective and significant quenching for 2, 4, 6-TNP, and relatively low quenching was observed for other nitroaromatic analytes (Fig. 13). The best quenching efficiency observed for 2,4,6-TNP was calculated to be 99.76% upon incremental addition of 0-80 μL 1 mmol·L-1 2,4,6-TNP solution (Fig. 14). When the concentration of 2,4,6-TNP is as low as 0.074 mmol·L-1, the luminescent intensity of 2 is completely quenched by 2,4,6-TNP. As shown in Fig. 15, good linearity of the plot at low concentrations of 2,4,6-TNP was observed which fitted well with the Stern-Volmer equation (I0/I=0.536 92+468.319 7cTNP). High fluorescence quenching efficiency was proved by the high Stern-Volmer quenching constant (Ksv=4.68×10⁵ L·mol-1), and further detailed analysis denoted that the LOD was 0.062 6 μmol·L-1. However, a nonlinear curvature at higher concentrations of 2,4,6-TNP was obtained. The nonlinear nature of the Stern-Volmer plot of 2,4,6-TNP can be attributed to self-absorption, a combination of static and dynamic quenching, or an en-ergy-transfer process between 2,4,6-TNP and 2[35-36].
Figure 13
 Figure 13. Fluorescent spectra (left) and fluorescent intensities (right) of CP 2 dispersed in aqueous solutions of different nitroaromatic analytes
Figure 14
 Figure 14. Fluorescence response of CP 2 upon incremental addition of 1mmol·L-1 2,4,6-TNP in aqueous solutions
Figure 15
 Figure 15. Stern-Volmer plot of I0/I vs c2,4,6-TNP in the aqueous dispersion of CP 2 (left); The area enlarged view for linearity of the plot at lower concentrations of 2,4,6-TNP (right)
2.6 Detection of metal ions
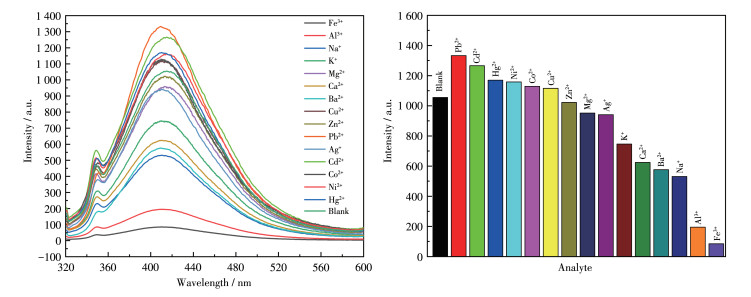
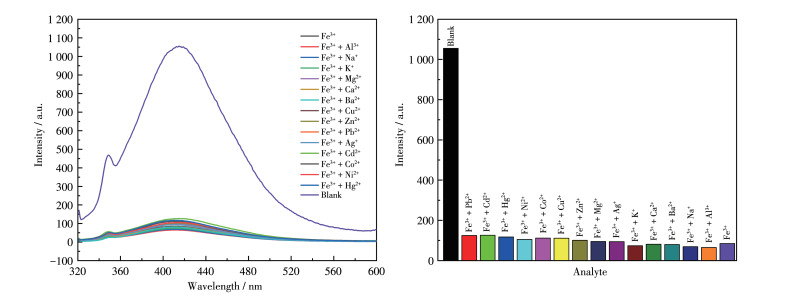
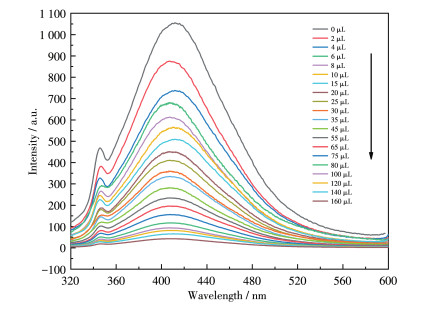
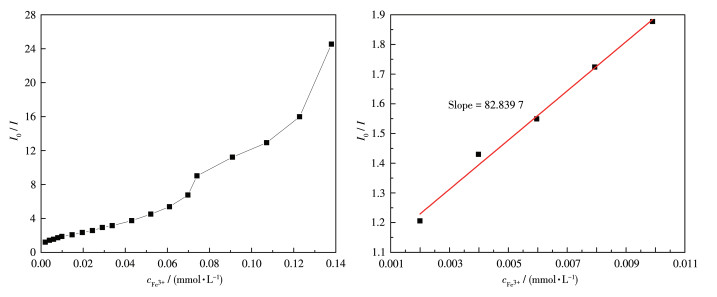
To examine the potential of CP 1 for sensing metal ions, changes in the fluorescence intensity of 1 dispersed in water on the addition of different metal ions, including Na+, K+, Mg2+, Ca2+, Ba2+, Al3+, Fe3+, Co2+, Ni2+, Cu2+, Zn2+, Cd2+, Ag+, Pb2+, and Hg2+ in aqueous solutions, were investigated (Fig. 16). Among these metal ions aqueous solutions, high fluorescence quenching of the luminescent intensity of 1 was observed in Fe3+ aqueous solution. To further study how the presence of non-Fe3+ metal cations affected the recognition of 1 to Fe3+ ions, all previously tested metal cations were analyzed again by adding to the solution of 1 containing Fe3+. The fluorescence spectra produced by these new mixtures are shown in Fig. 17. From these results, it can be seen that the emission intensity of 1 and Fe3+ was subject to fluctuation when in the presence of the testing cations. However, these fluctuations were deemed mostly minor concerning relative percent change, therefore, the conclusion shows that 1 still retains significant selectivity for the recognition of Fe3+ ions even in the matrix containing all cations tested[37]. The luminescent intensities gradually decreased with the increasing concentration of Fe3+, and the best quenching efficiency observed for Fe3+ was calculated to be 97.92% upon incremental addition of 0-160 μL 1 mmol·L-1 Fe3+ solution (Fig. 18). As shown in Fig. 19, good linearity of the plot at low concentrations of Fe3+ was observed which fitted well with the Stern-Volmer equation (I0/I=1.063 76+82.839 7cFe3+). High fluorescence quenching efficiency was proved by the high Stern-Volmer quenching constant (Ksv=8.28×10⁴ L·mol-1), and further detailed analysis denoted that the LOD was 0.354 μmol·L-1. However, a nonlinear curvature at higher concentrations of Fe3+ was obtained, revealing that both dynamic and static quenching take place.
Figure 16
 Figure 16. Fluorescent spectra (left) and fluorescent intensities (right) of CP 1 dispersed in aqueous solutions with various metal cations
Figure 17
 Figure 17. Fluorescent spectra (left) and fluorescent intensities (right) of CP 1 and Fe3+ in the presence of other cations
Figure 18
 Figure 18. Fluorescence response of CP 1 upon incremental addition of 1 mmol·L-1 Fe3+ in aqueous solutions
Figure 19
 Figure 19. Stern-Volmer plot of I0/I vs cFe3+ in the aqueous dispersion of CP 1 (left); The area enlarged view for linearity of the plot at lower concentrations of Fe3+ (right)
2.7 Detection of anions
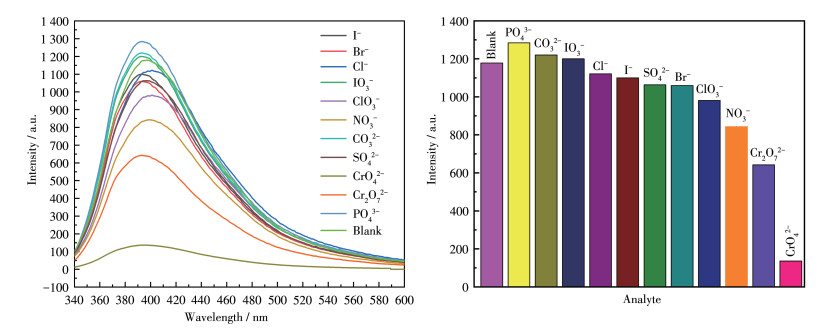
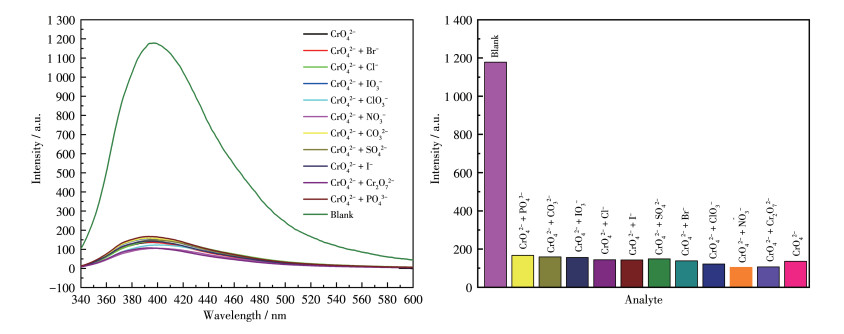
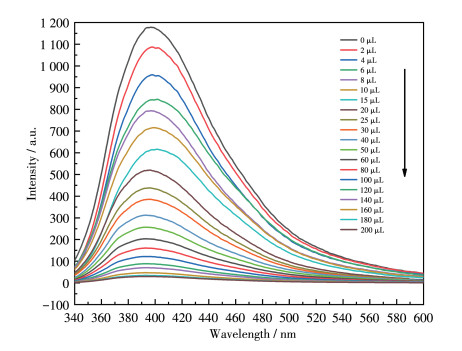
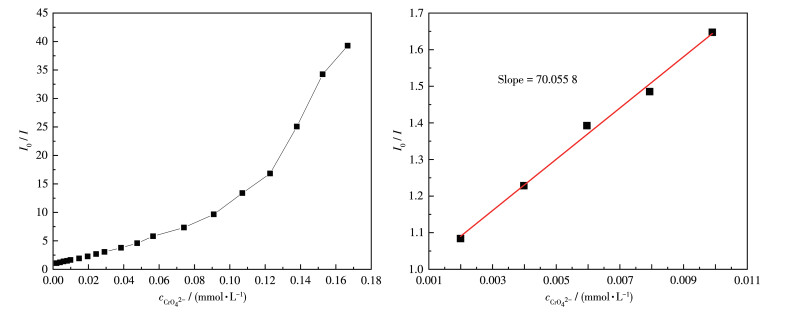
To examine the potential of CP 2 for sensing anions, changes in the fluorescence intensity of 2 dispersed in water on the addition of different anions, including I-, Br-, Cl-, IO3-, ClO3-, NO3-, CO32-, SO42-, CrO42-, Cr2O72-, and PO43- in aqueous solutions, were investigated (Fig. 20). Among these anions, high fluorescence quenching of the luminescent intensity of 2 was observed in CrO42- aqueous solution. To further study how the presence of non-CrO42- anions affects the recognition of 2 to CrO42- anions, all previously tested anions were analyzed again by adding to the CP 2 solu-tion containing CrO42-. The fluorescence spectra produced by these new mixtures are shown in Fig. 21. From these results, it can be seen that the emission intensity of 2 and CrO42- was subject to fluctuation when in the presence of the testing anions. However, these fluctuations were deemed mostly minor with respect to relative percent change, so the conclusion shows that 2 still retains significant selectivity for the recognition of CrO42- anions even in the matrix containing all anions tested. The luminescent intensities gradually decreased with the increasing concentration of CrO42-. The best quenching efficiency observed for CrO42- was calculated to be 97.45% upon incremental addition (0-200 μL) of 1 mmol·L-1 CrO42- solution (Fig. 22). As shown in Fig. 23, good linearity of the plot at low concentrations of CrO42- was observed which fitted well with the Stern-Volmer equation (I0/I= 0.950 28+70.055 8cCrO42-). High fluorescence quenching efficiency was proved by the high Stern-Volmer quenching constant (Ksv=7.01×10⁴ L·mol-1). Further detailed analysis denoted that the LOD was 0.418 μmol·L-1. A nonlinear curvature at higher concentrations of CrO42- was obtained, revealing both dynamic and static quenching take place.
Figure 20
 Figure 20. Fluorescent spectra (left) and fluorescent intensities (right) of CP 2 dispersed in aqueous solutions of different anions
Figure 21
 Figure 21. Fluorescent spectra (left) and fluorescent intensities (right) of CP 2 and CrO42- in the presence of other anions
Figure 22
 Figure 22. Fluorescence response of CP 2 upon incremental addition of 1 mmol·L-1 CrO42- in aqueous solutions
Figure 23
 Figure 23. Stern-Volmer plot of I0/I vs cCrO42- in the aqueous dispersion of CP 2 (left); The area enlarged view for linearity of the plot at lower concentrations of CrO42- (right)
3. Conclusions
In summary, two cadmium-based coordination polymers have been synthesized and characterized by the self-assembly of Cd(Ⅱ) salts with H3tatb and imidazolyl ligands. CPs 1 and 2 display the 2D layer structure, further these layers are joined by O—H⋯O hydrogen bonding to generate the interpenetrating 3D architecture. The fluorescent properties of CPs 1 and 2 have been investigated. CP 1 was highly selective and sensitive towards NB and Fe3+ through different detection mechanisms, while CP 2 was highly selective and sensitive towards 2,4,6-TNP and CrO 42- through different detection mechanisms. This work demonstrates the potential application of fluorescent CPs 1 and 2 as multi-responsive probes for the detection of nitroaromatic compounds and anions or cations in the aqueous phase.
Supporting information is available at http://www.wjhxxb.cn
-
-
[1]
Liang Z B, Qu C, Xia D G, Zou R Q, Xu Q. Atomically dispersed metal sites in MOF-based materials for electrocatalytic and photocatalytic energy conversion[J]. Angew. Chem. Int. Ed., 2018, 57: 9604-9633. doi: 10.1002/anie.201800269
-
[2]
Wu Y P, Zhou W, Zhao J, Dong W W, Lan Y Q, Li D S, Sun C H, Bu H. Surfactant-assisted phase-selective synthesis of new cobalt MOFs and their efficient electrocatalytic hydrogen evolution reaction[J]. Angew. Chem. Int. Ed., 2017, 56: 13001-13005. doi: 10.1002/anie.201707238
-
[3]
Yang X G, Ma L F, Yan D P. Facile synthesis of 1D organic-inorganic perovskite micro-belts with high water stability for sensing and photonic applications[J]. Chem. Sci., 2019, 10: 4567-4572. doi: 10.1039/C9SC00162J
-
[4]
Zhai Q G, Bu X H, Zhao X, Li D S, Feng P Y. Pore space partition in metal-organic frameworks[J]. Acc. Chem. Res., 2017, 50: 407-417. doi: 10.1021/acs.accounts.6b00526
-
[5]
Li Y, Mo Z W, Zhang X W, Zheng K, Zhou D D, Zhang J P. A metalligand layer compatible with various types of pillars for new porous coordination polymers[J]. Cryst. Growth Des., 2020, 20: 7021-7026. doi: 10.1021/acs.cgd.0c01078
-
[6]
Park J, Xu M, Li F Y, Zhou H C. 3D long-range triplet migration in a water-stable metal-organic framework for upconversion-based ultralowpower in vivo imaging[J]. J. Am. Chem. Soc., 2018, 140: 5493-5499. doi: 10.1021/jacs.8b01613
-
[7]
Chen L Y, Xu Q. Metal-organic framework composites for catalysis[J]. Matter, 2019, 1: 57-89. doi: 10.1016/j.matt.2019.05.018
-
[8]
Shi Z Z, Qin L, Zheng H G. A second-order nonlinear optical material with a 5-fold interpenetrating diamondoid framework based on two achiral precursors: Spontaneous resolution to absolute chiral induction[J]. Dalton Trans., 2017, 46: 4589-4594. doi: 10.1039/C7DT00614D
-
[9]
Wang J, Wu J, Lu L, Xu H J, Trivedi M, Kumar A, Liu J Q, Zheng M B. A new 3D 10-connected Cd(Ⅱ) based MOF with mixed ligands: A dual photoluminescent sensor for nitroaromatics (The original text is nitroaroamatics) and ferric ion[J]. Front. Chem., 2019, 7: 244. doi: 10.3389/fchem.2019.00244
-
[10]
Das A, Das S, Trivedi V, Biswas S. A dual functional MOF-based fluorescent sensor for intracellular phosphate and extracellular 4-nitrobenzaldehyde[J]. Dalton Trans., 2019, 48: 1332-1343. doi: 10.1039/C8DT03964J
-
[11]
Rachuri Y, Parmar B, Bisht K K, Suresh E. Mixed ligand two dimensional Cd(Ⅱ)/Ni(Ⅱ) metal organic frameworks containing dicarboxylate and tripodal N-donor ligands: Cd(Ⅱ) MOF is an efficient luminescent sensor for detection of picric acid in aqueous media[J]. Dalton Trans., 2016, 45: 7881-7892. doi: 10.1039/C6DT00753H
-
[12]
Sun Y, Zhang N, Guan Q L, Liu C H, Li B, Zhang K Y, Li G H, Xing Y H, Bai F Y, Sun L X. Sensing of Fe3+ and Cr2O72- in water and white light: Synthesis, characterization, and fluorescence properties of a crystalline bismuth-1, 3, 5-benzenetricarboxylic acid framework[J]. Cryst. Growth Des., 2019, 19: 7217-7229. doi: 10.1021/acs.cgd.9b01098
-
[13]
Zhao Y, Wang L, Fan N N, Han M L, Yang G P, Ma L F. Porous Zn(Ⅱ)-based metal-organic frameworks decorated with carboxylate groups exhibiting high gas adsorption and separation of organic dyes[J]. Cryst. Growth Des., 2018, 18: 7114-7121. doi: 10.1021/acs.cgd.8b01290
-
[14]
Qin J H, Huang Y D, Zhao Y, Yang X G, Li F F, Wang C, Ma L F. Highly dense packing of chromophoric linkers achievable in a pyrene-based metal-organic framework for photoelectric response[J]. Inorg. Chem., 2019, 58: 15013-15016. doi: 10.1021/acs.inorgchem.9b02203
-
[15]
Han W, Yan B. A flexible Tb(Ⅲ) functionalized cadmium metal organic framework as fluorescent probe for highly selectively sensing ions and organic small molecules[J]. Sens. Actuator B-Chem., 2016, 228: 702-708. doi: 10.1016/j.snb.2016.01.101
-
[16]
Cui Y J, Yue Y F, Qian G D, Chen B L. Luminescent functional metal-organic frameworks[J]. Chem. Rev., 2012, 112: 1126-1162. doi: 10.1021/cr200101d
-
[17]
Wang L B, Wang J J, Yue E L, Li J F, Tang L, Bai C, Wang X, Hou X Y, Zhang Y Q. Information encryption, highly sensitive detection of nitrobenzene, tetracycline based on a stable luminescent Cd-MOF[J]. Spectroc. Acta Pt. A-Molec. Biomolec. Spectr., 2022, 269: 120752. doi: 10.1016/j.saa.2021.120752
-
[18]
Rong J W, Zhang W W, Bai J F. Highly thermostable lanthanide(Ⅲ) MOFs constructed from 4, 4', 4''-s-triazine-2,4,6-triyl-tribenzoate ligand: Synthesis, structure, and tunable white-light emission[J]. CrystEngComm, 2016, 18: 7728-7736. doi: 10.1039/C6CE01585A
-
[19]
Liu C S, Zhang Z H, Chen M, Zhao H, Duan F H, Chen D M, Wang M H, Zhang S, Du M. Pore modulation of zirconium-organic frameworks for high-efficiency detection of trace proteins[J]. Chem. Commun., 2017, 53: 3941-3944. doi: 10.1039/C7CC00029D
-
[20]
Duan X, Lv R, Ji Z G, Li B, Cui Y J, Yang Y, Qian G D. Highly stable Y(Ⅲ)-based metal organic framework with two molecular building block for selective adsorption of C2H2 and CO 2 over CH 4[J]. Inorg. Chem. Front., 2018, 5: 1193-1198. doi: 10.1039/C8QI00083B
-
[21]
Tang L, Wang H H, Fu Y H, Wang Y T, Wang J J, Hou X Y. Three cobalt-based coordination polymers with tripodal carboxylate and imidazole-containing ligands: Syntheses, structures, properties and DFT studies[J]. RSC Adv., 2019, 9: 38902-38911. doi: 10.1039/C9RA07737E
-
[22]
Sheldrick G M. SADABS, A Program for Empirical Absorption Correction of Area Detector Data. University of Göttingen, Germany, 2008.
-
[23]
Sheldrick G M. SHELXS-2014/7, Program for Crystal Structure Solution. University of Göttingen, Germany, 2014.
-
[24]
Sheldrick G M. SHELXL-2014/7, Program for Crystal Structure Refinement. University of Göttingen, Germany, 2014.
-
[25]
Li Q Q, Zhang W Q, Ren C Y, Fan Y P, Li J L, Liu P, Wang Y Y. Reaction-determined assemblies of 0D to 3D complexes: Structural diversities and luminescence properties[J]. CrystEngComm, 2016, 18: 3358-3371. doi: 10.1039/C6CE00273K
-
[26]
Gong Y, Hao Z, Sun J L, Shi H F, Jiang P G, Lin J H. Metal(Ⅱ) complexes based on 1,4-bis(3-pyridylaminomethyl)benzene: Structures, photoluminescence and photocatalytic properties[J]. Dalton Trans., 2013, 42: 13241-13250. doi: 10.1039/c3dt51188j
-
[27]
Song S Y, Song X Z, Zhao S N, Qin C, Su S Q, Zhu M, Hao Z M, Zhang H J. Syntheses, structures and physical properties of transition metal-organic frameworks assembled from trigonal heterofunctional ligands[J]. Dalton Trans., 2012, 41: 10412-10421. doi: 10.1039/c2dt30826f
-
[28]
Zhang L L, Wang X B, Hu M. Crystal structures and photoluminescent properties of two d10 metal coordination polymers based on 5-aminodiacetic isophthalic acid[J]. Inorg. Chem. Commun., 2014, 45: 75-78. doi: 10.1016/j.inoche.2014.04.009
-
[29]
Yang X P, Wang S Q, Zhang L J, Huang S M, Li Z P, Wang C R, Zhu T, Bo L. First NIR luminescent polymeric high-nuclearity Cd-Ln nanoclusters from a long-chain Schiff base ligand[J]. J. Mater. Chem. C, 2016, 4: 1589-1593. doi: 10.1039/C5TC04103A
-
[30]
Wang D, Zhang D, Han S D, Pan J, Xue Z Z, Li J H, Wang G M. A pillared-layer strategy to construct water-stable Zn-organic frameworks for iodine capture and luminescence sensing of Fe3+[J]. Dalton Trans., 2019, 48: 602-608. doi: 10.1039/C8DT04091E
-
[31]
Wen G X, Han M L, Wu X Q, Wu Y P, Dong W W, Zhao J, Li D S, Ma L F. A multi-responsive luminescent sensor based on a superstable sandwich-type terbium(Ⅲ)-organic framework[J]. Dalton Trans., 2016, 45: 15492-15499. doi: 10.1039/C6DT03057B
-
[32]
Zhang Q S, Wang J, Kirillov A M, Dou W, Xu C, Xu C L, Yang L Z, Fang R, Liu W S. Multifunctional Ln-MOF luminescent probe for efficient sensing of Fe3+, Ce3+, and acetone[J]. ACS Appl. Mater. Interfaces, 2018, 10: 23976-23986. doi: 10.1021/acsami.8b06103
-
[33]
Ju P, Zhang E S, Jiang L, Zhang Z, Hou X Y, Zhang Y Q, Yang H, Wang J J. A novel microporous Tb-MOF fluorescent sensor for highly selective and sensitive detection of picric acid[J]. RSC Adv., 2018, 8: 21671-21678. doi: 10.1039/C8RA02602E
-
[34]
Hou B L, Tian D, Liu J, Dong L Z, Li S L, Li D S, Lan Y Q. A water-stable metal-organic framework for highly sensitive and selective sensing of Fe3+ ion[J]. Inorg. Chem., 2016, 55: 10580-10586. doi: 10.1021/acs.inorgchem.6b01809
-
[35]
Wu K, Hu J S, Shi S N, Li J X, Cheng X F. A Thermal stable pincer-MOF with highly (The original text is high) selective and sensitive nitro explosive TNP, metal ion Fe3+ and pH sensing in aqueous solution[J]. Dyes Pigment., 2020, 173: 107993. doi: 10.1016/j.dyepig.2019.107993
-
[36]
Zhou X H, Li L, Li H H, Li A, Yang T, Huang W. A flexible Eu(Ⅲ)-based metal -organic framework: Turn-off luminescent sensor for the detection of Fe(Ⅲ) and picric acid[J]. Dalton Trans., 2013, 42: 12403-12409. doi: 10.1039/c3dt51081f
-
[37]
Yang S L, Sun L, Song Z W, Xu L. Extraction and application of natural rutin from sophora japonica to prepare the novel fluorescent sensor for detection of copper ions[J]. Front. Bioeng. Biotechnol., 2021, 9: 642138. doi: 10.3389/fbioe.2021.642138
-
[1]
-
Figure 1 Coordination environment of Cd(Ⅱ) ion in CP 1
The free H2O molecules are omitted for clarity; Displacement ellipsoids are drawn at the 40% probability level; Symmetry codes: #1: x+1, y+1, z; #2: x+1, y, z+1
Figure 5 Coordination environment of Cd(Ⅱ) ion in CP 2
Hydrogen atoms are omitted for clarity except for the carboxyl group and coordination water; Displacement ellipsoids are drawn at the 40% probability level; Symmetry codes: #1: x, y+1, z; #2: x, y, z-1
Figure 10 Fluorescent spectra (left) and fluorescent intensities (right) of CP 1 dispersed in aqueous solutions of different nitroaromatic analytes
Figure 11 Fluorescence response of CP 1 upon incremental addition of 1 mmol·L-1 NB in aqueous solutions
Figure 12 Stern-Volmer plot of I0/I vs cNB in the aqueous dispersion of CP 1 (left); The area enlarged view for linearity of the plot at lower concentrations of NB (right)
Figure 13 Fluorescent spectra (left) and fluorescent intensities (right) of CP 2 dispersed in aqueous solutions of different nitroaromatic analytes
Figure 14 Fluorescence response of CP 2 upon incremental addition of 1mmol·L-1 2,4,6-TNP in aqueous solutions
Figure 15 Stern-Volmer plot of I0/I vs c2,4,6-TNP in the aqueous dispersion of CP 2 (left); The area enlarged view for linearity of the plot at lower concentrations of 2,4,6-TNP (right)
Figure 16 Fluorescent spectra (left) and fluorescent intensities (right) of CP 1 dispersed in aqueous solutions with various metal cations
Figure 17 Fluorescent spectra (left) and fluorescent intensities (right) of CP 1 and Fe3+ in the presence of other cations
Figure 18 Fluorescence response of CP 1 upon incremental addition of 1 mmol·L-1 Fe3+ in aqueous solutions
Figure 19 Stern-Volmer plot of I0/I vs cFe3+ in the aqueous dispersion of CP 1 (left); The area enlarged view for linearity of the plot at lower concentrations of Fe3+ (right)
Figure 20 Fluorescent spectra (left) and fluorescent intensities (right) of CP 2 dispersed in aqueous solutions of different anions
Figure 21 Fluorescent spectra (left) and fluorescent intensities (right) of CP 2 and CrO42- in the presence of other anions
Figure 22 Fluorescence response of CP 2 upon incremental addition of 1 mmol·L-1 CrO42- in aqueous solutions
Figure 23 Stern-Volmer plot of I0/I vs cCrO42- in the aqueous dispersion of CP 2 (left); The area enlarged view for linearity of the plot at lower concentrations of CrO42- (right)
Table 1. Crystal data and structural refinement summary of CPs 1 and 2
Parameter 1 2 Empirical formula C38H29CdN7O7 C39H32CdN8O8 Formula weight 808.08 853.12 Crystal system Triclinic Triclinic Space group P1 P1 a/nm 0.884 21(6) 0.852 66(17) b/nm 1.174 70(9) 1.306 8(2) c/nm 1.695 04(12) 1.761 1(3) α/(°) 90.573 0(10) 107.122(3) β/(°) 102.532 0(10) 93.698(3) γ/(°) 94.004 0(10) 90.617(3) V/nm3 1.713 9(2) 1.870 5(6) Dc/(g·m-3) 1.566 1.515 Z 2 2 μ/mm-1 0.700 0.649 θ range for data collection/(°) 2.366-25.000 2.395-25.000 Reflection collected, unique 8 649, 5 975 (Rint=0.014 0) 9 356, 6 533 (Rint=0.024 8) Data, restraint, number of parameters 5 975, 2, 487 6 533, 15, 515 Goodness-of-fit on F2 1.053 1.030 Final R indices[I > 2σ(I)] R1=0.029 3, wR2=0.074 1 R1=0.049 1, wR2=0.120 0 Largest difference in peak and hole/(e·m-3) 861 and -469 1 102 and -579  下载: 导出CSV
-


 扫一扫看文章
计量
- PDF下载量: 7
- 文章访问数: 2307
- HTML全文浏览量: 232
