Figure 1.
(a) XRD pattern of GSH capped CIZS QDs prepared under optimum experimental conditions;
(b) FT-IR spectra of GSH and GSH capped CIZS QDs

One-Pot Aqueous Synthesis and Cell Labeling Application of Glutathione Capped Cu-In-Zn-S Quantum Dots
Li-Ping ZHANG , Yong-Gang WAN , Yan-Min WU , Jie WANG , Dong-Bin XU , Jian-Lei XUE , Wen-Bo DUAN , Dao-Sen LIU


The research on photoluminescent semiconductor quantum dots (QDs) has received considerable attention owing to their potential applications as biological labels during the past two decades[1-2]. Relevant studies have been focused on QDs composed of Ⅱ-Ⅵ or Ⅳ-Ⅵ group elements, such as CdTe, PbSe and CdSe which have high quantum yields and relatively strong photoluminescence (PL) emission[3-5]. Unfortunately, the toxicity of Cd/Pb-based QDs limits their applications, especially in the biological field[6-7]. Although various protections employing ZnS, polymers, and other nontoxic shells have been developed, the leakage of Cd/Pb ions through the shell and the radicals derived from light irradiation could still be observed[8-9].
Therefore, heavy-metal-free QDs have been gaining increased attention[10-11]. For example, copper chalcogenide based QDs have recently been extensively investigated due to their low toxicity, including binary (e.g., Cu2-xS, Cu2-xSe) [12-13], ternary (e.g., CuInS2, CuInSe2 and AgInS2) [14-15] and quaternary (e.g., CuInZnS, CuSnZnS) QDs[15-16]. Furthermore, quaternary CIZS (Cu-In-Zn-S) QDs are developed based on the ternary CuInS2 QDs, which have the larger Stokes shift, high molar extinction coefficient and not highly toxic elements. But there are many limitations to the existing synthesis of CIZS QDs. Firstly, most reported quaternary CIZS QDs have been synthesized in complicated organometallic procedures with high reaction temperature and low efficiency[17-20]. Secondly, the as-prepared hydrophobic QDs in the organic phase are poor biocompatibility and high biotoxicity. The indispensable ligand exchange and surface modification can result in degradation of QDs photoluminescence performance. Therefore, it is necessary to develop a novel synthesis method to obtain hydrophilic and high-quality color-tunable CIZS QDs without any organometallic or toxic precursors, which hold enormous potential in biological analysis and optoelectronics applications.
To solve the above problem, we introduced a facile and green strategy for the hydrophilic synthesis of CIZS QDs by using a short reaction time and low reaction temperature (3 h, 120 ℃). Compared with previous reports, our strategy only utilized glutathione (GSH) as the stabilizer and capping ligand for CIZS QDs. GSH capped QDs were considered more biocompatible as compared to other thiol capping ligands[21-22]. The optimization of all experimental parameters including reaction time, pH value, and precursor concentration were carried out. As - prepared CIZS QDs were highly biocompatible and showed bright red fluorescence bioimaging of MDA-MB-231 cells.
CuCl2·2H2O (AR), InCl3·4H2O (98%), GSH (98%), thioacetamide (C2H5NS, ≥98.0%), and Zn(Ac)2· 2H 2O (99.0%) were purchased from Aladdin Inc. NaOH was purchased from Macklin Inc. Absolute ethanol and n - hexane were purchased from Sinopharm Chemical Reagent Co., Ltd.
CIZS QDs were synthesized in an aqueous solution via a hydrophilic synthesis method. In a typical experiment, CuCl2·2H2O (0.012 5 mmol), InCl3·4H2O (0.125 mmol) and Zn(Ac)2·2H2O (0.062 5 mmol) were dissolved in deionized water (15 mL), then GSH (0.875 mmol) was injected into the solution. The pH value of the solution was adjusted to 11 by adding 2.0 mol·L-1 NaOH solution with stirring. During this process, the solution changed from turbid to clear pink. In the meantime, C2H5NS (0.875 mmol) was dissolved in 1 mL deionized water. After ultrasonic treatment for 10 min, C2H5NS was rapidly injected into the prior mixed solution. All the above-mentioned experimental procedures were performed at room temperature. After vigorous stirring for 6 min, the solution was transferred into a 25 mL Teflon - lined stainless - steel autoclave. The autoclave was maintained at 120 ℃ for 4 h and then cooled down to room temperature by a natural cooling process. The obtained powder could be precipitated by absolute ethanol, and the precipitate was isolated by centrifugation, washed with absolute ethanol and n-hexane several times, then CIZS QDs were obtained.
The ability and facility of as-synthesized CIZS QDs for cellular imaging were evaluated by the fluorescence imaging of MDA-MB-231 cells. MDA-MB-231 cells were seeded in a 24-well plate at 37 ℃ for 24 h. The concentration of CIZS QDs solution for cellular imaging was 0.062 5 mg·mL-1. The cells were treated with the CIZS QDs solution for another 24 h, followed by being washed with phosphate buffered saline (PBS) three times. The fluorescence images were acquired by a fluorescent microscope (Olympus, IX71) under UV excitation with a peak at 340 nm.
X-ray diffraction (XRD) data were obtained on an X-ray diffractometer (D8, Bruker) operated at 40 kV and 180 mA with Cu Kα irradiation source (λ =0.154 nm) and 2θ range of 5° - 90°. Transmission electron microscope (TEM) images were recorded by transmission electron microscopy (H-7650, Hitachi) at 100 kV. FT-IR spectra were recorded in a range of 400-4 000 cm-1 on a Nicollet 380 spectrophotometer using a KBr pellet. UV-Vis absorption spectra were obtained using a Shimadzu UV-2550 spectrometer. Photoluminescence (PL) measurements were carried out at room temperature with a Shimadzu RF-5301PC spectrofluorometer.
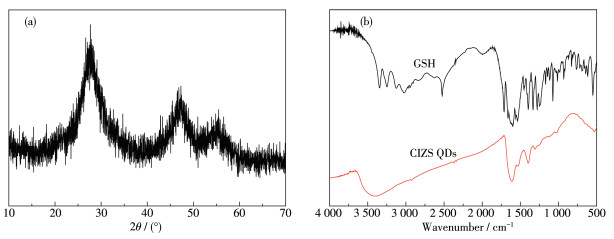
Fig. 1a shows the XRD pattern of GSH capped CIZS QDs. Three obvious diffraction peaks were located at 27.7°, 47.3°, and 55.5°, showing a slight shift toward higher angles compared with the (112), (204), and (312) planes of chalcopyrite CuInS2 (PDF No. 27 - 0159) due to the decrease of the lattice constant. This is related to the incorporation of the Zn2+ with a smaller radius into the crystal lattice, indicating the formation of Cu-In-Zn-S alloyed structure[23]. The broad diffraction peaks of CZIS are due to the small size of QDs.
Fig. 1b shows the FT-IR spectra of GSH and GSH capped CIZS QDs synthesized at 120 ℃ for 4 h with the nCu∶nIn of 1∶10. The peaks at 3 022, 3 249, 3 346, and 3 126 cm-1 of GSH are attributed to the N—H and C—O stretching vibration. The disappearance of two peaks at 1 536 and 2 525 cm-1, ascribed to the —NHR deformation vibration and —SH stretching vibration, indicates that GSH is combined into the surface of CIZS QDs. Moreover, the peaks of anti-symmetric stretching vibration of the —COO- group were shifted from 1 599 to 1 613 cm-1. These results demonstrate that CIZS QDs are also functionalized with the —COO-group of GSH. Therefore, CIZS QDs coordinated with GSH could well passivate surface defects, resulting in the effective improvement of fluorescence property.
Fig. 2a shows the TEM images of GSH capped CIZS QDs prepared under optimum experimental conditions. It was obvious that CIZS QDs were nearspherical shape and well - dispersed. Fig. 2b displays the size distribution histograms of CIZS QDs obtained from the TEM images, and the mean particle size was 2.55 nm. The inset in Fig. 2a shows the photos of CIZS QDs, from which it could be seen that CIZS QDs emitted strong orange fluorescence under the irradiation of 365 nm UV lamp and were yellow under daylight irradiation.
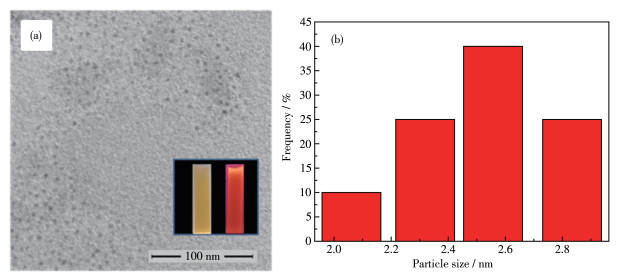
Inset: photos of CIZS QDs under daylight irradiation (left) or the irradiation of 365 nm UV lamp (right)
To study the effect of reaction time on the formation of GSH capped CIZS QDs, the corresponding precursors were heated at 120 ℃ at different times. Fig. 3 shows typical absorption spectra and PL spectra of CIZS QDs prepared with different reaction times. The absorption spectra of temporal evolution showed that there were no changes in absorption onset, which indicates that CIZS QDs have already formed in 3 h (Fig. 3a). On the contrary, the PL intensity of CIZS QDs was enhanced with increasing the reaction time, and reached to the maximum with a reaction time of 4 h, followed by decreasing gradually (Fig. 3b). It should be noted that there was almost no shift for wavelength peak of CIZS QDs obtained under different reaction times, which further demonstrates that the formation of CIZS QDs have already been completed in 3 h, staying in consistent with the absorption spectra and indicating that the extension of the reaction time does not enlarge the particle size. The increase of PL intensity may be attributed to better passivation of surface defects by the ligands, while the decrease could be explained by hydrolysis of the thiols, thus resulting in inadequate ligands to stabilize the system and to passivate the surface of CIZS QDs. On the other hand, the structureless absorption spectra were observed, which are the typical indicative features of quaternary compounds, caused by the synergetic effect of the wide size distribution and the irregular composition distribution among different CIZS QDs. Such phenomena give a clear indication that the PL emission is assigned to the radiative recombination of the intrinsic defect - related states (donoracceptor pairs) instead of band edge emission.
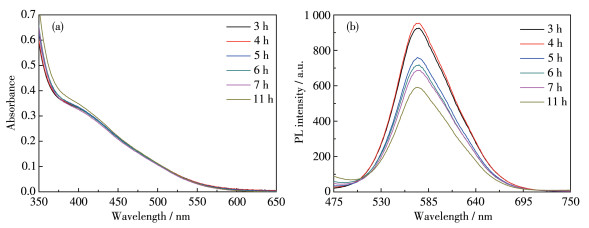
Fig. 4a shows the PL spectra of GSH capped CIZS QDs prepared under different pH values. It could be obviously observed that the PL spectra displayed a trend of the first ascent and then descent with increasing the pH value, and that the maximum PL intensity was obtained when the pH value was 11. Such maximum might be ascribed to stronger binding forces between GSH and the cations at this pH value. On the other hand, the emission peak shifted from 596 to 560 nm with increasing the pH value. It might be ascribed to the decrease of the size of CIZS QDs with the increase of pH value. The quantum size effect is more obvious.
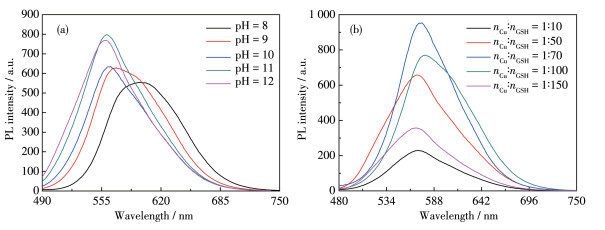
The addition of GSH to the reaction system plays an important role in the synthesis of CIZS QDs. The effect of GSH of reaction solution on the PL spectra was evaluated as displayed in Fig. 4b. It could be observed that the PL spectra displayed a trend of the first ascent and then descent with increasing GSH content, and that the maximum PL intensity was obtained when the nCu∶nGSH was 1∶70. According to the previous report, there should be enough GSH in the system for passivating the nanoparticle surface and stabilizing CIZS QDs. However, excess ligand might distort the surface, thus originating new nonradiative defects, which possibly accounts for the tendency in the experiments.
Fig. 5 shows the PL spectra of GSH capped CIZS QDs prepared under different molar ratios of nCu∶nIn. The PL intensity gradually increased and then decreased with the nCu∶nIn varying from 1∶4 to 1∶16, reaching a maximum value at nCu∶nIn=1∶10. Based on the previous research of defect states, the Cu—S bonds are much weaker than In—S bonds, causing Cu vacancies and In substitutions preferentially occurred[24]. In this case, S vacancies and substitutional in sites act as donors, in contrast, Cu vacancies act as acceptors. With the decrease of nCu∶ nIn, the number of Cu vacancies increased gradually, which was beneficial to the enhancement of the recombination rate of CIZS QDs, so the PL intensity increased gradually. In addition, as the nCu∶nIn continued to decrease, the concentration of donor substitutional In and acceptor Cu vacancies in CIZS QDs decreased when Cu+ concentration was below the critical value, which led to the decrease of fluorescence intensity.
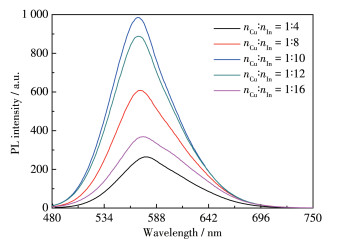
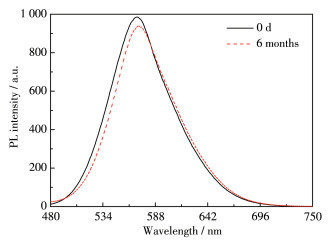
Fig. 6 shows the stability of CIZS QDs prepared at 120 ℃ for 4 h with the nCu∶nIn being 1: 10. The PL intensity of CIZS QDs still had relatively high brightness (maintained 95% of the initial PL intensity) after 6 months, which is crucial for long - term storage and biological applications such as in vivo visualization and tracking.
The in vitro cytotoxicity of CIZS QDs against HUVEC cells following 24 and 48 h was investigated. The cytotoxicity was evaluated via MTT assay by incubating HUVEC cells with different concentrations of CIZS QDs, respectively. The MTT results in Fig. 7 indicated that CIZS QDs showed little cytotoxicity against HUVEC cells even at CIZS QDs concentration up to 0.25 mg·L-1, confirming good biocompatibility of CIZS QDs towards HUVEC cells and emphasizing its potential applications in bioimaging.
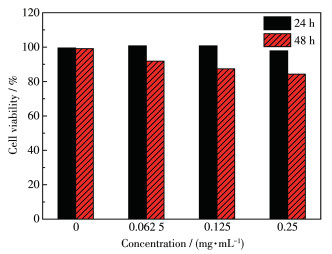
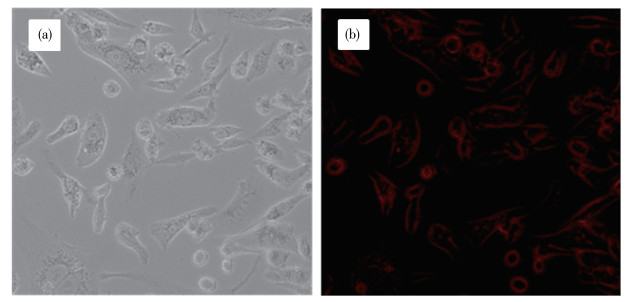
Fig. 8 shows differential interference contrast (DIC) picture and fluorescent image of MDA-MB-231 cells incubated with GSH capped CIZS QDs. As shown in Fig. 8b, the red emission of CIZS QDs from the cells was clearly observed under fluorescence microscopy, which suggests that GSH capped CIZS QDs can successfully enter into MDA-MB-231 cells. This phenomenon shows that the QDs can perform as biomarkers for cancer cell fluorescence imaging. Compared with QDs containing cadmium, the toxicity of CIZS QDs is much less and therefore has more advantages for future clinical applications.
In summary, we utilized a one-pot method to directly synthesize highly luminescent CIZS QDs in aqueous media by using bio-compatible GSH as a capping ligand and stabilizer. By changing the reaction time, the pH value, and the molar ratios of initial precursors, the influences of experimental variables on the optical properties of CIZS QDs were evaluated. The optimum experimental conditions were as follows: the molar ratio of nCu∶nIn∶nZn∶nS∶nGSH was 1∶10∶5∶70∶70 with reaction time of 4 h and pH value of 11, respectively. Compared with the traditional synthetic method in an organic solvent, this method is green, simple, and low cost. As-prepared GSH capped CIZS QDs showed extremely water solubility and photostability. Due to their unique and stable optical properties, GSH capped CIZS QDs can be used in the field of biomedicine as a novel type of fluorescent nanoprobe.
Alivisatos A P. Semiconductor Clusters, Nanocrystals, and Quantum Dots[J]. Science, 1996, 271: 933-937. doi: 10.1126/science.271.5251.933
Peng X G, Manna L, Yang W D, Wickham J, Scher E, Kadavanich A, Alivisatos A P. Shape Control of CdSe Nanocrystals[J]. Nature, 2000, 404: 59-61. doi: 10.1038/35003535
Xi L L, Ma H B, Tao G H. Thiourea Functionalized CdSe/CdS Quantum Dots as a Fluorescent Sensor for Mercury Ion Detection[J]. Chin. Chem. Lett., 2016, 27(9): 1531-1536. doi: 10.1016/j.cclet.2016.03.002
Kim D, Kim D H, Lee J H, Grossman J C. Impact of Stoichiometry on the Electronic Structure of PbS Quantum Dots[J]. Phys. Rev. Lett., 2013, 110: 196802. doi: 10.1103/PhysRevLett.110.196802
Wang G F, Guan A X, Zhou C Y, Xia S Y, Chen Q, Chen X T, Zhou L Y. Luminescence Properties of CdTe QDs Embedded in Zn5(CO3)2(OH)6 Matrix[J]. Chin. Chem. Lett., 2016, 27(12): 1788-1792. doi: 10.1016/j.cclet.2016.07.012
Derfus A M, Chan W C W, Bhatia S N. Probing the Cytotoxicity of Semiconductor Quantum Dots[J]. Nano Lett., 2004, 4(1): 11-18. doi: 10.1021/nl0347334
Lai L, Jin J C, Xu Z Q, Ge Y S, Jiang F L, Liu Y. Spectroscopic and Microscopic Studies on the Mechanism of Mitochondrial Toxicity Induced by CdTe QDs Modified with Different Ligands[J]. J. Membr. Biol., 2015, 248(4): 727-740. doi: 10.1007/s00232-015-9785-x
Zhang L J, Yu H F, Cao W, Zou C, Dong Y Q, Zhu D M, Huang S M. Enhanced Electrical and Optoelectrical Properties of Cadmium Selenide Nanobelts by Chlorine Doping[J]. Micro Nano Lett., 2014, 9(1): 55-59. doi: 10.1049/mnl.2013.0611
Lan Y W, Yang K, Wang Y L, Li H M. Aqueous Synthesis of Highly Luminescent CdSe Quantum Dots with Narrow Spectra Using Hydrazine Hydrate Reduction Selenium[J]. Micro Nano Lett., 2014, 9(3): 202-205. doi: 10.1049/mnl.2013.0608
Deng D W, Qu L Z, Zhang J, Ma Y X, Gu Y Q. Quaternary Zn-Ag-In-Se Quantum Dots for Biomedical Optical Imaging of RGD-Modified Micelles[J]. ACS Appl. Mater. Interfaces, 2013, 5(21): 10858-10865. doi: 10.1021/am403050s
Kong W G, Zhang B P, Li R F, Wu F F, XuT N, Wu H Z. Plasmon Enhanced Fluorescence from Quaternary Cu-In-Zn-S Quantum Dots[J]. Appl. Surf. Sci., 2015, 327(1): 394-399.
Wang Y, Hu Y X, Zhang Q, Ge J P, Lu Z D, Hou Y B, Yin Y D. One-Pot Synthesis and Optical Property of Copper Sulfide Nanodisks[J]. Inorg. Chem., 2010, 49(14): 6601-6608. doi: 10.1021/ic100473e
Saldanha P L, Brescia R, Prato M, Li H B, Povia M, Manna L, Lesnyak V. Generalized One-Pot Synthesis of Copper Sulfide, Selenide-Sulfide, and Telluride-Sulfide Nanoparticles[J]. Chem. Mater., 2014, 26(3): 1442-1449. doi: 10.1021/cm4035598
Torimoto T, Adachi T, Okazaki K I, Sakuraoka M, Shibayama T, Ohtani B, Kudo A, Kuwabata S. Facile Synthesis of ZnS-AgInS2 Solid Solution Nanoparticles for a Color-Adjustable Luminophore[J]. J. Am. Chem. Soc., 2007, 129(41): 12388-12389. doi: 10.1021/ja0750470
Aldakov D, Lefrancois A, Reiss P. Ternary and Quaternary Metal Chalcogenide Nanocrystals: Synthesis, Properties and Applications[J]. J. Mater. Chem. C, 2013, 1(24): 3756-3776. doi: 10.1039/c3tc30273c
Yarema O, Bozyigit D, Rousseau I, Nowack L, Yarema M, Heiss W, Wood V. Highly Luminescent, Size - and Shape-Tunable Copper Indium Selenide Based Colloidal Nanocrystals[J]. Chem. Mater., 2013, 25(18): 3753-3757. doi: 10.1021/cm402306q
Xiang W D, Ma X, Luo L, Cai W, Xie C P, Liang X J. Facile Synthesis and Characterization of Core/Shell Cu-In-Zn-S/ZnS Nanocrystals with High Luminescence[J]. Mater. Chem. Phys., 2015, 149-150: 437-444. doi: 10.1016/j.matchemphys.2014.10.042
Nakamura H, Kato W, Uehara M, Nose K, Omata T, Matsuo S O Y, Miyazaki M, Maeda H. Tunable Photoluminescence Wavelength of Chalcopyrite CuInS2-Based Semiconductor Nanocrystals Synthesized in a Colloidal System[J]. Chem. Mater., 2006, 18(14): 3330-3335. doi: 10.1021/cm0518022
Liu W Y, Zhang Y, Zhai W W, Wang Y H, Zhang T Q, Gu P F, Chu H R, Zhang H Z, Cui T, Wang Y D, Zhao J, Yu W W. Temperature-Dependent Photoluminescence of ZnCuInS/ZnSe/ZnS Quantum Dots[J]. J. Phys. Chem. C, 2013, 117(38): 19288-19294.
Zhang W J, Zhong X H. Facile Synthesis of ZnS-CuInS2-Alloyed Nanocrystals for a Color-Tunable Fluorchrome and Photocatalyst[J]. Inorg. Chem., 2011, 50(9): 4065-4072. doi: 10.1021/ic102559e
Ding L, Zhou P J, Zhan H J, Chen C, Hu W, Zhou T F, Lin C W. Microwave-Assisted Synthesis of L-Glutathione capped ZnSe QDs and Its Interaction with BSA by Spectroscopy[J]. J. Lumin., 2013, 142: 167-172. doi: 10.1016/j.jlumin.2013.04.008
Zheng Y, Gao S, Ying J Y. Synthesis and Cell-Imaging Applications of Glutathione-Capped CdTe Quantum Dots[J]. Adv. Mater., 2007, 19(3): 376-380. doi: 10.1002/adma.200600342
Leng Z S, Huang L, Shao F, Lv Z C, Li T T, Gu X X, Han H Y. Facile Synthesis of Cu-In-Zn-S Alloyed Nanocrystals with Temperature-Dependent Photoluminescence Spectra[J]. Mater. Lett., 2014, 119: 100-103. doi: 10.1016/j.matlet.2013.12.109
Mao W Y, Guo J, Yang W L, Wang C C, He J, Chen J Y. Synthesis of High-Quality Near-Infrared-Emitting CdTeS Alloyed Quantum Dots via the Hydrothermal Method[J]. Nanotechnology, 2007, 18(48): 485611. doi: 10.1088/0957-4484/18/48/485611

Figure 1 (a) XRD pattern of GSH capped CIZS QDs prepared under optimum experimental conditions; (b) FT-IR spectra of GSH and GSH capped CIZS QDs

Figure 2 TEM image (a) and size distribution (b) of GSH capped CIZS QDs prepared under optimum experimental conditions
Inset: photos of CIZS QDs under daylight irradiation (left) or the irradiation of 365 nm UV lamp (right)

Figure 3 Absorption spectra (a) and PL spectra (b) of GSH capped CIZS QDs prepared with different reaction times

Figure 4 PL spectra of GSH capped CIZS QDs prepared under different pH values (a) and with different molar ratios of nCu∶nGSH (b)

Figure 5 PL spectra of GSH capped CIZS QDs prepared with different molar ratios of nCu∶nIn

Figure 7 Cell viabilities of HUVEC cells incubated with different concentrations of CIZS QDs

 扫一扫看文章


扫一扫关注我们
 下载:
下载:
 下载:
下载:

