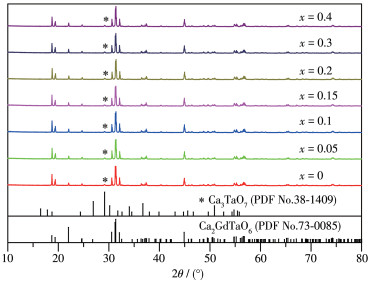
Figure 1.
XRD patterns of CGTO∶xTb3+

Lanthanide doped phosphors have attracted great attention for its high feasibility applications in lighting and display systems[1-5]. Green phosphors are of capital importance in solid-state lighting for white light sources, and most of green luminescent materials are Tb3+ activated phosphors because of its predominant 5D4-7F5 transition[6-8]. Tb3+ shows a strong UV excitation characteristic due to its spin-allowed 4f-5d transition, and an intense visible emission can be achieved in an appropriate host lattice upon the UV excitation[9-10]. Therefore, Tb3+ doped phosphors are widely used in fluorescent lamps[6-10].
Recently, double perovskite oxides (A2BB′O6) have been widely used as host materials because of their advanced luminescence and thermal stability[11]. In a typical structure with double perovskite, B site coordinated by six oxygen atoms is occupied by orderly arranged B and B′. A site possesses various coordination numbers (8~12) depending on the distortion degree of the crystal structure[12-14]. Therefore, the local crystal environment, which is critical for luminescence, can be modulated by changing composition elements. Recently, many M3+ activated (M3+=rare earth element ion) phosphors with double perovskite have been investigated owing to their good luminescence properties, such as Sr2LaSbO6∶Eu3+[12], La2MgTiO6∶Eu3+[13], CaLaMgSbO6∶Eu3+[14], Ca2GdTaO6∶Eu3+[15], Ca2YTaO6∶ Dy3+[16], Ca2LaTaO6∶Tb3+ and Ba2LaTaO6∶Tb3+[17]. Ca2GdTaO6 belongs to the A2BB′O6 structure with double perovskite, which has the monoclinic crystal structure[15, 18-19]. In Ca2GdTaO6 lattice, Ca2+ occupies the A site, while Gd3+ and Ta5+ situate respectively at the B and B′ sites. And Gd3+ and Ta5+ ions occupied the octahedral sites by sharing one oxygen atom, Ca2+ ions were situated in the center of the alternation between octahedrons[18-19].
Herein, we report the preparation of double perovskite-type Ca2Gd1-xTaO6∶xTb3+(CGTO∶xTb3+) phosphors by a high temperature solid state reaction method. The luminescence properties of CGTO∶xTb3+ phosphors were investigated by changing doping concentration of Tb3+ ions in the host. Our results show that CGTO∶xTb3+ has good properties as a green phosphor for lighting and display application.
The samples of CGTO∶xTb3+(x=0, 0.05, 0.1, 0.15, 0.2, 0.3 and 0.4) were synthesized using a hightemperature solid -state method. Stoichiometric quantities of CaCO3 (99.9%), Tb 4O7(99.99%), Gd2O3 (99.99%) and Ta2O5 (99.99%) used as the starting materials were finely ground in an agate mortar and transferred into the alumina crucibles to be calcined at 1 500 ℃ for 6 h. Then, the samples were cooled down to room temperature and reground for further measurements.
The phase purity of the samples was checked by powder X-ray diffraction (XRD) performed on a Panalytical X′ Pert diffractometer with Cu Kα1 radiation (λ=0.154 187 nm) operating at 40 kV and 40 mA in 2θ range of 10°~80°. The morphology and particle size of CGTO∶0.15Tb3+ were characterized by a field emission scanning electron microscope (FE-SEM, Tescan Orsay Holding, MIRA3 LMH) equipped with the energy dispersive spectra (EDS, Thermo Scientific, UltraDry) operated at 20 kV. Photoluminescence luminescence (PL), photoluminescence excitation (PLE), and decay curves were measured on a spectrophotometer (FLS980) equipped with both a xenon lamp (450 W) and a pulse xenon lamp (450 W) as the lighting source.
Fig.1 shows the XRD patterns of CGTO∶xTb3+(x= 0, 0.05, 0.1, 0.15, 0.2, 0.3 and 0.4). It could be seen that all the diffraction peaks of the samples were identified to the standard card of Ca2GdTaO6 (PDF No. 73 0085) except for a relatively weak peak at 2θ =28.5° marked with the symbol (*). This impurity peak can be attributed to Gd3TaO7 (PDF No. 38-1409) impurity phase. The Tb3+ ions are proposed to occupy the Gd3+ sites because the effective radius of Tb3+ ions (0.092 3 nm for CN=6) is very close to that of Gd3+ ions (0.093 8 nm for CN=6) (CN=coordination number)[20].
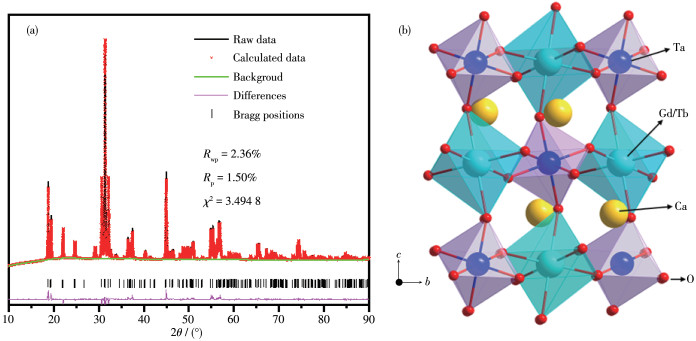
Rietveld refinement analysis was further performed from the powder XRD data using the General Structure Analysis System (GSAS) program. Fig. 2a shows the fitted Rietveld refinement data and the difference between the calculated and experimental data of the typical CGTO∶0.15Tb3+ phosphor. The detailed refinement results for CGTO∶0.15Tb3+ phosphor are listed in Table 1. The smaller residual parameters (Rwp=2.36% and Rp=1.5%) and goodness of fit (χ2=3.494 8) for all the fitting data, together with the tiny fluctuation in the difference curves shown in Fig.2, indicate high reliability of the refinement results. The schematic of CGTO crystal structure is shown in Fig.2b. Gd3+ ions occupy B sites with six-folded coordination.
 下载:
导出CSV
下载:
导出CSV
| Formula | Ca2(Gd0.85Tb0.15)TaO6 |
| Crystal system | Monoclinic |
| Space group | P21/n |
| a/nm | 0.557 516(4) |
| b/nm | 0.584 742(5) |
| c/nm | 0.808 356(6) |
| β/(°) | 90.306 1(2) |
| Volume/nm3 | 0.263 523 |
| Rwp/% | 2.36 |
| Rp/% | 1.50 |
| χ2 | 3.494 8 |
Fig. 3a and 3b show SEM images of CGTO∶ 0.15Tb3+ phosphor. The morphology of the sample was ovaloid-like and the particle size was 2~3 μm. In addition, Fig. 3c~3g show the distribution of each element of one phosphor particle. The results indicate that Ca, Gd, Ta, O and Tb are evenly distributed. The EDS was used to further characterize the chemical composition of the as prepared product, and the result of CGTO∶ 0.15Tb3+ phosphor shown in Fig.3h was 39∶17∶3∶19 of nCa∶nGd∶nTb∶nTa, which was close to the chemical formula of CGTO∶0.15Tb3+. The results confirm that Tb3+ ions have been effectively incorporated into the CGTO host lattice, consisting with the XRD analysis above.
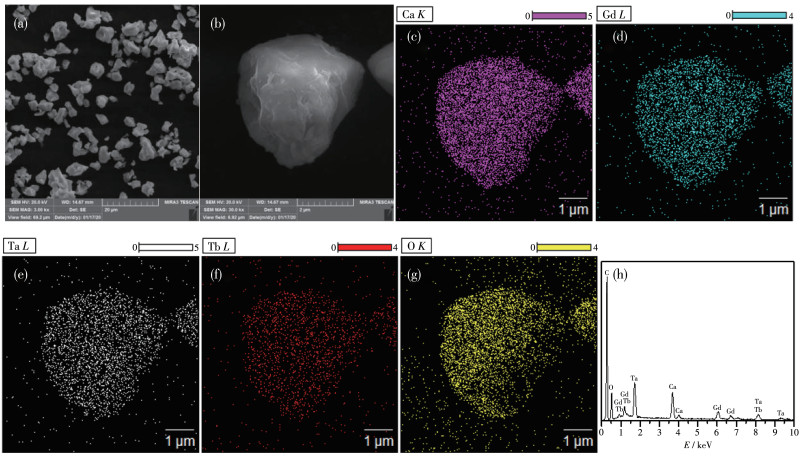
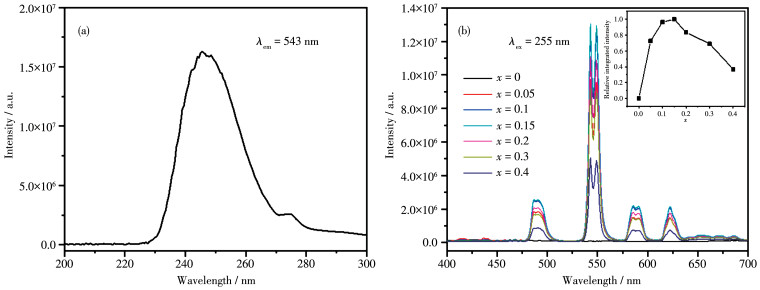
Fig.4a shows the PLE spectrum of CGTO∶0.15Tb3+ at room temperature. The PLE spectrum of CGTO: 0.15Tb3+, which monitored the PL peak at 543 nm, exhibited an intense peak at 255 nm assigned to the allowed 4f-5d transition of Tb3+. The PL spectra of CGTO∶xTb3+ samples under UV (255 nm) excitation are shown in Fig.4b. The Tb3+ luminescence was composed of two series of emission peak at 400~470 nm and 470~700 nm (Fig.4b), which are attributed to Tb3+ ions transitions from 5D3-7FJ (J=5, 4, 3) and 5D4-7FJ(J= 6, 5, 4, 3), respectively[21]. Owing to the obvious concentration quenching of the Tb3+ luminescence at 5D3-7FJ(J =5, 4, 3) transitions, the emission at 400~470 nm region was very weak[21]. Where blue and green as well as red emission centered at 490, 543, 588 and 623 nm are attributed to the 5D4-7FJ(J=6, 5, 4, 3) transitions of Tb3+, respectively[22]. As shown in the inset of Fig. 4b, the relative integrated intensity of the dominant emission from 5D4-7F5 transition increased with the increasement of the Tb3+-concentration, reaching maximum at x =0.15 Tb3+ doping, and then decreased with the further increasing Tb3+ concentration.
The CIE chromaticity coordinates for the emission of CGTO∶0.15Tb3+ under 255 nm excitation is shown in Fig. 5, and the inset at the top right corner is luminescence image of CGTO∶0.15Tb3+ irradiated by 254 nm UV lamp. The color coordinates (x, y) of CGTO∶ 0.15Tb3+ phosphor was calculated as (0.348 6, 0.562 0). The CIE coordinates belong to green region. The corresponding color temperature can be calculated using the following formula[23]:
|
|
(1) |
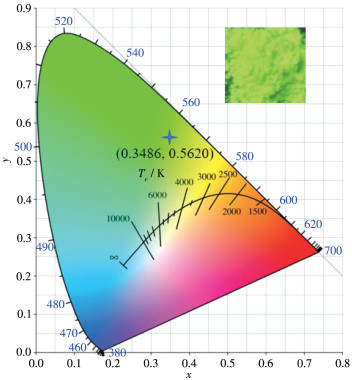
where n=(x-0.332)/(y-0.185 8). The color temperature of CGTO∶0.15Tb3+ phosphor was 5 219 K.
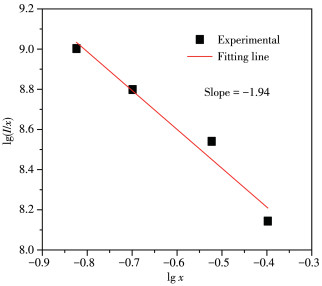
To investigate the luminescence concentration quenching, the critical distance (Rc) between two Tb3+ ions in CGTO∶xTb3+crystalline can be estimated by the formula[24]: Rc=2[3V/(4πNxc)]1/3 (2), where V is the volume of the unit cell, xc is the critical concentration and N is the number of available crystallographic sites occupied by the activator ions in the unit cell. The Rietveld refinement analysis values of V and N for CGTO∶0.15Tb3+ crystalline were 0.263 523 nm3 and 2, respectively. The critical distance of two Tb3+ ions in CGTO∶x Tb3+ was 1.188 1 nm. It is known that the nonradiative energy transfer mechanism consists of exchange interaction and electric multipolar interaction. The exchange interaction comes into effect only when the typical critical distance between the activators is shorter than 0.5 nm. Here, the critical distance is much longer than 0.5 nm, so the concentration quenching is dominated by the multipole-multipole interaction in CGTO∶xTb3+. According to Dexter theory, the type of electric multipolar interaction among Tb3+ ions can be deduced by the following equation[25]:
|
|
(3) |
where K and β are constants; x is the activator Tb3+ concentration; I is the dominant emission intensity from 5D4-7F5 transition of CGTO∶xTb3+ phosphors; θ equals 6, 8 or 10 corresponding to dipole dipole, dipole quadrupole or quadrupole-quadrupole interaction, respectively. Fig.6 demonstrated that the relationship between lg(I/x) and lg x was approximately linear, and the slope was around -1.94, which meant that θ was about 6.0. The result indicates that the mechanism of concentration quenching for Tb3+ luminescence centers is the dipoledipole interaction in the CGTO∶xTb3+ host lattice.
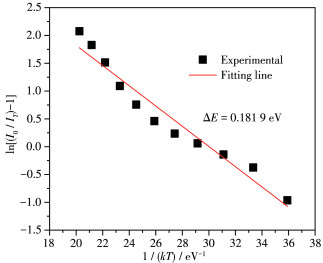
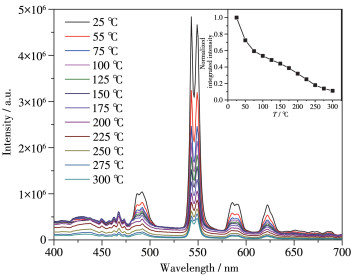
Thermal stability is an important parameter of a phosphor. In order to investigate the thermal stability of CGTO∶0.15Tb3+ phosphor, we measured PL spectra of CGTO∶0.15Tb3+ phosphor with UV excitation 255 nm at different temperatures (25~300 ℃), as shown in Fig. 7. The PL intensity of CGTO∶0.15Tb3+ phosphor decreased along with the temperature increasing, which is due to thermal quenching. In the process of thermal quenching, the activation energy (ΔE) can be determined by the following Arrhenius equation[26]: IT= I0/{1+cexp[-ΔE/(kT)]}(4), where I0 and IT stand for the initial emission intensity and the luminescence intensity of the dominant emission from 5D4-7F5 transition at temperature T, respectively; c is a constant for a designated host and k is the Boltzmann constant (8.617×10⁻⁵ eV·K-1). The activation energy (ΔE) can be calculated by plotting ln[(I0/IT)-1] vs 1/(kT), as shown in Fig. 8, and the ΔE of CGTO∶0.15Tb3+ that equals the minus slope of the fitting line was determined to be 0.181 9 eV, which was close to the value of 0.2 eV for Ca3Ga2Ge3O12∶Tb3+ phosphor[27].
Inset: integrated intensity of the dominant emission from 5D4-7F5 transition
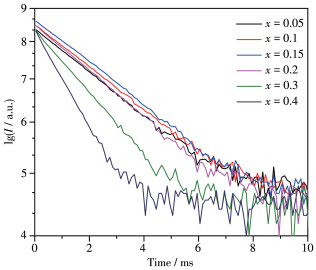
To further clarify the concentration quenching of Tb3+ in CGTO host, the luminescence decay curves of CGTO∶xTb3+ phosphors (λex=255 nm, λem=543 nm) are shown in Fig. 9. The luminescence decay curves of Tb3+ doped with different Tb3+ concentrations can be well fitted into a single exponential function as I=Aexp(-t/τ)+B (5), where I is the relative intensity; t is time; A and B are constants; τ is the lifetime of the Tb3+ ions.The fitting results are listed in Table 2. The lifetime of the Tb3+ ions decreased with increasing Tb3+ concentration. The decay time decreased from 4.181 7 to 1.719 1 ms, when the Tb3+ doping concentration increased from 0.05 to 0.4. It can be attributed to the increased non-radiative energy migration among Tb3+ ions.
下载:
导出CSV
| Tb doping concentration (x) | 0.05 | 0.1 | 0.15 | 0.2 | 0.3 | 0.4 |
| A | 4.519 4 | 4.293 9 | 4.723 8 | 4.504 4 | 4.369 8 | 4.297 3 |
| B | 4.369 2 | 4.408 6 | 4.404 3 | 4.446 3 | 4.394 7 | 4.431 1 |
| τ/ms | 4.181 7 | 4.068 9 | 4.020 6 | 3.587 2 | 2.646 8 | 1.719 1 |
In order to investigate the luminescence efficiency, quantum efficiency (η) of CGTO∶0.15Tb3+ was tested under 255 nm excitation, which is shown in Fig.10, and the value was obtained by the following equation[28]:
|
|
(6) |
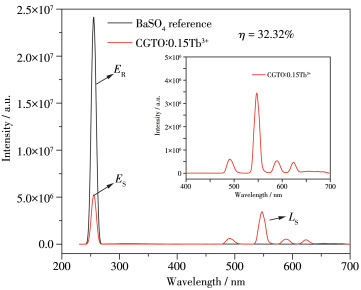
where LS and ES are the emission and excitation spectra of objective samples; ER is the spectrum of the excitation light without the samples in the integrating sphere. The quantum efficiency of CGTO∶0.15Tb3+ was calculated to be 32.32%, which was close to that of LiLaSiO4∶Tb3+(39.8%)[29].
In summary, we synthesized CGTO∶xTb3+ phosphors by a hightemperature solidstate reaction method. The intense green luminescence corresponding to 5D47F5 transition of Tb3+ of the sample was clearly observed under 255 nm excitation. The optimum doping concentration of Tb3+ was 0.15. The quantum efficiency of CGTO∶0.15Tb3+ was calculated to be 32.32%. CGTO∶Tb3+ phosphor exhibited an intensive green emission and high activation energy as well as low thermal quenching occurring under UV light excitation. These results suggest that CGTO∶Tb3+ phosphor is a promising greenemitting phosphor for optical devices.
McKittrick J, Shea-Rohwer L E. J. Am. Ceram. Soc. , 2014, 97(5): 1327-1352 doi: 10.1111/jace.12943
Liu X M, Lin J. J. Mater. Chem. , 2008, 18(2): 221-228 doi: 10.1039/B709929K
Sahu N K, Singh N S, Ningthoujam R S, Bahadur D. ACS Photonics, 2014, 1(4): 337-346 doi: 10.1021/ph4001718
Zhao W Y, An S L, Fan B, Li S B. Appl. Phys. A, 2013, 111(2): 601-604 doi: 10.1007/s00339-012-7271-1
Sotiriou G A, Franco D, Poulikakos D, Ferrari A. ACS Nano, 2012, 6(5): 3888-3897 doi: 10.1021/nn205035p
Weg V D W F, Popma T J A, Vink A T. J. Appl. Phys. , 1985, 57(12): 5450-5456 doi: 10.1063/1.334821
Panse V R, Kokode N S, Dhoble S J, Yerpude A N. Luminescence, 2016, 31(3): 893-896 doi: 10.1002/bio.3049
Yu H L, Yu X, Xu X H, Jiang T M, Yang P H, Jiao Q, Zhou D C, Qiu J B. Opt. Commun. , 2014, 317: 78-82 doi: 10.1016/j.optcom.2013.12.008
Carnall W T, Fields P R, Rajnak K. J. Chem. Phys. , 1968, 49: 4447-4449 doi: 10.1063/1.1669895
Yu R J, Wang C F, Chen J T, Wu Y K, Li H J, Ma H L. ECS J. Solid State Sci. Technol. , 2014, 3(3): R33-R37 doi: 10.1149/2.013403jss
Li K, Lian H Z, Van Deun R. Dalton Trans. , 2018, 47(8): 2501-2505 doi: 10.1039/C7DT04811D
Zhong J S, Xu M, Chen D Q, Xiao G H, Ji Z G. Dyes Pigm. , 2017, 146: 272-278 doi: 10.1016/j.dyepig.2017.07.019
Bondzior B, Stefanska D, Vu T H Q, Miniajluk-Gawel N, Deren P J. J. Alloys Compd. , 2021, 852: 157074 doi: 10.1016/j.jallcom.2020.157074
Liu Q, Wang L X, Huang W T, Li X B, Yu M X, Zhang Q T. Ceram. Int. , 2018, 44(2): 1662-1667 doi: 10.1016/j.ceramint.2017.10.091
Wang S Y, Sun Q, Devakumar B, Liang J, Sun L L, Huang X Y. J. Alloys Compd. , 2019, 804: 93-99 doi: 10.1016/j.jallcom.2019.06.388
Sun P F, Liu S H, Shu S, Ding K, Wang Y, Liu Y Y, Deng B, Yu R J. Opt. Mater. , 2019, 96: 109300 doi: 10.1016/j.optmat.2019.109300
Ueda K, Tanaka S, Yamamoto R, Shimizu Y, Honma T, Massuyeau F, Jobic S. J. Phys. Chem. C, 2020, 124(1): 854-860 doi: 10.1021/acs.jpcc.9b09260
Ghosh B, Dutta A, Brajesh K, Sinha T P. Indian J. Pure Appl. Phys. , 2015, 53(2): 125-133
Momma K, Izumi F. J. Appl. Crystallogr. , 2008, 41: 653-658 doi: 10.1107/S0021889808012016
Shannon R D. Acta Crystallogr. , 1976, 32: 751-767 doi: 10.1107/S0567739476001551
Zhang J C, Wang Y H, Zhang Z Y, Wang D Y, Ci Z P, Sun Y K. Chin. Sci. Bull. , 2007, 52(16): 2297-2300 doi: 10.1007/s11434-007-0329-3
Teng X, Li J K, Duan G B, Liu Z M. J. Lumin. , 2016, 179: 165-170 doi: 10.1016/j.jlumin.2016.06.029
Mccamy C S. Color Res. Appl. , 1992, 17(2): 142-144 doi: 10.1002/col.5080170211
Blasse G. J. Solid State Chem. , 1986, 62: 207-211 doi: 10.1016/0022-4596(86)90233-1
Dexter D L. J. Chem. Phys. , 1953, 21: 836-850 doi: 10.1063/1.1699044
Xie R J, Hirosaki, N, Kimura N, Sakuma K, Mitomo M. Appl. Phys. Lett. , 2007, 90(19): 191101 doi: 10.1063/1.2737375
Sawada K, Nakamura T, Adachi S. Ceram. Int. , 2017, 43(16): 14225-14232 doi: 10.1016/j.ceramint.2017.07.170
Van Deun R, Ndagsi D, Liu J, Van Driessche I, Van Hecke K, Kaczmarek A M. Dalton Trans. , 2015, 44(33): 15022-15030 doi: 10.1039/C5DT02112J
Wu X L, Du L, Zheng Y L, Pei M K, Ren Q, Hai O. J. Lumin. , 2021, 235: 118027 doi: 10.1016/j.jlumin.2021.118027

Figure 2 (a) Rietveld refinement for XRD patterns of CGTO∶0.15Tb3+ phosphor; (b) Crystal structure of CGTO∶0.15Tb3+ phosphor

Figure 3 (a, b) SEM images of CGTO: 0.15Tb3+; (c~g) Distribution of the elements in CGTO: 0.15Tb3+; (h) EDS spectrum of CGTO: 0.15Tb3+

Figure 4 Photoluminescence spectra of CGTO∶xTb3+: (a) excitation spectrum of CGTO∶0.15Tb3+, λem=543 nm; (b) emission spectra (λex=255 nm) with the inset showing the relative integrated intensity of the dominant emission from 5D4-7F5 transition

Figure 5 CIE chromaticity coordinates of CGTO∶0.15Tb3+(λex=255 nm) and luminescence image (Inset) of CGTO∶0.15Tb3+ irradiated by 254 nm UV lamp

Figure 7 Temperature dependent emission intensity spectra of CGTO∶0.15Tb3+
Inset: integrated intensity of the dominant emission from 5D4-7F5 transition

Figure 10 Excitation line of BaSO4 reference and emission spectrum of CGTO∶0.15Tb3+ under 255 nm excitation collected using an integrating sphere
Table 1. Refined crystallographic parameters of CGTO∶0.15Tb3+ phosphor
| Formula | Ca2(Gd0.85Tb0.15)TaO6 |
| Crystal system | Monoclinic |
| Space group | P21/n |
| a/nm | 0.557 516(4) |
| b/nm | 0.584 742(5) |
| c/nm | 0.808 356(6) |
| β/(°) | 90.306 1(2) |
| Volume/nm3 | 0.263 523 |
| Rwp/% | 2.36 |
| Rp/% | 1.50 |
| χ2 | 3.494 8 |
 下载: 导出CSV
Table 2. Lifetime (τ) of Tb3+ 543 nm emission in CGTO∶xTb3+ phosphors under 255 nm excitation
| Tb doping concentration (x) | 0.05 | 0.1 | 0.15 | 0.2 | 0.3 | 0.4 |
| A | 4.519 4 | 4.293 9 | 4.723 8 | 4.504 4 | 4.369 8 | 4.297 3 |
| B | 4.369 2 | 4.408 6 | 4.404 3 | 4.446 3 | 4.394 7 | 4.431 1 |
| τ/ms | 4.181 7 | 4.068 9 | 4.020 6 | 3.587 2 | 2.646 8 | 1.719 1 |
下载: 导出CSV

 扫一扫看文章

扫一扫关注我们