Figure 1.
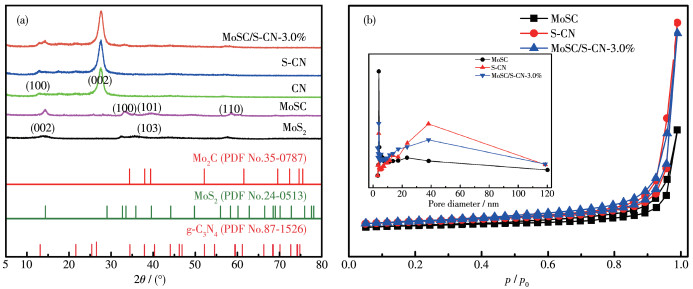
(a) XRD patterns for MoSC, S-CN and MoSC/S-CN-3.0%, respectively; (b) Nitrogen adsorption-desorption isotherms (inset: pore-size distribution)
Carbonized MoS 2/S-Doped g-C3N4 Heterojunction: Synthesis and Catalytic Degradation Mechanism of Rhodamine B under Visible Light
Ling-Fang QIU , Meng-Fan MA , Zhe-Yuan LIU , Jian CHEN , Ping LI , Xiang-Shu CHEN , Hidetoshi Kita , Shu-Wang DUO

Graphitic carbon nitride (g-C3N4), a polymeric semiconductor with advantages of low-cost, moderate band gap (2.7 eV), and super-stability, has been investigated widely and applied to a series of photocatalytic systems[1-2]. However, the high recombination rate of photo-induced electron-hole pairs and undesired conductivity hinder the practical application of g-C3N4.
Non-metal doping is an effective way to modify the electronic structure of g-C3N4. Based on reported results, S-doped g-C3N4 (S-CN) shows broadened visiblelight absorption, higher photo-induced electron-hole pair separation rate, and faster carrier mobility[3-4]. In addition, molybdenum disulfide (MoS2), one kind of transition metal sulfides, has been used as a super co-catalyst in photocatalyst-based heterojunctions (such as MoS 2/g-C3 N4 [5-8] and MoS2/TiO2[7, 9]) for its prominent features such as super efficiency and low cost. But its metallic edges and defects still limit the further application of those heterojunctions. Fortunately, further report showed that partially carbonized MoS2 (MoSC) exhibited excellent metallic characterization, which makes a tremendous contribution to improving the conductivity of semiconductor and electronic structure adjustment[10-13]. Therefore, it is worth exploring a new heterojunction made up of S-CN and MoSC, which can overcome some defects of g-C3N4 mentioned above.
In this work, we fabricated partially carbonized MoS2/sulfur-doped g-C 3N4 heterojunction (MoSC/S-CN) for the first time. Structural properties, optical properties, and rhodamine B (RhB) photo-degradation performance of MoSC/S-CN were discussed. We also investigated a series of single and binary photocatalysts as comparisons.
All the chemicals used were commercially available and without any further treatment. Ammonium molybdate tetrahydrate ((NH4) 6 Mo7O 24·4H2O, AR) and thiourea (CH4N2S, AR) were used to prepare MoS2. Dicyandiamide (C2H4N4, AR) was used in MoS 2 carbonization. Moreover, dicyandiamide, ammonium chloride (NH4Cl, AR) and thiourea were used in S-CN nanosheet preparation. To clarify the photocatalytic activity of the samples, RhB, p-benzoquinone, tertiary butanol, and triethanolamine were used in a series of experiments. Anhydrous ethanol and pure water were used as solvents. All pure water used was made in our lab.
Typically, MoS2 was firstly prepared according to the literature[10]. Ammonium molybdate tetrahydrate (2.48 g) and 5.32 g thiourea were added into pure water (60 mL) under stirring. After stirring for 1 h, the solution was transferred to an autoclave with a Teflon lining of 100 mL. The crystallization was carried out in a temperature constant oven at 200 ℃ for 24 h. Black solids were obtained after crystallization, and washed by water and anhydrous ethanol, then centrifuged for three times. The final black solids were dried under 60 ℃ for 24 h. The ground solid was MoS2. After that, 500 mg MoS2 and 4 g dicyandiamide were mixed and calcined under Ar-H2 at 450 ℃. The final solid was MoSC.
Typically, 3 g dicyandiamide, 15 g ammonium chloride, and 0.05 g thiourea were added into 50 mL ultrapure water and dissolved at 80 ℃. Then, the stirring was kept until the mixture became a uniform powder mixture. The uniform powder was then put into a crucible and calcined in a muffler at 550 ℃ for 4 h, and the heating and cooling rate were 2 ℃·min-1. The obtained light-yellow powder was S-CN nanosheet.
MoSC/S-CN composites were fabricated by hydrothermal method. 0.5 g S-CN was dispersed in ethanol solution. Then, MoSC was also dispersed in ethanol solution. Four samples were made by adding specific amounts of MoSC (7.5, 15, 30 and 50 mg, respectively). Both S-CN and MoSC dispersions were treated by ultrasound for 1 h. After that, MoSC dispersion was added dropwise into S-CN dispersion and kept stirring for 1 h. Then the mixture was heated at 90 ℃ for 5 h within a sealed autoclave after treated by ultrasonic for 2 h. The obtained dry solids were ground and calcined at 300 ℃ for 2 h, and the heating and cooling rates were 5 ℃ · min-1. The prepared samples were marked as MoSC/SCN-1.5%, MoSC/S-CN-3.0%, MoSC/S-CN-6.0% and MoSC/S-CN-10%, respectively.
For comparison, composites of MoS2/CN-3.0% and MoS2/S-CN-3.0% were also prepared. The synthesis processes were the same as that of MoSC/S-CN-3.0% as described above except that MoSC and S-CN were changed into MoS2 and CN for MoS2/CN-3.0%, and MoSC was changed into MoS2 for MoS2/S-CN-3.0%.
X-ray diffraction (XRD) was used for detecting the crystal phase of the samples (XRD-6100, Shimadzu Corporation, Japan). The wavelength of Cu target was 0.154 1 nm, the accelerating voltage was 40 kV, the accelerating current was 30 mA, the scan range was 2θ =5°~80°, the scanning rate was 5 (°) ·min-1 and the scanning step was fixed at 0.02°. Scanning electron microscopy (SEM) was used for observing the surface morphology of the samples (Sigma, Zeiss, Germany). It should be noted that the samples were ultrasonicated and treated by gold sputtering for 50 s before applied for SEM. The accelerating voltage was 20 kV. Highresolution transmission electron microscopy (HRTEM) was applied for observing the structure in detail (JEM 2100F, JEOL, Japan). The accelerating voltage was 200 kV. Photocatalytic reaction was carried out in a photochemical reaction instrument (XPA, Xujiang Electrics and Mechanics Manufacturing Company, China). Optical properties were separately measured by UV-visible diffuse reflection spectra (UV-Vis DRS, Lambda 750, PerkinElmer Corporation, UK) for powder samples, photoluminescence spectroscopy (PL, OmniPL -LF325, Zolix Corporation, China), X-ray photoelectron spectroscopy (XPS, K -alpha, Thermo Scientific Corporation, USA), and electrochemical system for measuring photocurrent density, M-S (Mott-Schottky) plot and EIS (electrochemical impedance spectroscopy) Nyquist plot (CHI660E, Chenhua Instrument Limited Corporation, China). During using DRS, BaSO4 was chosen as a reference, and the measurement range was from 200 to 800 nm. For PL, the Xeon lamp was the visible light source, the activation wavelength was 325 nm, and the scanning range was from 300 to 800 nm. For XPS, Al Kα was the source gun type, and the enegy step size was 1.0 eV.
Typically, 50 mg photocatalyst was added in RhB solution (20 mg·L-1, 50 mL) in a specific quartz tube under stirring. After stirring for 1 h under dark, the first sample (4 mL) was taken when the system showed the physical adsorption equilibrium, and the supernatant liquid was measured by UV-Vis spectrophotometer. Then the light (λ > 420 nm) was turned on, and photocatalytic process began. The samples with the same volume were taken every 20 min. The initial concentration and concentration during photocatalytic process of the liquid was marked as c0 and c, respectively. During the measurement for the photo stability of optimized MoSC/S-CN heterojunction, the sample was washed and dried after every trial by centrifugation.
Fig. 1a shows the XRD patterns of MoS2, MoSC, CN, S-CN, and MoSC/S-CN-3.0%, respectively. The peaks located at 2θ=13.1° and 27.4° are in accordance with the typical lattice interfaces of (100) and (002) of g-C3N4, respectively[14]. Moreover, the XRD pattern of MoSC showed typical peaks of MoS2 and MoSC at the same time. The peak of 14° indicates the (002) crystal plane of MoS2, and the peak of 39.4° can be considered as the overlap between the lattice plane of Mo2C (101) and MoS2 (103), which are pretty in corresponding to the reported result[10]. Because of the small amount of MoSC in MoSC/S-CN-3.0%, only some typical peaks of MoSC can be found. And an overlap between the peaks of g-C3N4 (100) and MoSC (002) appeared and there was no impurity, which indicates that the target composite has been prepared successfully. The N2 adsorption-desorption results are shown in Fig.1b. The specific surface areas for MoSC, S-CN and MoSC/S-CN-3.0% were calculated to be 41, 61 and 71 m2·g-1, respectively. Obviously, more active sites should be exposed on the surface of MoSC/S-CN-3.0%, which faciliates higher photocatalytic activity.
From SEM images, we can find that after coupling of nanosheet like MoSC (Fig. 2a) and silk like S-CN nanosheet with significant wrinkle (Fig.2b), the obtained MoSC/S-CN-3.0% showed a wide range of accumulations (Fig.2c), which should be ascribed to the combination of MoSC and S-CN. Furthermore, the TEM and HRTEM images of MoSC/S-CN-3.0% (Fig.2d and 2e) show the apparent lattice spacings of 0.27 and 0.24 nm corresponding to MoS2 (100) and Mo2C (002), respectively. Obviously, MoSC/S-CN heterojunction with intimate contact surface has been prepared successfully.

The XPS survey spectrum (Fig. 3a) indicates that the main elements in MoSC/S-CN-3.0% are S, Mo, C, N and O, where O should be from the partial oxidation of the sample surface. The high resolution XPS spectrum of C1s (Fig. 3b) displayed the peaks of standard C—C and sp2 hybrid carbon within N—C=N at the binding energy of 284.8 and 288.2 eV, respectively[15-16]. Fig. 3c shows the high-resolution spectrum for N1s, and the peaks at 398.6, 399.5 and 401.1 eV correspond to sp2 hybrid N within C—N=C, N—(C)3 and C—N—H, respectively. The two peaks of the S2p spectrum at a binding energy of 161.8 and 163.0 eV (Fig. 3d) demonstrate the existence of thiophene-S (—C— S—C—) within S-CN[17]. Besides, the high-resolution spectrum for Mo3d showed six fitted peaks (Fig.3e). The peak at 226.1 eV should be attributed to the existence of S2s. The double peaks at 232.1 and 229.0 eV should be ascribed to the appearance of Mo3d3/2, Mo3d5/2 of MoS2[10]. The other two peaks at 230.8 and 228.0 eV derived from Mo2+ belong to Mo3d of Mo2C. It should be noted that the peak at 235.1 eV illustrates the existence of Mo6+, which maybe from MoO3 or MoO42-[16, 18], which verify that Mo on the surface has been oxidized to some extent. Thus, MoSC has conjoined well with S-CN in MoSC/S-CN-3.0%.
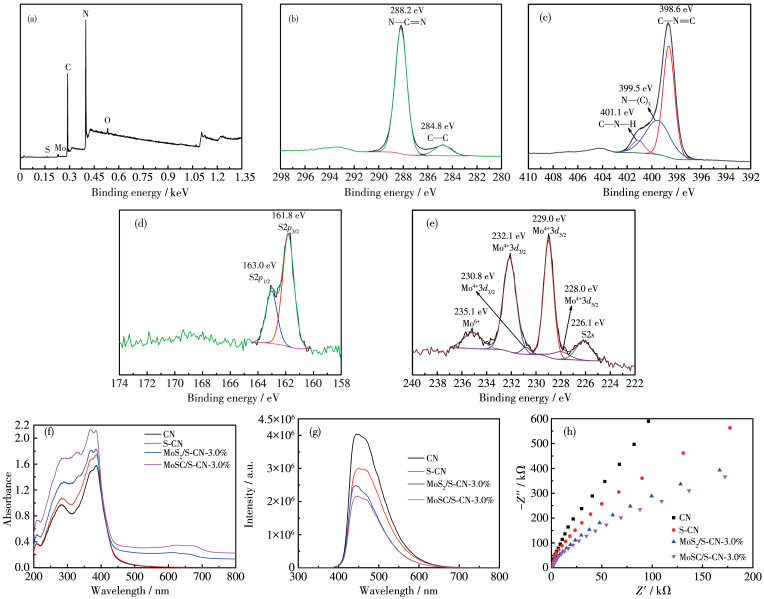
As shown by UV Vis DRS spectra (Fig.3f), compared with CN, S-CN shows much higher visible-light adsorption and the adsorption edge is broadened to some extent. After coupling with MoS2, MoS2/S-CN-3.0% behaved stronger visible-light adsorption and even had obvious adsorption for (near) IR light within a wavelength range of 600~700 nm. This result should be attributed to the excellent metallic characteristics of MoSC. The band gaps of CN, S-CN, MoSC, MoS2/S-CN-3.0% and MoSC/S-CN-3.0% were calculated to be 2.65, 2.64, 1.12, 2.55 and 2.50 eV, respectively (Fig.S1).
The intensity of the emission peak in PL spectra decreased after a series of modifications for CN, and MoSC/S-CN-3.0% showed the lowest intensity, which demonstrates the highest photo induced electron hole carriers separation efficiency of MoSC/S-CN-3.0% (Fig. 3g). In addition, the higher transfer efficiency of photo-induced carriers can also be indicated by the lower carrier transfer resistance of MoSC/S-CN-3.0% showed by EIS Nyquist plots (Fig.3h). The highest photocurrent density of MoSC/S-CN-3.0% further demonstrates the highest photo induced carries separation efficiency (Fig.S2).
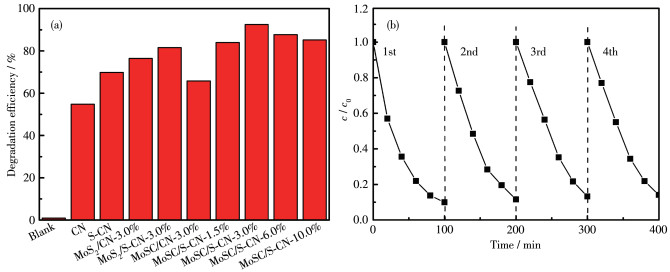
All the samples have been applied to RhB degradation under visible-light illumination (λ > 420 nm) for 100 min (Fig.4a). Among a series of single and binary samples, MoSC/S-CN-3.0% showed significantly enhanced photodegradation efficiency (92.50%), which was 68.83% higher than that of CN. The promising photocatalytic activity should be ascribed to the synergistic effect of MoSC and S-CN. It should be noted that excess incorporation of MoSC in the composite may retard the exposure of active sites and adsorption of light. Furthermore, MoSC/S-CN-3.0% was found to show excellent stability after four recycles for RhB degradation under the same conditions (Fig.4b).
The role of active species on the photocatalytic activity of MoSC/S-CN-3.0% was investigated (Fig.5a). When tertiary butanol (·OH scavenger) was added, the RhB degradation efficiency hardly changed compared to the result without additives. When TEOA (h+ scavenger) was added, the RhB degradation efficiency showed an appropriate reduction of 50%. Moreover, after adding 1, 4-benzoquinone for capturing ·O2-, the photocatalytic process had been retarded to a great extent, and the RhB degradation efficiency became slightly higher than that of RhB blank solution. Obviously, ·O2- is the most crucial active species, and h+ behaves with moderate effects during the photocatalytic reaction.
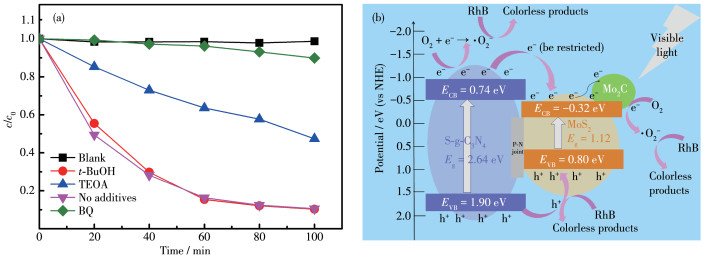
Finally, the photocatalytic mechanism is proposed (Fig. 5b). Due to the narrow band gaps (Eg) of S-CN (2.64 eV) and MoSC (1.12 eV), both of S-CN and MoSC were activated under visible-light illumination, and photo-induced electrons and holes were produced. Based on M S plots (Fig.S3), the conductor band (CB) potentials of S-CN (-0.74 eV) and MoSC (-0.32 eV) were obtained. And because of Eg=ECB+EVB, the valence band (VB) potentials of S-CN and MoSC were calculated to be 1.90 and 0.80 eV, respectively. Obviously, S-CN showed a more negative CB potential than that of MoSC, and a more positive VB potential than that of MoSC, which makes both photo-induced electrons and holes transfer from S-CN to MoSC. Meanwhile, after coupling n-type S-CN and p-type MoSC, the p-n joint forms on the contact surface, and inner electric field forms[19-20]. Therefore, it is difficult for the photoinduced electrons on CB of S-CN to transfer to CB of MoSC. The transfer is partially restricted. But the photoinduced holes accumulate continuously on the VB of MoSC. Thus, the photo-induced electrons and holes are separated effectively. Moreover, the photo-induced electrons on CB of MoSC transfer to metallic Mo2C. Then the photo-induced electrons and holes are further separated. As described above that ·O2- and h+ are the main active species during the photo degradation process, we can estimate that the photo-induced electrons on Mo2C and CB of S-CN are trapped by O2 to form ·O2- radicals, and RhB is decomposed directly by ·O2-. At the same time, RhB is decomposed by photoinduced holes (h+) on the VB of MoSC as shown in Fig.5b. The construction of S-CN/MoSC heterojunction realizes the effective separation of photo-induced electron hole pairs and makes significant contribution to degrading RhB under visible-light excitation.
In conclusion, S-doped g-C3N4 has been coupled with partially carbonized MoS2 by simple hydrothermal method. The hybrid mass ratio of MoS2/MoC2 was optimized, and all the samples were analyzed by a series of physical and optical characterizations. Optimized carbonized MoS2 /S-doped g-C3N4 heterojunction showed a smaller band gap and appropriate VB and CB position for RhB degradation, which led to an ideal photocatalytic activity. The achievements provide a new way for discovering new materials for photocatalysis.
Ong W J, Tan L L, Ng Y H, Yong S T, Chai S P. Chem. Rev. , 2016, 116: 7159-7329 doi: 10.1021/acs.chemrev.6b00075
Prasad C, Tang H, Liu Q Q, Bahadur I, Jiang Y J. Int. J. Hydrogen Energy, 2020, 45: 337-379 doi: 10.1016/j.ijhydene.2019.07.070
Jiang L B, Yuan X Z, Pan Y, Liang J, Zeng G M, Wu Z B, Wang H. Appl. Catal. B, 2017, 217: 388-406 doi: 10.1016/j.apcatb.2017.06.003
Zeng W X, Bian Y, Cao S, Zhu A Q, Qiao L L, Ma Y J, Tan P F, Ma Q Y, Dong R, Pan J. Appl. Surf. Sci. , 2019, 478: 334-340 doi: 10.1016/j.apsusc.2019.01.238
Li J, Liu E Z, Ma Y N, Hu X Y, Wan J, Sun L, Fan J. Appl. Surf. Sci. , 2016, 364: 694-702 doi: 10.1016/j.apsusc.2015.12.236
Li Y F, Zhou M, Cheng B, Shao Y. J. Mater. Sci. Technol. , 2020, 56: 1-17 doi: 10.1016/j.jmst.2020.04.028
Liang Z Z, Shen R, Ng Y H, Zhang P, Xiang Q J, Li X. J. Mater. Sci. Technol. , 2020, 56: 89-121 doi: 10.1016/j.jmst.2020.04.032
Bie C B, Cheng B, Fan J J, Ho W K, Yu J G. EnergyChem, 2021, 3: 100051 doi: 10.1016/j.enchem.2021.100051
Hu K H, Xian G H, Yu F X, Jia D S. J. Mater. Sci. , 2010, 45: 2640-2648 doi: 10.1007/s10853-010-4242-9
Shao M M, Shao Y F, Ding S J, Tong R, Zhong X W, Yao L M, Ip W F, Xu B M, Shi X Q, Sun Y Y. ACS Sustainable Chem. Eng. , 2019, 7: 4220-4229 doi: 10.1021/acssuschemeng.8b05917
Zhao Z H, Qin F, Kasiraju S, Xie L X, Alam M K, Chen S, Wang D Z, Ren Z F, Wang Z M, Grabow L, Bao J M. ACS Catal. , 2017, 7: 7312-7318 doi: 10.1021/acscatal.7b02885
Zhang K, Zhao Y, Zhang S, Yu H, Chen Y J, Gao P, Zhu C L. J. Mater. Chem. A, 2014, 2: 18715-18719 doi: 10.1039/C4TA04564E
Jeon J, Lee J, Choi S, Lee B H, Song Y J, Cho J H, Yun H J, Lee S. ACS Nano, 2018, 12: 338-346 doi: 10.1021/acsnano.7b06417
Qiu L F, Qiu X B, Li P, Ma M F, Chen X S, Duo S W. Mater. Lett. , 2020, 268: 127566 doi: 10.1016/j.matlet.2020.127566
Qiu L F, Zhou Z W, Ma M F, Li P, Duo S W. Materials, 2019, 12: 3948-3964 doi: 10.3390/ma12233948
Ye L J, Wang D, Chen S J. ACS Appl. Mater. Interfaces, 2016, 8: 5280-5289 doi: 10.1021/acsami.5b11326
Vinoth S, Mary Rajaitha P, Venkadesh A, Shalini Devi K S, Radhakrishnan S, Pandikumar A. Nanoscale Adv. , 2020, 2: 4242-4250 doi: 10.1039/D0NA00172D
Zeleke T S, Tsai M C, Weret M A, Huang C J, Hwang B J. ACS Nano, 2019, 13: 6720-6729 doi: 10.1021/acsnano.9b01266
Ren H, Jia S, Wu Y, Wu S, Zhang T. Ind. Eng. Chem. Res. , 2014, 53: 17645-17653 doi: 10.1021/ie503312x
Fan G D, Du B H, Zhou J J, Yu W W, Chen Z Y, Yang S W. Appl. Catal. B, 2020, 265: 118610 doi: 10.1016/j.apcatb.2020.118610

Figure 1 (a) XRD patterns for MoSC, S-CN and MoSC/S-CN-3.0%, respectively; (b) Nitrogen adsorption-desorption isotherms (inset: pore-size distribution)

Figure 2 SEM images of (a) MoSC, (b) S-CN and (c) MoSC/S-CN-3.0%, and (d) TEM and (e) HRTEM images of MoSC/S-CN-3.0%, respectively

Figure 3 XPS spectra for (a) survey detection, (b) C1s, (c) N1s, (d) S2p and (e) Mo3d of MoSC-S-CN-3.0%; (f) DRS spectra, (g) PL spectra and (h) EIS Nyquist plots of CN, S-CN, MoS2/S-CN-3.0% and MoSC/S-CN-3.0%, respectively

Figure 4 (a) Comparison of photocatalytic activities of CN, S-CN, MoS2/CN-3.0%, MoS2/S-CN-3.0% and MoSC/S-CN with different MoSC mass fractions, respectively; (b) Stability of photocatalytic performance of MoSC/S-CN-3.0%

 扫一扫看文章

扫一扫关注我们
 下载:
下载:
 下载:
下载:
