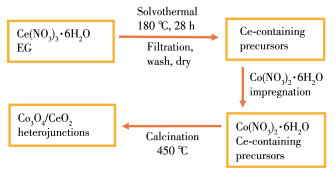
Figure 1.
Schematic illustration of the synthesis process of Co3O4/CeO2 composite
Co3O4/CeO2 Heterojunction: Preparation and Electrocatalytic Oxygen Evolution Performance in Alkaline Medium
Sai-Nan ZHU , Wei WANG , You-Rong TAO , Xin-Yu ZHANG , Xing-Cai WU , Dun-Ming ZHANG

With the gradual depletion of fossil fuels and deterioration of ecological environment, it is necessary to pursue renewable and sustainable energy sources[1-3]. Hydrogen (H2) as a clean and new energy, has received widespread attention due to its high energy density and negligible pollution of combustion products[4]. Currently, electrolysis of water has been considered as a promising strategy to produce H2 owing to its giant advantage of abundance in resources and carbon-free emissions[5-7]. However, the practical application of water splitting has been largely impeded due to the relatively slower kinetics and higher overpotentials of oxygen evolution reaction (OER) at the anode[8-10]. Up to now, RuO2 and IrO2 are regarded as the optimal commercial catalysts to accelerate OER kinetics, but the high cost and low abundance of noble metal oxides greatly prevent their practical application in industrial electrolysis[11-13]. Therefore, the development of efficient and stable non-noble metal catalysts has become a research hotspot.
In recent years, cerium oxide (CeO2) with the simple structure, rich elemental abundance and good catalytic performance[14], has attracted much research attention and is mainly used in thermocatalytic reactions due to its redox cycle of Ce3+/Ce4+ and lattice oxygen mobility[15-17]. But at room temperature, it is very difficult for single CeO2 to be an excellent electrocatalyst due to its rare number of oxygen vacancy and relatively poor electron conductivity. Therefore, to compete with other metal oxide-based materials and significantly improving the electrocatalytic performance, the CeO2 needs to be modified by controlling morphology or modulating electronic structure (other components doping or loading) [18-20]. Kang et al. developed the Co-doped CeO2 nanosheet arrays, which presented a better hydrogen evolutin reaction (HER) performance than bare CeO2 with the relatively low overpotential of 132 mV at 100 mA·cm-2, because the additional cobalt dopant promotes formation of oxygen vacancies[21]. Li et al. prepared the FeOOH/CeO2 heterolayered nanotube as an efficient OER catalyst with an overpotential of 300 mV at 80.2 mA·cm-2 in 1.0 mol·L-1 NaOH owing to the strong electron interactions between the CeO2 and FeOOH[22]. However, most of the reported Ce-based materials need to be grown on the foamed nickel substrate[23-25], which not only increases the complexity of catalyst preparation, but also cannot directly characterize the intrinsic activity of Ce-based electrocatalysts, because the foamed nickel itself has better performance for the OER/HER reactions. Therefore, it remains a great challenge to design the highly efficient Ce-based electrocatalysts without support substrate.
Herein, a novel Co3O4/CeO2 heterojunction composite oxide was prepared by a facile two-step method for alkaline OER, and the supported Co3O4 nanoparticles can effectively enhance the electron conductivity of composite (decrease the charge transfer resistance). Meanwhile, the concentration of surface oxygen vacancies and active oxygen species of CeO2 can be also increased due to the strong surface electron interaction. The synthesized 58.5%Co3O4/CeO2 composite exhibited a superior OER performance with a low overpotential of 347 mV at 10 mA·cm-2 and small Tafel slope of 72.7 mV·dec-1 as well as an excellent stability relative to commercial RuO2.
Co(NO3)2·6H2O (AR), Ce(NO3)3·6H2O (AR), and ethylene glycol (EG, AR) were purchased from China Reagent Co., Ltd. Anhydrous ethanol (AR) was purchased from Wuxi Yasheng Chemical Co., Ltd. All chemicals were used as received without further purification.
The Co3O4/CeO2 composite was prepared by a facile two-step method, the fabrication process is exhibited in Fig. 1. First, 6.079 1 g Ce(NO3)3·6H2O was completely dissolved in 50 mL EG to form a homogeneous solution, and then the solution was transferred to a 60 mL autoclave and maintained at 180 ℃ for 28 h. After the autoclave was cooled to room temperature, the products were separated by filtration, and washed by water and alcohol, and finally dried in vacuum 60 ℃ for 12 h. Second, Co3O4/CeO2 catalysts were developed by wet impregnation of the above as-synthesized Ce-containing precursors with the aqueous solution of Co(NO3)2·6H2O. The impregnated solids were dried at 90 ℃ for 1 h and then calcined at 450 ℃ in air for 3 h. The catalysts were denoted as X%Co3O4/CeO2 where X% represented the mass ratio between Co3O4 and CeO2 in composite oxide (X=14.6, 29.3, 43.9, 58.5, 73.2, 87.8).
X-ray diffraction (XRD) patterns of all the samples were collected in the range from 10° to 80° (2θ) using a Bruker D8ADVANCE powder diffractometer (Cu Kα radiation, λ=0.154 05 nm), operated at 40 kV and 40 mA. Scanning electron microscopy (SEM, S-4800, Japan), transmission electron microscopy (TEM, JEM-2100, Japan) and high-resolution transmission electron microscopy (HRTEM, JEM-2100, Japan) were employed to analyse the morphology and structure of samples. The working voltages of SEM and TEM were 5 and 200 kV, respectively. The elemental composition and valence state of the sample were analyzed on X-ray photoelectron spectroscopy (XPS, Phi-5000 Versaprobe, Al Kα radiation, hν =1 486.6 eV). All electrochemical measurements including rotating-disk electrode (RDE) polarization curves (linear sweep voltammetry (LSV), 5 mV·s-1, the positively scanned branch), cyclic voltammetry (CV, 50 mV·s-1, positive scanning), and chronoamperometry measurements were carried out by a three-electrode cell with an electrochemical workstation (CHI 760E, Chenhua, China) in O2-saturated 1.0 mol·L-1 KOH at room temperature. The reference, counter, and working electrodes were an Hg/HgO electrode (1.0 mol·L-1 KOH), a graphite-rod electrode, and a RDE with a glassy-carbon electrode (GCE, area 0.125 6 cm2), respectively. All potentials (iR corrections) were calibrated to the reversible hydrogen electrode (RHE) by the following conversion formula (ERHE=EHg/HgO+0.059 1pH+0.095). For electrode preparation, typically, 8 mg of catalyst with 2 mg of carbon black (Vulcan XC-72 carbon) were dispersed in 500 μL deionized water to form a homogeneous ink by ultrasound for 5 min. Afterwards, 5 μL of catalyst ink was dropped onto a freshly polished glassy carbon electrode and dried naturally. The loading of all catalysts, including commercial RuO2, on the disk electrode was 0.79 mg·cm-2. The electrochemically active surface areas (ECSAs) of various catalysts were acquired by doublelayer capacitance (Cdl), as previously described in the literature[26-27]. Additionally, the electrochemical impedance spectra (EIS) were gained at 1 600 r·min-1 from 10 000 to 0.01 Hz in O2-saturated 1.0 mol·L-1 KOH.
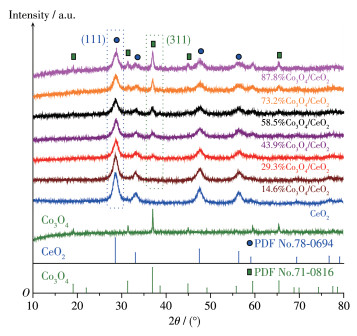
Fig. 2 shows the XRD patterns of CeO2, Co3O4 and X% Co3O4/CeO2 catalysts. The evident peak at 28.5° ascribed to the reflection plane of cubic fluorite CeO2 (111) (PDF No. 78-0694, as indicated in blue dashed box) [28] and the characteristic diffraction peak at 36.9° belonging to the (311) facet of cubic spinel Co3O4 (PDF No.71-0816, as indicated in green dashed box) [29] can be detected in all X%Co3O4/CeO2 samples, which illustrates that Co 3O4 nanoparticles have been successfully decorated on the CeO2 surfaces. Meanwhile, the characteristic peak intensity of Co3O4 (311) gradually increased with the increase of Co 3O4 loading, indicating the augment of average crystallite size for supported Co3O4 nanoparticles.
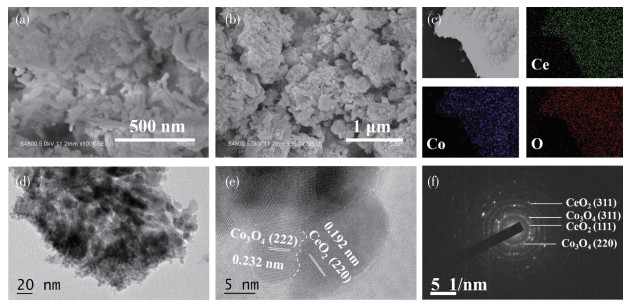
The detailed morphologies and structures of Ce-based catalysts were analyzed by SEM and TEM techniques. Obviously, the pure CeO2 with a smooth surface displays the mixed shapes of nanorods and nanoparticles with sizes of above 3 nm×15 nm~17 nm× 150 nm and 50 nm, respectively (Fig. 3a). For 58.5%Co3O4/CeO2 composite, it is clearly observed that many Co3O4 nanoparticles with a small size of about 10~30 nm were attached onto the surfaces of CeO2 (Fig. 3b, 3d), and the nanocrystallines of supported Co3O4 nanoparticles was smaller than that of CeO2 (Fig. 3d). The energy dispersive X-ray spectra (EDX) mappings (Fig. 3c) suggest that Co, Ce and O elements were homogeneously distributed on the surfaces of the composite. The HRTEM image in Fig. 3e shows a clear boundary between CeO2 and Co3O4 and two lattice fringe spacings of 0.192 and 0.232 nm, corresponding to the (220) plane of CeO2 and the (222) plane of Co3O4, respectively[30-31]. The corresponding selected area electron diffraction (SAED) patterns display a few bright rings with discrete spots, which demonstrates the polycrystalline structure of the Co3O4/CeO2 composite (Fig. 3f).
The elemental composition and valence states of the catalysts were analyzed by XPS. The XPS survey spectrum (Fig. 4a) clearly shows the presence of Co, Ce, and O elements in 58.5%Co3O4/CeO2 composite. The Co2p XPS spectra verify the existence of both Co3+ and Co2+ in pure Co3O4 and 58.5%Co3O4/CeO2 composite (Fig. 4b), and the binding energy of the Co2p orbit in the 58.5%Co3O4/CeO2 composite shifts to lower value (780.11 eV) than that (780.35 eV) of pure Co3O4. In addition, the ratio of Co3+/Co2+ in 58.5%Co3O4/CeO2 (1.45) was higher than that of pure Co3O4 (1.11). These results demonstrate the presence of electron transfer between Co3O4 and CeO2. The increased amount of surface Co3+ (high valence state Co) can effectively promote the adsorption of OH- and improve the OER performance[32-33]. Here because Co2+ (Td coordination structure) changes into Co3+ (Oh structure), it is helpful to coordination of oxygen species.
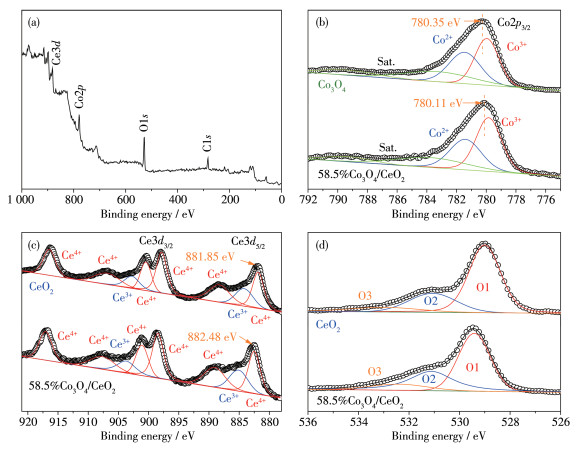
The Ce3d XPS spectra of pure CeO2 and 58.5%Co3O4/CeO2 are shown in Fig. 4c. Specifically, the peaks at 884.16 and 902.76 eV belong to Ce3+, and the peaks at 881.85, 888.27, 897.85, 900.45, 906.87 and 916.45 eV are assigned to Ce4+, respectively, indicating the coexistence of Ce3+ and Ce4+ in the CeO2 surfaces[34]. Ce3d5/2 peaks in 58.5%Co3O4/CeO2 composite shows significant positive shift than CeO2. Moreover, the 58.5%Co3O4/CeO2 composite had a smaller ratio of Ce4+/Ce3+ (4.19) than that of pure CeO2 (4.52) due to the partial electron transfer from Co3O4 nanoparticles to CeO2 surfaces. The existence of Ce3+ can introduce unsaturated chemical bonds and oxygen vacancies in the CeO2 crystal to create a charge imbalance, and these oxygen vacancies can effectively realize the adsorption and activation of oxygen species, which is beneficial to the enhanced OER activity[35-36].
The O1s XPS spectra for CeO2 and 58.5%Co3O4/CeO2, as shown in Fig. 4d, are fitted into three peaks corresponding to the lattice oxygen (O1, 529.00 eV), chemisorbed oxygen or surface oxygen vacancies (O2, 531.06 eV), and surface hydroxyl groups or adsorbed water species (O3, 532.98 eV), respectively[37]. The 58.5%Co3O4/CeO2 exhibits the higher ratio (34.5%, atomic fraction) of O2 to (O1+O2+O3) than that of pure CeO2 (25.1%), indicating that the generation of more surface oxygen vacancies after the supported Co3O4 nanopartides.
The electrochemical performance of Co3O4, CeO2, commercial RuO2, and Co3O4/CeO2 samples were tested by RDE techniques in an O2-saturated 1.0 mol·L-1 KOH solution. The LSV curves of different catalysts were displayed in Fig. 5a. Distinctly, the 58.5%Co3O4/CeO2 sample shows the best performance with the lower overpotential of 347 mV at 10 mA·cm-2, lower than Co3O4 (440 mV), commercial RuO2 (359 mV) and CeO2 (570 mV). The smallest value of Tafel slope for 58.5%Co3O4/CeO2 composite indicates the relatively fast OER kinetics on surfaces (Fig. 5b). Additionally, with the increase of loading amounts from 14.6% to 58.5%, the activities of X%Co3O4/CeO2 were constantly increasing with the ever-reduced values of Tafel slope (Fig. 5c, 5d). But excess Co3O4 loading amounts (73.2%~87.8%) can decrease the OER catalytic activity, which may be related to the superfluous Co3O4 nanoparticles with low intrinsic activity occupying the active sites on interface of X% Co3O4/CeO2 composites. The OER activity shows a volcanic trend with the increase of Co3O4 loading amounts, as shown in Fig. 5e.
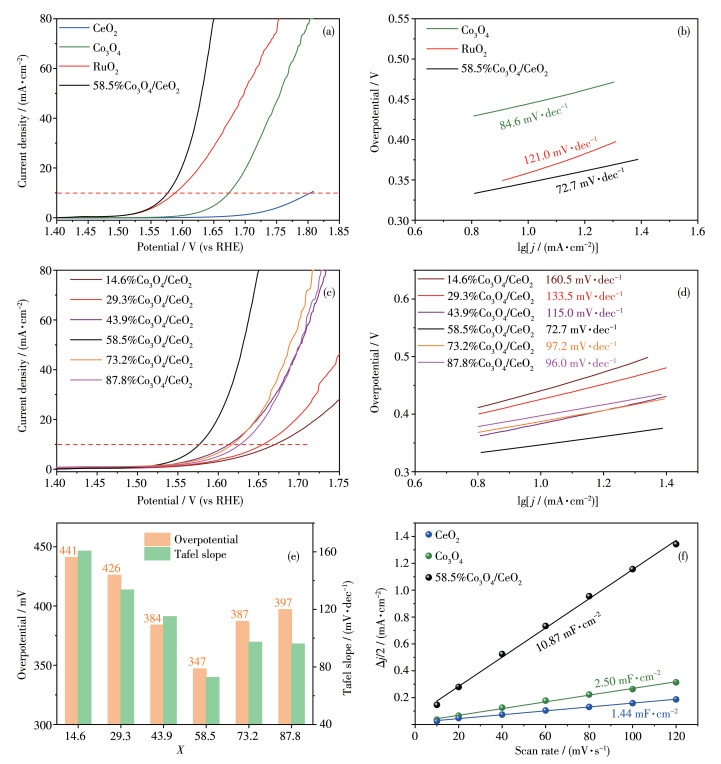
ECSA is also an important parameter to evaluate the OER performance of electrocatalysts. ECSAs can be calculated by ECSA=Cdl/Cs, where Cdl is the double layer capacitances and Cs is the specific capacitance of planar surface with an atomically smooth under identical electrolyte conditions (Cs=40 μF·cm-2 in our case)[38]. Cdl was determined from the CV curves (Fig.S1 in electronic supporting information (ESI)) measured in a potential range according to the following equation: Cdl= (ja-jc)/(2v) = Δj/(2v), where ja and jc are the anodic and cathodic voltammetric current densities, respectively, and v is the scan rate. The Cdl values of all the samples are displayed in Fig. 5f and 6a (the ECSAs were included in Table S1 from ESI).
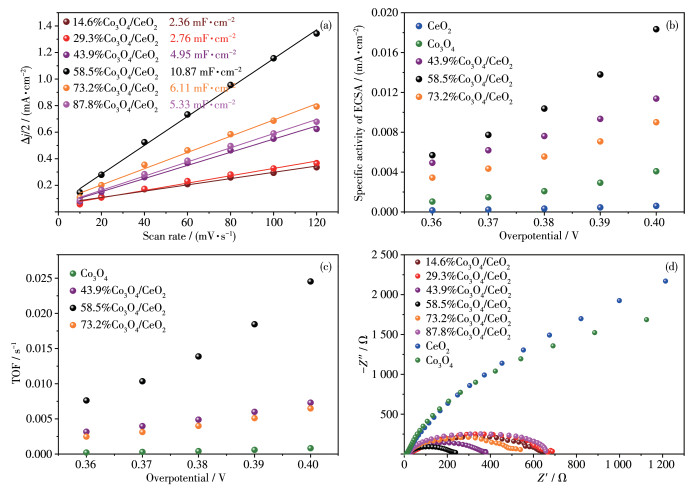
The specific activities were calculated by j/ECSA (where j is current density), as shown in Fig. 6b. The turnover frequency (TOF) was calculated by formula TOF=jA/(4Fn), where j is current density at overpotentials of 0.36~0.40 V, and A is the geometry area of the glassy carbon electrode, and F is the Faraday constant (96 485 C·mol-1), and n is the number of moles of the active materials for OER, assuming that all metal ions in the samples are active[39-40]. The relativity of TOF to overpotentials are shown in Fig. 6c. So 58.5%Co3O4/CeO2 possesses the strongest activity and its OER activity is also superior to the majority of other types of materials (Table S2 from ESI). It is attributed that low or appropriate loading amounts of Co3O4 provide many active sites, and the excess loading amounts of Co3O4 could occupy the surface active sites.
EIS measurements (Fig. 6d) were performed at a potential of 0.6 V (vs Hg/HgO) to investigate the interfacial properties between the electrolyte and electrode. The semicircle of Nyquist plots in the high-frequency region represents a charge transfer process. Clearly, all X% Co3O4/CeO2 composites exhibit smaller arc radii than those of pure Co3O4 and CeO2 due to the electron transfer on the interface of 58.5%Co3O4/CeO2 (XPS results), and the 58.5%Co3O4/CeO2 possesses the smallest arc radius, illustrating the lowest charge transfer resistance, which raises the electron transfer efficiency in OER process.
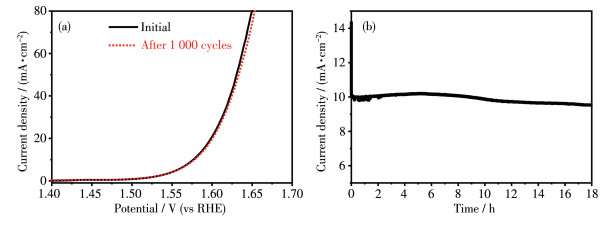
Stability is an indispensable metrics to evaluate OER catalysts. The LSV curve of 58.5%Co3O4/CeO2 composites remained almost the same as the initial curve after 1 000 cycle scans (Fig. 7a). Besides, the electrochemical chronoamperometry measurement (Fig. 7b) shows that the 58.5%Co3O4/CeO2 catalyst performed an outstanding stability with almost unchanged potential at a current density of 10 mA·cm-2 for 18 h in an alkaline electrolyte. After the stability was measured, XRD patterns of the samples were still coexistence of Co 3O4 and CeO2 (as shown in Fig.S2 from ESI). Moreover, the XPS spectra of 58.5%Co3O4/CeO2 obtained after the stability test showed almost no change compared with the sample before the test, indicating that 58.5%Co3O4/CeO2 possesses a good stability (as shown in Fig.S3 from ESI).
Co3O4/CeO2 heterojunction oxides with different mass ratios were prepared by a simple two-step method (solvothermal and impregnation method). Their electrocatalytical properties for OER were measured in alkaline media. 58.5%Co3O4/CeO2 composite oxides displayed excellent properties which possesses an overpotential of 347 mV and a Tafel slope of 72.7 mV·dec-1 at the current density of 10 mA·cm-2 and had a good stability. The effect that electrons transfer from Co3O4 to CeO2 results in the increase of oxygen vacancies of CeO2 may be the key factors to promote the OER.
Supporting information is available at http://www.wjhxxb.cn
Roger I, Shipman M A, Symes M D. Nat. Rev. Chem. , 2017, 1: 0003 doi: 10.1038/s41570-016-0003
Lü F, Bao H H, Mi Y Y, Liu Y F, Sun J Q, Peng X Y, Qiu Y, Zhuo L C, Liu X J, Luo J. Sustainable Energy Fuels, 2020, 4: 1012-1028 doi: 10.1039/C9SE00776H
Li X R, Yang X C, Xue H G, Pang H, Xu Q. EnergyChem, 2020, 2: 100027-100056 doi: 10.1016/j.enchem.2020.100027
Li Q, Li X R, Gu J W, Li Y L, Tian Z Q, Pang H. Nano Res. , 2021, 14: 1405-1412 doi: 10.1007/s12274-020-3190-1
McCrory C C L, Jung S, Ferrer I M, Chatman S M, Peters J C, Jaramillo T F. J. Am. Chem. Soc. , 2015, 137(13): 4347-4357 doi: 10.1021/ja510442p
Friebel D, Louie M W, Bajdich M, Sanwald K E, Cai Y, Wise A M, Cheng M J, Sokaras D, Weng T C, Alonso-Mori R, Davis R C, Bargar J R, Nørskov J K, Nilsson A, Bell A T. J. Am. Chem. Soc. , 2015, 137(3): 1305-1313 doi: 10.1021/ja511559d
Zheng S S, Zheng Y, Xue H G, Pang H. Chem. Eng. J. , 2020, 395: 125166-125173 doi: 10.1016/j.cej.2020.125166
Qin Q, Jang H, Chen L L, Nam G, Liu X E, Cho J. Adv. Energy Mater. , 2018, 8(29): 1801478-1801489 doi: 10.1002/aenm.201801478
Gu P, Zheng M B, Zhao Q X, Xiao X, Xue H G, Pang H. J. Mater. Chem. A, 2017, 5(17): 7651-7666 doi: 10.1039/C7TA01693J
Peng X Y, Zhao S Z, Mi Y Y, Han L L, Liu X J, Qi D F, Sun J Q, Liu Y F, Bao H H, Zhuo L C, Xin H L, Luo J, Sun X M. Small, 2020, 16(33): 2002888-2002897 doi: 10.1002/smll.202002888
Wang Q, Shang L, Shi R, Zhang X, Zhao Y F, Waterhouse G I N, Wu L Z, Tung C H, Zhang T R. Adv. Energy Mater. , 2017, 7(21): 1700467-1700473 doi: 10.1002/aenm.201700467
Amiinu I S, Liu X B, Pu Z H, Li W Q, Li Q D, Zhang J, Tang H L, Zhang H N, Mu S C. Adv. Funct. Mater. , 2018, 28(5): 1704638-1704646 doi: 10.1002/adfm.201704638
Mi Y Y, Qiu Y, Liu Y F, Peng X Y, Hu M, Zhao S Z, Cao H Q, Zhuo L C, Li H Y, Ren J Q, Liu X J, Luo J. Adv. Funct. Mater. , 2020, 30(31): 2003438-2003447 doi: 10.1002/adfm.202003438
Yang L, Cai Z, Hao L, Xing Z P, Dai Y, Xu X, Pan S Y, Duan Y Q, Zou J L. ACS Appl. Mater. Interfaces, 2017, 9(27): 22518-22529 doi: 10.1021/acsami.7b04997
Liu Z Q, Li N, Zhao H Y, Zhang Y, Huang Y H, Yin Z Y, Du Y P. Chem. Sci. , 2017, 8(4): 3211-3217 doi: 10.1039/C6SC05408K
Kim J H, Shin K, Kawashima K, Youn D H, Lin J, Hong T E, Liu Y, Wygant B R, Wang J, Henkelman G, Mullins C B. ACS Catal. , 2018, 8(5): 4257-4265 doi: 10.1021/acscatal.8b00820
Li D J, Gu Z G, Zhang W H, Kang Y, Zhang J. J. Mater. Chem. A, 2017, 5(38): 20126-20130 doi: 10.1039/C7TA06580A
Liu M M, Ji Z Y, Shen X P, Zhou H, Zhu J, Xie X L, Song C, Miao X L, Kong L R, Zhu G X. Eur. J. Inorg. Chem. , 2018(35): 3952-3959
Ji Y Y, Liu J T, Hao S, Xiao Y, Li L, Liu X Q. Inorg. Chem. Front. , 2020, 7(13): 2533-2537 doi: 10.1039/D0QI00437E
Sung M C, Lee G H, Kim D W. J. Alloys Compd. , 2019, 800: 450-455 doi: 10.1016/j.jallcom.2019.06.047
Jiang S H, Zhang R Y, Liu H X, Rao Y, Yu Y N, Chen S, Yue Q, Zhang Y N, Kang Y J. J. Am. Chem. Soc. , 2020, 142(14): 6461-6466 doi: 10.1021/jacs.9b13915
Feng J X, Ye S H, Xu H, Tong Y X, Li G R. Adv. Mater. , 2016, 28(23): 4698-4703 doi: 10.1002/adma.201600054
Wang C, Lv X S, Zhou P, Liang X Z, Wang Z Y, Liu Y Y, Wang P, Zheng Z K, Dai Y, Li Y J, Whangbo M H, Huang B B. ACS Appl. Mater. Interfaces, 2020, 12(26): 29153-29161
Yang X, Tao Z X, Wu Y M, Lin W, Zheng J. J. Alloys Compd. , 2020, 828: 154394-154400 doi: 10.1016/j.jallcom.2020.154394
Gao W, Wang C, Ma F Y, Wen D. Electrochim. Acta, 2019, 320: 134608-134615 doi: 10.1016/j.electacta.2019.134608
Hou Y H, Liu Y P, Gao R Q, Li Q J, Guo H Z, Goswami A, Zboril R, Gawande M B, Zou X X. ACS Catal. , 2017, 7(10): 7038-7042 doi: 10.1021/acscatal.7b02341
Wang W, Zhu S N, Chen X L, Zhang X Y, Tao Y R, Zhang Y X, Xiang R Z, Wu X C. Nanotechnology, 2020, 31(47): 475402-475414 doi: 10.1088/1361-6528/abaf80
Qi Y, Ye J W, Zhang S Q, Tian Q Z, Xu N, Tian P, Ning G L. J. Alloys Compd. , 2019, 782: 780-788 doi: 10.1016/j.jallcom.2018.12.111
Pang H, Li X R, Zhao Q X, Xue H G, Lai W Y, Hu Z, Huang W. Nano Energy, 2017, 35: 138-145 doi: 10.1016/j.nanoen.2017.02.044
Sun Y, Huang F Z, Li S K, Shen Y H, Xie A J. Nano Res. , 2017, 10(10): 3457-3467 doi: 10.1007/s12274-017-1557-8
Li X R, You S J, Du J N, Dai Y, Chen H, Cai Z, Ren N Q, Zou J L. J. Mater. Chem. A, 2019, 7(45): 25853-25864 doi: 10.1039/C9TA08926H
Khalid M, Honorato A M B, Ticianelli E A, Varela H. J. Mater. Chem. A, 2018, 6(25): 12106-12114 doi: 10.1039/C8TA02926A
Lu Z Y, Wang H T, Kong D S, Yan K, Hsu P C, Zheng G Y, Yao H B, Liang Z, Sun X M, Cui Y. Nat. Commun. , 2014, 5: 4345-4351 doi: 10.1038/ncomms5345
Lv L, Zha D C, Ruan Y J, Li Z S, Ao X, Zheng J, Jiang J J, Chen H M, Chiang W H, Chen J, Wang C D. ACS Nano, 2018, 12(3): 3042-3051 doi: 10.1021/acsnano.8b01056
Liu B, Li C M, Zhang G Q, Yao X S, Chuang S S C, Li Z. ACS Catal. , 2018, 8(11): 10446-10456 doi: 10.1021/acscatal.8b00415
Zhuang L Z, Jia Y, He T W, Du A J, Yan X C, Ge L, Zhu Z H, Yao X D. Nano Res. , 2018, 11(6): 3509-3518 doi: 10.1007/s12274-018-2050-8
Wang W, Zhu Q, Qin F, Dai Q G, Wang X Y. Chem. Eng. J. , 2018, 333: 226-239 doi: 10.1016/j.cej.2017.08.065
Zhang G G, Yuan J Y, Liu Y, Lu W, Fu N Q, Li W F, Huang H T. J. Mater. Chem. A, 2018, 6(22): 10253-10263 doi: 10.1039/C8TA02542H
Zhao S L, Li M, Han M, Xu D D, Yang J, Lin Y, Shi N E, Lu Y N, Yang R, Liu B T, Dai Z H, Bao J C. Adv. Funct. Mater. , 2018, 28(18): 1706018-1706028 doi: 10.1002/adfm.201706018
Gao M R, Sheng W C, Zhuang Z B, Fang Q R, Gu S, Jiang J, Yan Y S. J. Am. Chem. Soc. , 2014, 136(19): 7077-7084 doi: 10.1021/ja502128j

Figure 3 (a) SEM image of CeO2; (b) SEM image, (c) elemental mappings, (d) TEM image, (e) HRTEM image and (f) SAED pattern of 58.5%Co3O4/CeO2

Figure 4 (a) XPS survey spectra of 58.5%Co3O4/CeO2; (b) High-resolution Co2p XPS spectra of Co3O4 and 58.5%Co3O4/CeO2; High-resolution (c) Ce3d and (d) O1s XPS spectra of CeO2 and 58.5%Co3O4/CeO2

Figure 5 (a) LSV and (b) Tafel curves of CeO2, Co3O4, RuO2 and 58.5%Co3O4/CeO2; (c) LSV and (d) Tafel curves of X%Co3O4/CeO2 with different loads; (e) Dependence of overpotential and Tafel slope on X%Co3O4/CeO2; (f) Cdl of CeO2, Co3O4 and 58.5%Co3O4/CeO2

Figure 6 (a) Cdl of X%Co3O4/CeO2; (b) Relativity of specific activity to overpotentials; (c) Relativity of the TOF to overpotentials; (d) Nyquist curves of CeO2, Co3O4 and X%Co3O4/CeO2

 扫一扫看文章

扫一扫关注我们
 下载:
下载:

 下载:
下载:

