Scheme 1.
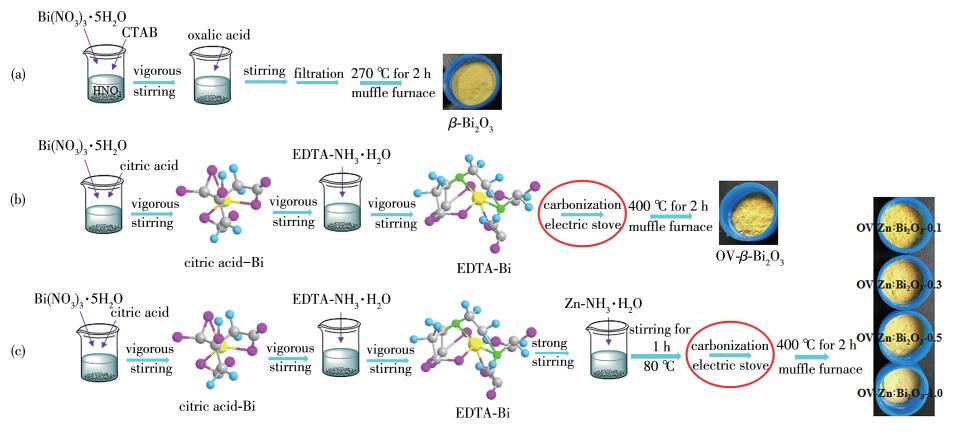
Schematic illustration of preparation for traditional β-Bi2O3 (a), OV-β-Bi2O3 (b) and OV-Zn: Bi2O3 series (c)
Enhancement of Visible-Light Catalytic Activity for Zn Doped OV-β-Bi2O3: Regulation of Electronic Structure and Promotion of Charge Separation
Ya-Wen ZHAO , Jun-Ke ZHANG , Cai-Xia FENG , Jia-Peng XU , Rui DU , Hua HU , Yan-Mei ZHOU , Shan-Hu LIU , Yan-Hong LIU

Over the past decades, visible-light-active Bi based compounds are recommended as a category of the hottest photocatalysts, which is because Bi3+ ion in the crystal lattice exhibits unique d10 configuration and 6s2 lone pair electrons. Such an electronic structure contributes to promoting the transfer of photogenerated carriers and the regulation of band gap by the orbital hybridization of Bi3+ with other ions[1-2]. Among various Bi based photocatalysts, Bi2O3 is the simplest and foremost one, thanks to its innocuity, adjustable band gap and high oxidation power of valence band (VB) hole[3-5]. Generally, Bi2O3 has five different polymorphs, i.e., monoclinic α, tetragonal β, body-centered cubic γ, face-centered cubic δ and triclinic ω-phases[6-9]. Among them, β-Bi2O3 usually exhibits the best visible-light activity for its smaller band gap and unique tunnel structure[6]. However, β-Bi2O3 still doesn't have sufficient efficiency for the photocatalytic application due to its fast recombination of light-induced hole and electron. So, many researchers have tried to adopt various modification methods to improve the photocatalytic performance of β-Bi2O3 under visible light irradiation, such as doping transition metal ions[9-11] and constructing heterojunction semiconductor[12-14]. Impurity doping in β-Bi2O3 has been confirmed to be an effective strategy to improve its visible light activity. Luo et al. found that Gd-doped β-Bi2O3 showed much higher photocatalytic activity for the photodegradation of phenol than pure β-Bi2O3, since the doped Gd3+ ion serves as an efficient scavenger to entrap photo-generated electrons thereby effectively separating photoinduced electron-hole pairs[9]. Liang et al. reported that Fe-doped β-Bi2O3 photocatalyst with 4% molar fraction of Fe displayed desired photocatalytic activity, because Fe doping provides the photocatalyst with the ability to promote the migration of electron-hole pairs, thereby adding to photocatalytic activity[10]. Besides doped ions, oxygen vacancy (OV) often was introduced into semiconductor to improve the light absorption and charge separation ability of catalyst[15-17]. Lu et al. pointed out that the construction of oxygen vacancies on the surfaces of photocatalyst can improve the visible light absorption, target air pollutants enrichment and electron mobility[16]. However, most of the OV-modified photocatalysts are synthesized under a harsh condition such as in a hydrogen or nitrogen atmosphere or under vacuum deoxidation condition[16, 19-20]. The OV produced by this method is unstable and easy to be filled by oxygen in air atmosphere. Therefore, it is very essential for the development of a facial and controllable method to generate stable oxygen defect photocatalysts.
In this work, we prepared Zn-doped OV-β-Bi2O3 nanoparticles (OV-Zn: Bi2O3) with two crystal defects, OV and doped Zn2+, via a sol-gel method followed by in-situ carbon thermal reduction treatment. The OV in OV-Zn: Bi2O3 samples is stable and controllable by regulating the content of doped Zn2+. As a reference, traditional β-Bi2O3 without OV and OV-β-Bi2O3 having OV but without doped Zn2+ were also synthesized. Various characterization methods were adopted to investigate the effect of OV and doped Zn2+ on the improvement of photocatalytic activity of OV-Zn: Bi2O3 series.
OV-Zn: Bi2O3 catalyst was synthesized via a simple sol-gel method followed by in-situ carbon thermal reduction treatment. Typically, 0.072 mol of citric acid monohydrate and 0.015 mol of Bi(NO3)3·5H2O were dispersed in 30 mL of distilled water and ultrasonicated for 10 min to form a transparent sol. The as-obtained sol was stirred vigorously for 30 min while the ammonia solution of disodium ethylenediaminetetra acetate (EDTA) was slowly added to afford a new sol denoted as sol A. 1.5 mmol of Zn(CH3COO)2·2H2O was dissolved in 5 mL of ammonia and stirred to form sol B. The as-obtained sol B was dropped into sol A under stirring with a water-bath (80 ℃) for 1 h to afford sol C. After being cooled to room temperature, 2 mL of sol C was carbonized in an electric furnace to obtain a viscous black product at 300 ℃. The viscous black product was further calcined at 400 ℃ for 2 h to yield a yellow powder, OV-Zn: Bi2O3-0.1 with a theoretical molar ratio (nZn/nBi) of 0.1. A series of Zn-doped OV-β-Bi2O3 phtocatalysts with theoretical nZn/nBi of 0.3, 0.5 and 1.0 were prepared in the same manners while the amount of Zn(CH3COO)2·2H2O was adjusted to be 4.5, 7.5 and 15.0 mmol. Corresponding products were labeled as OV-Zn: Bi2O3-0.3, OV-Zn: Bi2O3-0.5 and OV-Zn: Bi2O3- 1.0, respectively. Pure OV-β-Bi2O3 powder with abundant oxygen vacancies but without doped Zn2+ was also prepared with the same procedure in the absence of Zn(CH3COO)2·2H2O.
For comparison, traditional β-Bi2O3 powder without OV was prepared by the precipitation method[21-22]. Briefly, 2 g of Bi(NO3)3·5H2O and 0.1 g of CTAB (cetyltrimethyl ammonium bromide) were both dissolved in 20 mL of nitric acid (1 mol·L-1) solution with stirring for 20 min. Then, 0.4 g of oxalic acid was added in above solution and reacted under stirring for 30 min. The white precipitate was filtered, washed and calcined at 270 ℃ to obtain the yellow powder, traditional β-Bi2O3.
A JSM-7610F scanning electron microscope (SEM) was performed with an accelerating voltage of 15 kV to observe the morphology and microstructure of as-prepared traditional β-Bi2O3, OV-β-Bi2O3 and OV-Zn: Bi2O3 series. The crystal structure of the catalysts was characterized using a Bruker D8 X-ray powder diffractometer equipped with Cu Kα radiation source (λ = 0.154 8 nm); the tube current was 40 mA, operating voltage was 40 kV, and the scan range was 5°≤2θ≤70°. A Thermo Fisher Scientific Escalab 250Xi X-ray photoelectron spectrometer (XPS, monochromatic Al Kα excitation source) was deployed to analyze the chemical states of as-prepared photocatalysts. The ultravioletvisible light diffuse reflectance spectra (UV-Vis DRS) of as-prepared photocatalysts were recorded with a PE Lambda 950 spectrometer equipped with an integrating sphere attachment. Electron spin resonance (ESR) spectra were obtained with a Bruker E500 apparatus. The measurement was conducted at room temperature in ambient air, without vacuum-pumping. The g-tensors of the ESR signals were obtained by setting g of diphenyl picryl hydrazyl (DPPH, g=2.003 6) as the reference. The photoluminescence (PL) spectra of the products were obtained with a PuXi TU-1900 fluorescence spectrophotometer under the excitation at 380 nm. The photocurrent response and voltammogram (I-V) curve were measured at CHI 650E electrochemical workstation (Chenhua Instrument Company) with a three -electrode system including a modified ITO glass as working electrode, a platinum wire as counter electrode and an Ag/AgCl electrode as reference. A 300 W xenon lamp with a 420 nm cutoff filter was used as a visible light source.
The photocatalytic activity of as-prepared photocatalysts were evaluated by the degradation of methylene blue (MB) and 2, 4, 6-trichlorophenol (2, 4, 6-TCP) in a glass cylindrical reactor under visible light irradiation (300 W xenon lamp equipped with a 420 nm cutoff filter). The reactor was surrounded by a water-cooling system so as to ensure that the photocatalytic reaction occurs at room temperature. In each experiment, 100 mg of the to-be-tested photocatalysts was suspended in 150 mL MB or 2, 4, 6-TCP solution, which concentrations were all 10 mg·L-1. Differently, the light intensity for the degradation of MB was 23 mW·cm-2 and that for 2, 4, 6-TCP was 45 mW·cm-2. Prior to illumination, the suspension was fiercely stirred in dark for 1 h until the absorption-desorption balance was achieved. During the photocatalytic reaction, 5 mL of the suspension was taken at certain time intervals to determine the concentration of MB and 2, 4, 6-TCP by UV-Vis spectro- photometry (TU-1810, Puxi Instrument Company, China) at the maximum absorption wavelength of 665 nm and 310 nm, respectively. The degradation rate of pollutant was calculated as (c0-c)/c0×100%, where c0 refers to the initial concentration of pollutant after the adsorption-desorption equilibrium was reached, and c is the concentration of pollutant measured at a certain time interval during the photocatalytic reaction process.
Scheme 1 displays the schematic diagram for preparation process of traditional β-Bi2O3, OV-β-Bi2O3 and OV-Zn: Bi2O3 series. For OV-β-Bi2O3 and OV-Zn: Bi2O3, the critical step marked by red circle in diagram is the carbonization of EDTA-Bi complex on an electric stove. The reductive carbon produced in the carbonization process can reduce Bi3+ in the subsequent calcination process, resulting in the escaping of some oxygen atoms in β-Bi2O3 or Zn-doped Bi2O3 and leading to the formation of OV-β-Bi2O3 and OV-Zn: Bi2O3.
Fig. 1a depicts the XRD patterns of traditional β-Bi2O3, OV-β-Bi2O3 and OV-Zn: Bi2O3 series with different nZn/nBi. The diffraction peaks of β-Bi2O3, OV-β-Bi2O3 and OV-Zn: Bi2O3 series at 2θ =27.94°, 31.76°, 32.69°, 46.21°, 46.90°, 54.26°, 55.48° and 57.75° are indexed to the (201), (002), (220), (222), (400), (203), (421) and (402) crystal planes of tetragonal β-Bi2O3 (PDF No. 27-0050)[10-11], indicating that all as-prepared catalysts possess the same crystal structure. OV-Zn: Bi2O3 catalysts with a nZn/nBi of 0.1~1.0, i. e., OV-Zn: Bi2O3-0.1, OV-Zn: Bi2O3-0.3, OV-Zn: Bi2O3-0.5 and OV-Zn: Bi2O3-1.0, showed the same XRD patterns as traditional β-Bi2O3 and OV-β-Bi2O3 did. And all the OV-Zn: Bi2O3 photocatalysts did not show diffraction peaks of zinc oxide. Moreover, the enlarged XRD patterns shown in Fig. 1b demonstrate that the (201) peak of the OV-Zn: Bi2O3 photocatalysts tended to slightly shift towards lower 2θ value with the increase of zinc concentration. This means that as -prepared OV-Zn: Bi2O3 photocatalysts do not consist of the mixtures of Bi2O3 and ZnO phases but Zn-doped tetragonal Bi2O3. It is generally recognized that there are two modes of ion doping, substitutional doping and interstitial doping. The ionic radii of Bi3+ ion and Zn2+ ion are 0.103 and 0.074 nm, respectively[23]. On one hand, if the lattice sites of Bi3+ in Bi2O3 crystal are partly substituted by smaller Zn2+ ion, the lattice parameters of Bi2O3 would decrease in association with the slight shift of the XRD peaks towards higher 2θ values. This supposition, however, is not supported by the above-mentioned XRD data. On the other hand, if some Zn2+ ions are doped in Bi2O3 crystal by way of interstitial doping, the volume of Bi2O3 crystal cell would be expanded and the distance of the crystal plane (d spacing) would be increased. This supposition, indeed, is supported by relevant XRD data. Namely, according to Bragg's law, 2dsinθ= nλ, the decrease of θ refers to the increase of d; and the volume expansion of the OV-β-Bi2O3 crystal cell after Zn doping proves that Zn2+ ion is doped into OV-β-Bi2O3 crystal via interstitial doping to afford the OV-Zn: Bi2O3 photocatalysts in this work.
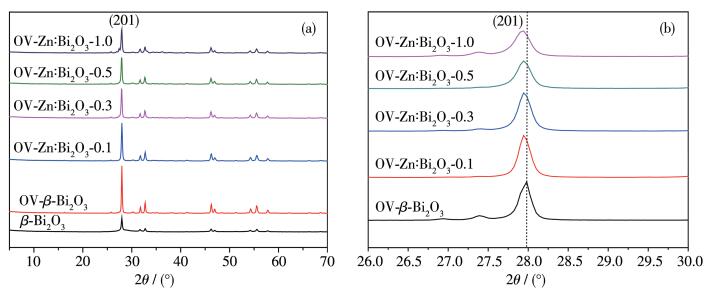
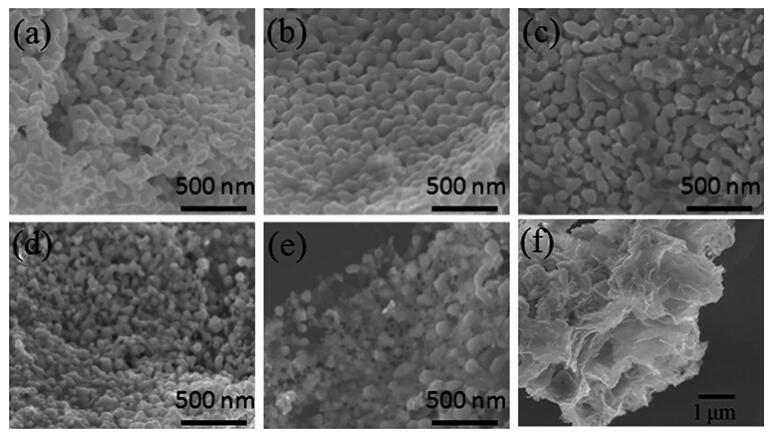
Fig. 2 shows the SEM images of traditional β-Bi2O3, OV-β-Bi2O3 and OV-Zn: Bi2O3 series with different Zn content. It can be seen that both OV-β-Bi2O3 and OV-Zn: Bi2O3 series exhibited similar spherical shape and had an average size of 100 nm (Fig. 2a~2e). This indicates that the doping of zinc has little effect on the morphology of OV-β-Bi2O3. Compared to OV-β-Bi2O3, traditional β-Bi2O3 prepared by the precipitation method consisted of many nano-sheets with thickness of about 10 nm (Fig. 2f), which was consistent with that reported in the literature[21] and might be the reason for much larger specific surface area of 10 m2·g-1 than that of OV-β-Bi2O3 with a value of 2 m2·g-1.
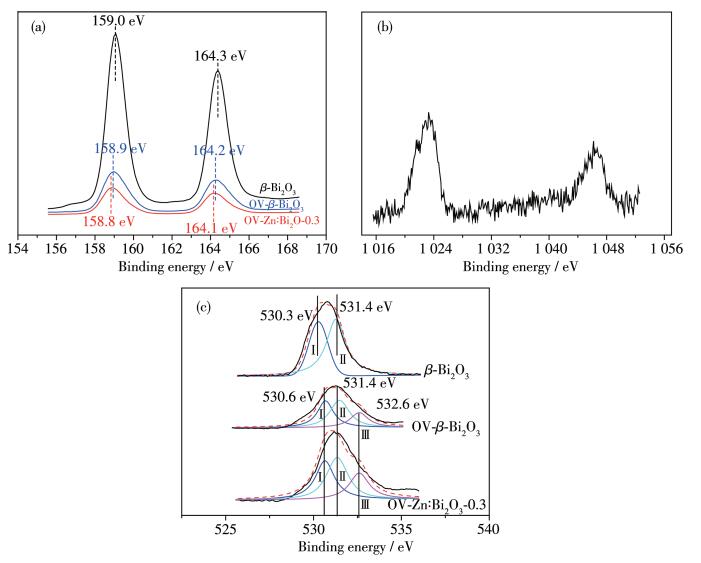
The chemical states of related elements in as-prepared samples were analyzed by XPS. Fig. 3a shows the high-resolution XPS spectra of Bi4f in traditional β-Bi2O3, OV-β-Bi2O3 and OV-Zn: Bi2O3-0.3. Compared to traditional β-Bi2O3, the Bi4f peaks of OV-β-Bi2O3 and OV-Zn: Bi2O3-0.3 shifted to the lower binding energies, indicating that the Bi atom in both samples with OV has higher electron density (or lower chemical valence) than that in β-Bi2O3 due to the charge compensation. The absence of partial oxygen atoms can reduce the coordination number of Bismuth ion leading to the decrease of binding energy of Bi4f. The Zn2p3/2 and Zn2p1/2 peaks of OV-Zn: Bi2O3-0.3 were centered at 1 022.9 and 1 046.1 eV (Fig. 3b), which means that the doped Zn is present in the form of Zn2+ in Zn-doped β-Bi2O3[24]. Besides, as shown in Fig. 3c, the O1s spectrum of traditional β-Bi2O3 was split into two peaks, Ⅰ and Ⅱ: peak Ⅰ at 530.3 eV is assigned to the lattice oxygen in β-Bi2O3 crystal and peak Ⅱ at 531.4 eV is as- cribed to adsorbed oxygen in the form of hydroxyl group[7, 15, 25-26]. Different with traditional β-Bi2O3, a new peak Ⅲ appeared for OV-β-Bi2O3 and OV-Zn: Bi2O3-0.3, which was situated at about 532.6 eV corresponding to the OV defect[7, 27].
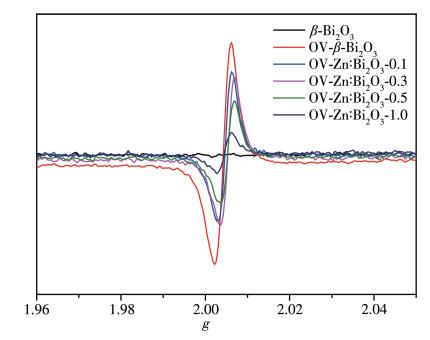
ESR test was adopted to confirm the existence of oxygen vacancies in OV-β-Bi2O3 and OV-Zn: Bi2O3 series as a direct and sensitive way. As shown in Fig. 4, no ESR signal could be observed for traditional β-Bi2O3. While there was a strong symmetric ESR peak for OV-β-Bi2O3 and OV-Zn: Bi2O3 series both having a center at g=2.004, which is attributed to single-electron-trapped OV (VO·) with a positive charge[28-29]. For OV-Zn: Bi2O3 series, XRD results suggested that Zn2+ ion is doped into OV-β-Bi2O3 crystal via interstitial doping not substitution, which leads to more positive charge in semiconductor. So, with the increase of the doped Zn2+ content, the concentration of VO· decreased and the intensity of ESR signal decreased gradually. This demon- strats that the concentration of OV may be modulated by the amount of doped Zn2+ in OV-Zn: Bi2O3 series. Many studies reported that, OV can not only broaden the photoabsorption range of the catalyst but also serve as trapping center for excited electrons to improve the separation efficiency of photogenerated carriers[16, 30]. To study the trapping role of OV, many ESR spectra under laser irradiation of different catalysts will be further compared.
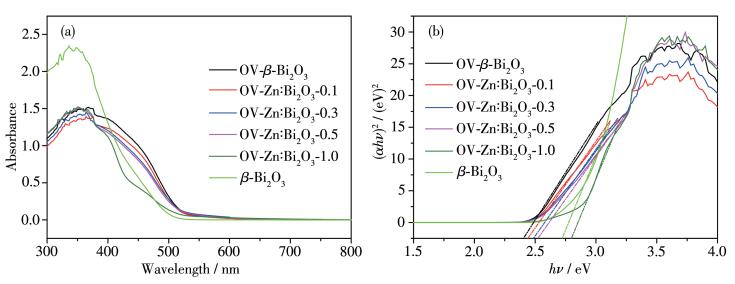
It is well known that both OV and doped ions can change the optical absorption and electronic energy structure of semiconductor, which can be determined by UV-Vis DRS. Fig. 5a shows the UV-Vis DRS spectra of traditional β-Bi2O3, OV-β-Bi2O3 and OV-Zn: Bi2O3 samples with different nZn/nBi. The absorption edge of traditional β-Bi2O3 was approximately 460 nm. The absorption range of OV-β-Bi2O3 was clearly broadened, with the absorption edge extending to approximately 500 nm. For OV-β-Bi2O3, which has the wider light absorption range, more electron-hole pairs can be generated to participate in photocatalytic reaction under visible light irradiation. Compared with OV-β-Bi2O3, the absorption edge of OV-Zn: Bi2O3 samples gradually blue-shifted to shorter wavelength with the increase of Zn content. However, the absorption range of nearly all OV-Zn: Bi2O3 samples, except OV-Zn: Bi2O3-1.0, was still wider than that of traditional β-Bi2O3. The band gap can be estimated using the following equation (Eq.1):
|
|
(1) |
Where α, ν, A and Eg are absorption coefficient, light frequency, a constant and band gap energy, respectively. The value of n is 1 for direct transition and 4 for indirect transition of semiconductor. According to the literature[9], the value of n is 1 for β-Bi2O3. The band gap energies of traditional β-Bi2O3, OV-β-Bi2O3, OV-Zn : Bi2O3-0.1, OV-Zn: Bi2O3 -0.3, OV-Zn: Bi2O3-0.5 and OV-Zn: Bi2O3-1.0 were estimated from a plot of (αhν)2 vs hν to be 2.72, 2.40, 2.46, 2.50, 2.53 and 2.80 eV, respectively (Fig. 5b).
To further investigate the effect of Zn doping on the VB position of OV-Zn: Bi2O3, we adopted Eq.2 to determine the VB edge position of pure OV-β-Bi2O3 and OV-Zn: Bi2O3 series[31-32].
|
|
(2) |
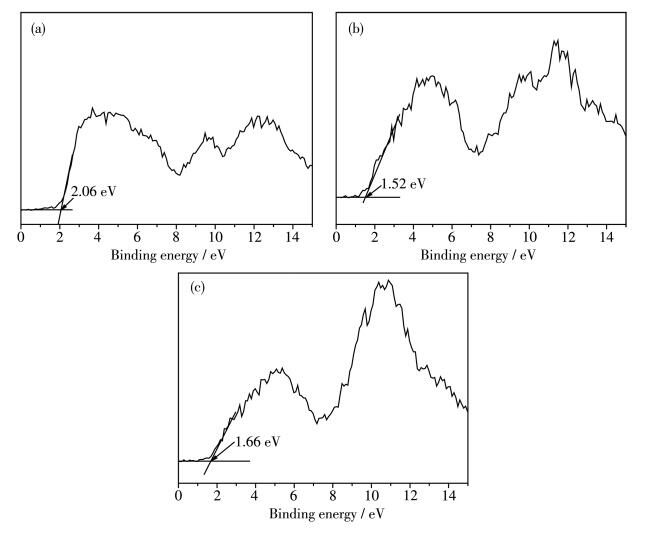
Where Ee is about 4.5 eV on the hydrogen scale; Eg is the band gap of OV-β-Bi2O3 and OV-Zn: Bi2O3; EVB is the valence band edge potential; and X is the absolute electronegativity of the solid (the X value for Bi2O3 was calculated to be 6.24, Supporting information). Simultaneously, the conduction band (CB) position of the samples can be obtained from ECB=EVB-Eg. As shown in Table 1, compared to OV-β-Bi2O3, the VB position of OV-Zn: Bi2O3 samples gradually moved down with the increase of nZn/nBi, which suggests that the oxidizing ca-Bipacity of the photoexcited holes tends to rise with the increase of Zn content. Furthermore, the VB spectra of traditional β-Bi2O3, OV-β-Bi2O3 and OV-Zn: Bi2O3-0.3 as the representative of OV-Zn: Bi2O3 series were mea-Bisured by XPS. As shown in Fig. 6, the VB potentials of OV-β-Bi2O3 and OV-Zn: Bi2O3-0.3 were lower than that of traditional β-Bi2O3 for the narrow band gap due to the existence of OV, and the VB potential of OV-Zn: Bi2O3-0.3 was higher than that of OV-β-Bi2O3, which may imply that the photo-induced holes of OV-Zn: Bi2O3- 0.3 possesses stronger oxidizing ability than that of OV-β-Bi2O3. These results are well consistent with above DRS analysis.
 下载:
导出CSV
下载:
导出CSV
| Catalyst | Eg/eV | EVB/eV | ECB/eV |
| β-Bi2O3 | 2.72 | 3.10 | 0.38 |
| OV-β-Bi2O3 | 2.40 | 2.94 | 0.54 |
| OV-Zn: Bi2O3-0.1 | 2.46 | 2.97 | 0.51 |
| OV-Zn: Bi2O3-0.3 | 2.50 | 2.99 | 0.49 |
| OV-Zn: Bi2O3-0.5 | 2.53 | 3.01 | 0.48 |
| OV-Zn: Bi2O3-1.0 | 2.80 | 3.14 | 0.34 |
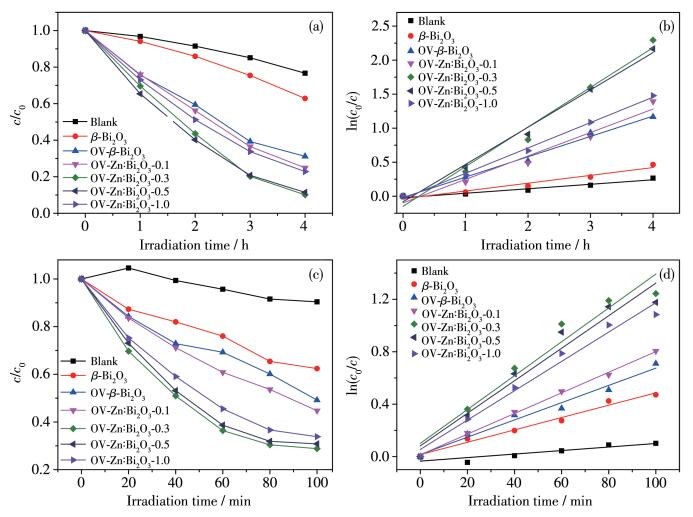
Different pollutants including MB dye and colorless phenol compound, 2, 4, 6-TCP, were employed as the substrate to evaluate the photocatalytic activitiy of traditional β-Bi2O3, OV-β-Bi2O3 and OV-Zn: Bi2O3 samples under visible light irradiation. Fig. 7a and 7b shows the photocatalytic performance of different catalysts toward MB dye degradation with the light intensity of 23 mW·cm-2 (λ=420 nm). It can be seen that, in the absence of any photocatalyst, nearly 80% of MB was retained after 3 h of visible light irradiation. In the presence of traditional β-Bi2O3 and OV-β-Bi2O3, about 40% and 70% of MB was degraded after 4 h of visible light irradiation, respectively, which indicates that, although the specific surface area of OV-β-Bi2O3 was smaller than that of traditional β-Bi2O3, the former promotes much higher degradation rate of MB than the latter for the wider light absorption range resulted from OV. Furthermore, OV-Zn: Bi2O3 catalysts with different nZn/nBi can more efficiently catalyze the degradation of MB under visible light irradiation as compared with OV-β-Bi2O3; and in particular, OV-Zn: Bi2O3-0.3, with aphotocatalytic efficiency similar to that of OV-Zn: Bi2O3-0.5, can catalyze the photodegradation of up to 91% of MB within 4 h of visible light irradiation. The linear relationship between ln(c0/c) and irradiation time for MB degradation is shown in Fig. 7b. The reaction rate constant (k) and linear correlation coefficient (R2) for different catalysts are summarized in Table 2. It can be seen that all as-prepared catalysts had an R2 value of above 0.97, which means that the degradation of MB catalyzed by β-Bi2O3, OV-β-Bi2O3 and OV-Zn: Bi2O3 series is of the first order kinetic nature. Moreover, OV-Zn: Bi2O3-0.3 had the highest rate constant among all the tested catalysts, which demonstrates that the optimal nZn/nBi of OV-Zn: Bi2O3 catalysts should be 0.3.
λ> 420 nm, the light intensities were 23 mW·cm-2 for MB and 45 mW·cm-2 for 2, 4, 6-TCP
下载:
导出CSV
| Catalyst | R2 | k/min-1 |
| β-Bi2O3 | 0.972 | 0.001 91 |
| OV-β-Bi2O3 | 0.995 | 0.004 98 |
| OV-Zn: Bi2O3-0.1 | 0.979 | 0.005 75 |
| OV-Zn: Bi2O3-0.3 | 0.985 | 0.009 71 |
| OV-Zn: Bi2O3-0.5 | 0.995 | 0.009 13 |
| OV-Zn: Bi2O3-1.0 | 0.998 | 0.006 21 |
2, 4, 6-TCP, as a well-known organic pollutant in wastewater of pharmaceutical, paint and pesticide industries, can cause severe nervous system and respiratory disease. Fig. 7c shows the photocatalytic activity of traditional β-Bi2O3, OV-β-Bi2O3 and OV-Zn: Bi2O3 samples toward the degradation of 2, 4, 6-TCP under visible light with the intensity of 45 mW·cm-2 (λ=420 nm). It can be seen that, after irradiation for 100 min, about 51% and 71% of 2, 4, 6-TCP was degraded by OV-β-Bi2O3 and OV-Zn: Bi2O3- 0.3, respectively, while only 37% of 2, 4, 6-TCP was removed over traditional β-Bi2O3 within 100 min. Mover, as illustrated in Fig. 7d, the order of the reaction rate constant in the degradation of 2, 4, 6-TCP was kOV-Zn: Bi2O3-0.3>kOV-Zn: Bi2O3-0.5>kOV-Zn: Bi2O3-1.0>kOV-Zn: Bi2O3-0.1>kOV-β-Bi2O3>kβ-Bi2O3, which was the same with that of the degradation of MB dye, confirming the optimal nZn/nBi of OV-Zn: Bi2O3 catalysts was 0.3.
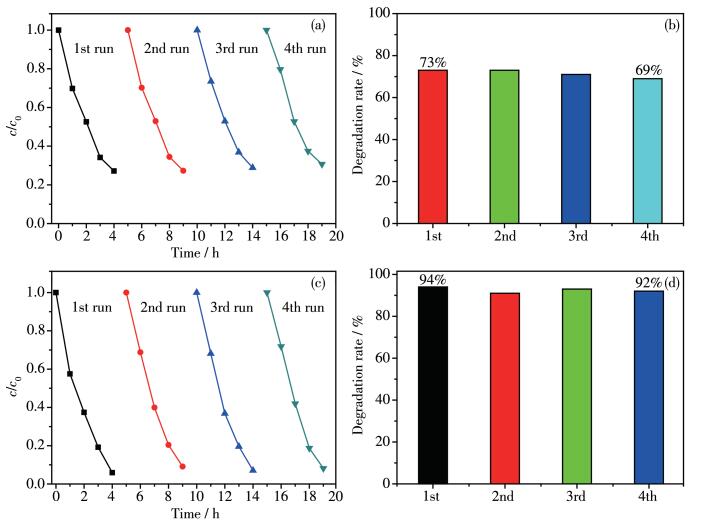
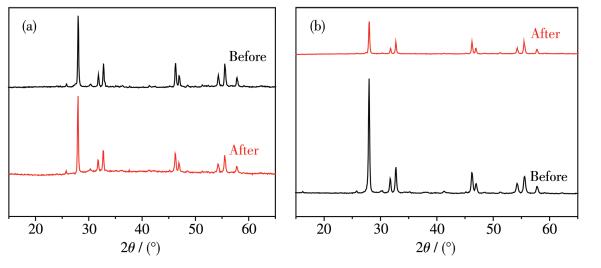
The above systematic photocatalytic experiments revealed that, compared to traditional β-Bi2O3, both OV-β-Bi2O3 and OV-Zn: Bi2O3exhibited superior activity due to the introduction of OV. Moreover, the synergistic effect of OV and doped zinc ions can promote the photocatalytic activity of OV-Zn: Bi2O3 in the degradation of MB and 2, 4, 6-TCP under visible light. In terms of the practical applications of catalysts, the reusability and stability are two vital factors worth special emphasis. Therefore, cycling experiments of OV-β-Bi2O3 and OV-Zn: Bi2O3-0.3 as the representative samples were carried out to evaluate their reusability for the degradation of MB under visible light irradiation. As shown in Fig. 8, after 4 cycles running, the degradation rate of MB in the presence of OV-β-Bi2O3 and OV-Zn: Bi2O3-0.3 decreased slightly. The XRD patterns of OV-β-Bi2O3 and OV-Zn: Bi2O3-0.3 before and after four cycles of the photocatalytic degradation of MB are compared in Fig. 9. It can be seen that, after four-cycle experiments, there was not any change in the crystal structure for both samples, which demonstrates that both OV-β-Bi2O3 and OV-Zn: Bi2O3 possess strong structural stability during the photocatalytic degradation of MB.
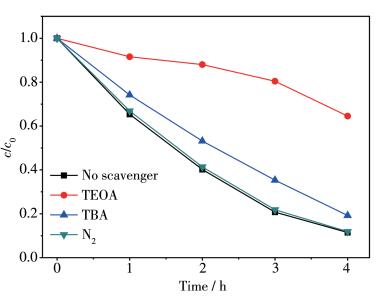
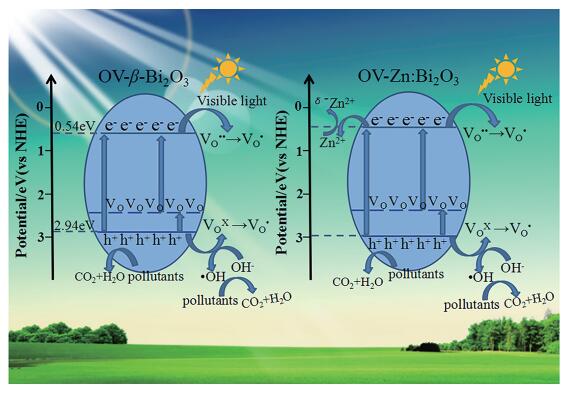
To investigate the active species involved in the MB degradation over OV-Zn: Bi2O3 catalysts, we adopted triethanolamine (TEOA) and tert- butanol (TBA) as the radical scavengers for holes and hydroxyl radicals to conduct trapping experiments[33-35]. And N2 was also added to remove oxygen and prevent the formation of superoxide radicals[36]. Fig. 10 displays the photocatalytic activity of OV-Zn: Bi2O3-0.3 sample for the photocatalytic degradation of MB in the presence of TEOA and TBA (their concentration in the photocatalytic system was 6 mmol·L-1). It can be seen that TEOA could strongly inhibit the photocatalytic activity of OV-Zn: Bi2O3-0.3, which indicates that h+ is the main active species for the degradation of MB. And after the introduction of TBA, the photodegradation of MB was obviously suppressed, which confirms that ·OH also plays an important role in the photocatalytic degradation of MB. This is consistent with DRS results. As shown in Fig. 11, although the electrons in the VB of OV-Zn: Bi2O3-0.3 can be excited to the CB by visible light, the active ·O2- radical cannot be generated, due to the lower potential of O2/·O2- (-0.33 eV (vs NHE)) than that of CB potential of OV-Zn: Bi2O3-0.3 (0.49 eV (vs NHE), Table 1) [37-38]. However, the holes in VB can oxidize OH- (or H2O) to generate ·OH or directly oxidize MB, due to the higher VB potential of OV-Zn: Bi2O3-0.3 (2.99 eV (vs NHE), Table 1) than that of OH-/·OH (2.40 eV (vs NHE)) and H2O/·OH (2.72 eV (vs NHE))[39-40]. These results confirm that h+ and ·OH are the main active species in the photodegradation process of MB over OV-Zn: Bi2O3-0.3 photocatalyst.
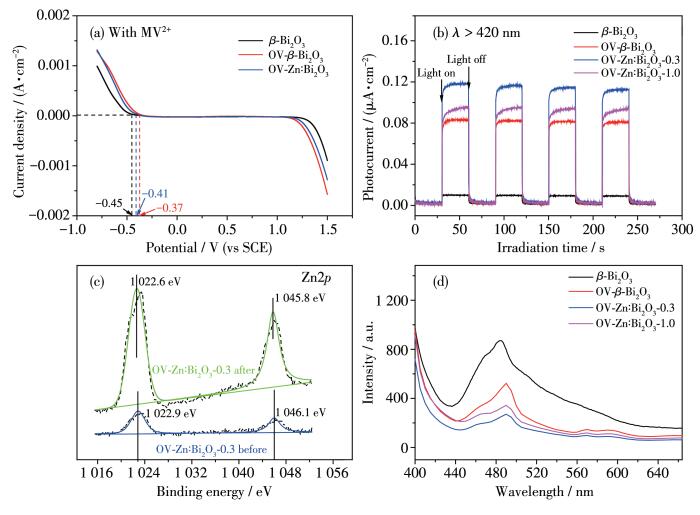
In order to investigate the effect of OV and doped Zn2+ on the improvement of photocatalytic activity, photoelectrochemical experiments were carried out to evaluate the charge carrier density and the photogenerated carrier separation efficiency of different catalysts. The density of charge carriers, which is an important parameter affecting the photocatalytic activity of catalyst, can be obtained by the following Nernst equation:
|
|
(3) |
Herein, Ef1 and Ef2 is the quasi-Fermi level of sample 1 and sample 2, respectively. Nf1 and Nf2 is the carrier density of two samples. In addition, k, T and e are the Boltzmann constant (1.381×10⁻²³ J·K-1), temperature and elementary charge (1.602×10⁻¹⁹ C). With the addition of methylviologen dichloride (MVCl2) serving as the fast electron acceptor, the photocurrent onset potential in a voltammogram can be considered as the quasiFermi level of majority carriers[15, 41-43]. As shown in Fig. 12a, the photocurrent onset potentials of OV-β-Bi2O3 and OV-Zn: Bi2O3-0.3 were-0.37 and -0.41 V, both of which were higher than that of traditional β-Bi2O3 with a value of -0.45 V. According to above Nernst equation, the carrier densities of OV-β-Bi2O3 and OV-Zn: Bi2O3-0.3 were determined as 22.5 and 4.7 times larger than that of traditional β-Bi2O3, respectively. This suggests that the existence of OV can largely increase the charge carrier density of semiconductor by expanding the light absorption range of catalyst. Compared to OV-β-Bi2O3, although the carrier density of OV-Zn: Bi2O3-0.3 was reduced for the wider band gap, the oxidation ability of photogenerated holes was enhanced and the separation efficiency of photo-generated carriers might be increased for the electron trapping role of the doped Zn2+. The transient photocurrent responses of different catalysts under visible light are shown in Fig. 12b. It can be seen that, the photocurrent densities of both OV-β-Bi2O3 and OV-Zn: Bi2O3-0.3 were much larger than that of traditional β-Bi2O3. It demonstrates that the efficient generation and separation of photoinduced electron-hole pairs of both OV-β-Bi2O3 and OV-Zn: Bi2O3 arise from the OV. Moreover, the photocurrent density of OV-Zn: Bi2O3-0.3 was larger than that of OV-β-Bi2O3, suggesting that the doped Zn2+ may also play an important role in promoting the separation efficiency for OV-Zn: Bi2O3 series. Fig. 12c shows the Zn2p XPS spectra of OV-Zn: Bi2O3-0.3 before and after MB degradation reaction. It can be seen that, after reaction, the binding energies of Zn2p1/2 and Zn2p3/2 shifted to lower energy, indicating that parts of doped Zn2+ was reduced by trapped electron to a new chemical state with lower valence. This further confirms that moderate doped Zn2+ can also serve as an electron trapping center to promote the separation of photogenerated carriers. The PL spectra of catalysts can also reflect the separation efficiency of photogenerated electron-hole pairs in semiconductor. It is well known that a stronger PL intensity represents lower separation efficiency and higher recombination rate of the photogenerated charge carriers. Fig. 12d shows the PL spectra of different samples at the excitation wavelength of 380 nm. It can be seen that Iβ-Bi2O3 > IOV-β-Bi2O3 > IOV-Zn: Bi2O3-1.0 > IOV-Zn: Bi2O3-0.3, indicating that EOV-Zn: Bi2O3-0.3 (separation efficiency of OV-Zn: Bi2O3 -0.3) > EOV-Zn: Bi2O3-1.0 > EOV-β-Bi2O3 > Eβ-Bi2O3, which was consistent with transient photocurrent results of catalysts. All the above data suggest that OV and appropriate doped Zn2+ can promote the separation efficiency of photogenerated carriers, however, excessive zinc may also become the recombination center, reducing the catalytic activity of OV-Zn: Bi2O3 series.
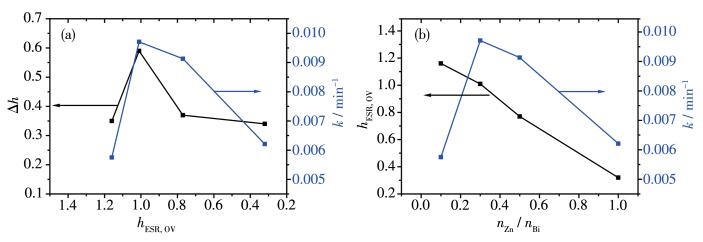
To further study the role of OV in promoting the separation efficiency of photogenerated carriers, the ESR spectra were recorded for OV-Zn: Bi2O3 series under laser irradiation (λ =420 nm) in air. Fig. S1 (Supporting information) are the ESR spectra of OV-Zn: Bi2O3 series, where the dashed and solid lines correspond to the signals before and after laser irradiation, respectively. It can be seen that, the ESR signal intensity of VO· in all catalysts having OV could be increased under visible light irradiation, indicating that the OVs in OV-Zn: Bi2O3 series prepared in this work are very stable and there are more Vo· produced under visible light. It is well known that, besides VO·, there are two other kinds of OV, two-electron-trapped OV (effective charge=0, denoted as VO×) and no-electron-trapped OV (effective charge=+2, denoted as VO··)[27, 29], both of which do not contribute to ESR signals because of the absence of unpaired electrons. Under visible light irradiation, the electrons can be photoexcited to conduction band, leaving the holes in VB. If there are trapping electron centers, i.e., VO·· or trapping hole centers VO× on the surface of catalyst, the electron of the conduction band may be trapped by surface VO·· and the hole of the VB may be captured by surface VO×. Both kinds of OVs transformed into VO· and the signal intensity became stronger accordingly (Fig. 11). The separation efficiency of photogenerated carriers will be also improved. In other words, Δh (Δh=hlight-hdark, hlight and hdark refer to the intensities of ESR signal at g= 2.004 under visible light and in dark, respectively) is closely related to the separation efficiency of photogenerated carriers caused by surface OV. The dependences of Δh and the reaction constant (k) for the degradation of MB by OV-Zn: Bi2O3 series on the intensity of ESR signal for VO· (hESR, OV) are shown in Fig. 13a. It can be seen that with the increase of hESR, OV, both of Δh and kfirst increased and then decreased, suggesting that excessive OV may be detrimental to the activity of catalyst. Fig. 13b shows the dependences of hESR, OV and k for the degradation of MB by OV-Zn: Bi2O3 series on nZn/nBi. It can be seen that, with the increase of doped Zn2+, hESR, OV decreased and there was a peak of reaction con- stant situated at nZn/nBi=0.3 for OV-Zn: Bi2O3-0.3. This suggests that the concentration of OV can be modulated by the doped zinc and excessive zinc doping may also reduce the separation efficiency of photogenerated carriers.
Δh=hlight-hdark; hlight and hdark refer to the intensities of ESR signal at g=2.004 under visible light and in dark, respectively
Two kinds of OV on the surface of catalysts, Vo·· and VO×, can serve as trapping centers of electrons and holes, respectively. And moderate doped Zn2+ can also act as electron capture sites to promote the separation efficiency of photogenerated carriers. Thus, the visible light activity of both OV-β-Bi2O3 and OV-Zn: Bi2O3 series can be improved. Of course, compared to OV-β-Bi2O3, moderate doped Zn2+ can result in the optimal energy level structure for OV-Zn: Bi2O3, and OV-Zn: Bi2O3-0.3 exhibited the highest activity for the degradation of MB and 2, 4, 6-TCP.
OV-β-Bi2O3 and Zn-doped OV-β-Bi2O3 series (OV-Zn: Bi2O3) were prepared by a simple sol-gel method followed by in-situ carbon thermal reduction treatment. The concentration of oxygen vacancy in OV-Zn: Bi2O3 can be modulated by the content of doped zinc. The more the content of doped Zn2+ is, the less the concentration of oxygen vacancy will be. The introduction of oxygen vacancy and moderate zinc can not only regulate the energy structure of OV-Zn: Bi2O3, but also promote the separation efficiency of photogenerated carriers. So, the visible light activity of OV-Zn: Bi2O3 series was superior to that of OV-β-Bi2O 3, and the activity of OV-β-Bi2O3 was better than that of traditional β-Bi2O3. This study offers a new method to prepare the novel visible-light-responsive catalyst with stable controllable oxygen vacancy.
Hou D F, Hu X L, Wen Y W, Shan B, Hu P, Xiong X Q, Qiao Y, Huang Y H. Phys. Chem. Chem. Phys. , 2013, 15(47): 20698-20705 doi: 10.1039/c3cp53945h
Wu X Y, Li M M, Li J, Zhang G K, Yin S. Appl. Catal. B, 2017, 219: 132-141 doi: 10.1016/j.apcatb.2017.07.025
Zhang L S, Wang W Z, Yang J, Chen Z G, Zhang W Q, Zhou L, Liu S W. Appl. Catal. A, 2006, 308: 105-110 doi: 10.1016/j.apcata.2006.04.016
Hameed A, Montini T, Gombac V, Fornasiero P. J. Am. Chem. Soc. , 2008, 130(30): 9658-9659 doi: 10.1021/ja803603y
Sood S, Umar A, Mehta S K, Kansal S K. Ceram. Int. , 2015, 41(3): 3355-3364 doi: 10.1016/j.ceramint.2014.10.038
Xiao X, Hu R P, Liu C, Xing X L, Qian C, Zuo X X, Nan J M, Wang L S. Appl. Catal. B, 2013, 140: 433-443
Huang Y L, Qin J, Liu X X, Wei D L, Seo H J. J. Taiwan Inst. Chem. Eng. , 2019, 96: 353-360 doi: 10.1016/j.jtice.2018.11.029
Shuk P, Wiemhöfer H D, Guth U, Göpel W, Greenblatt M. Solid State Ionics, 1996, 89: 179-196 doi: 10.1016/0167-2738(96)00348-7
Luo X C, Zhu G Q, Peng J H, Wei X M, Hojamberdiev M, Jin L, Liu P. Appl. Surf. Sci. , 2015, 351: 260-269 doi: 10.1016/j.apsusc.2015.05.137
Liang J, Zhu G Q, Liu P, Luo X C, Tan C W, Jin L, Zhou J P. Superlattices Microstruct. , 2014, 72: 272-282 doi: 10.1016/j.spmi.2014.05.005
Wang Y, Wen Y Y, Ding H M, Shan Y K. J. Mater. Sci. , 2010, 45(5): 1385-1392 doi: 10.1007/s10853-009-4096-1
Sun J J, Li X Y, Zhao Q D, Tade M O, Liu S M. Appl. Catal. B, 2017, 219: 259-268 doi: 10.1016/j.apcatb.2017.07.052
Jiang L B, Yuan X Z, Zeng G M, Liang J, Chen X H, Yu H B, Wang H, Wu Z B, Zhang J, Xiong T. Appl. Catal. B, 2018, 227: 376-385 doi: 10.1016/j.apcatb.2018.01.042
Li Y P, Wang H, Huang L Y, Wang C B, Wang Q, Zhang F, Fan X H, Xie M, Li H M. J. Alloys Compd. , 2020, 816: 152665 doi: 10.1016/j.jallcom.2019.152665
Yu S X, Zhang Y H, Dong F, Li M, Zhang T R, Huang H W. Appl. Catal. B, 2018, 226: 441-450 doi: 10.1016/j.apcatb.2017.12.074
Lu Y F, Huang Y, Zhang Y F, Cao J J, Li H W, Bian C, Lee S C. Appl. Catal. B, 2018, 231: 357-367 doi: 10.1016/j.apcatb.2018.01.008
Liu H J, Chen P, Yuan X Y, Zhang Y X, Huang H W, Wang L A, Dong F. Chin. J. Catal. , 2019, 40(5): 620-630 doi: 10.1016/S1872-2067(19)63279-1
Wu X Y, Zhang K K, Zhang G K, Yin S. Chem. Eng. J. , 2017, 325: 59-70 doi: 10.1016/j.cej.2017.05.044
Zhu G X, Zhu J G, Jiang W J, Zhang Z J, Wang J, Zhu Y F, Zhang Q F. Appl. Catal. B, 2017, 209: 729-737 doi: 10.1016/j.apcatb.2017.02.068
Cronemeyer D C. Phys. Rev., 1959, 113: 1222-1226
Liu Y, Yin H M, Wu Y F, Zhou A Q, Xu X H. Bull. Chin. Ceramic Soc. , 2010, 29: 751-756
Zhang B B, Zhang D F, Pu X P, Gao M C, Lv D D. Nat. Sci. , 2016, 1: 33-36
Zhang X B, Zhang L, Hu J S, Huang X H. RSC Adv. , 2016, 6: 3234932357
Yang F, Yan N N, Huang S, Sun Q, Zhang L Z, Yu Y. J. Phys. Chem. C, 2012, 116: 9078-9084 doi: 10.1021/jp300939q
Jiang H Y, Liu J J, Cheng K, Sun W B, Lin J. J. Phys. Chem. C, 2013, 117: 20029-20036 doi: 10.1021/jp406834d
Zhu G X, Zhu J G, Jiang W J, Zhang Z J, Wang J, Zhu Y F, Zhang Q F. Appl. Catal. B, 2017, 209: 729-737 doi: 10.1016/j.apcatb.2017.02.068
Wang M, Tan G Q, Zhang D, Li B, Lv L, Wang Y, Ren H J, Zhang X L, Xia A, Liu Y. Appl. Catal. B, 2019, 254: 98-112 doi: 10.1016/j.apcatb.2019.04.044
Feng C X, Wang Y, Jin Z S, Zhang J W, Zhang S L, Wu Z S, Zhang Z J. New J. Chem. , 2008, 32: 1038-1047 doi: 10.1039/b719498f
Feng C X, Li G G, Ren P H, Wang Y, Huang X S, Li D L. Appl. Catal. B, 2014, 158: 224-232
Feng C X, Jin Z S, Zhang J W, Wu Z S, Zhang Z J. Photochem. Photobiol. , 2010, 86: 1222-1229 doi: 10.1111/j.1751-1097.2010.00808.x
Feng C X, Sun M M, Wang Y, Huang X S, Zhang A C, Pang Y H, Zhou Y M, Peng L S, Ding Y T, Zhang L, Li D L. Appl. Catal. B, 2017, 219: 705-714 doi: 10.1016/j.apcatb.2017.07.081
Li W T, Huang W Z, Zhou H, Yin H Y, Zheng Y F, Song X C. J. Alloys Compd. , 2015, 638: 148-154 doi: 10.1016/j.jallcom.2015.03.103
Jiang L B, Yuan X Z, Zeng G M, Liang J, Chen X H, Yu H B, Wang H, Wu Z B, Zhang J, Xiong T. Appl. Catal. B, 2018, 227: 376-385 doi: 10.1016/j.apcatb.2018.01.042
Shah Z H, Wang J S, Ge Y S, Wang C, Mao W X, Zhang S F, Lu R W. J. Mater. Chem. A, 2015, 3: 3568-3575 doi: 10.1039/C4TA05777E
Yan T J, Tian J, Guan W F, Qiao Z, Li W J, You J M, Huang B B. Appl. Catal. B, 2017, 202: 84-94 doi: 10.1016/j.apcatb.2016.09.017
Hao Q, Wang R T, Lu H J, Xie C A, Ao W H, Chen D M, Ma C, Yao W Q, Zhu Y F. Appl. Catal. B, 2017, 219: 63-72 doi: 10.1016/j.apcatb.2017.07.030
Wang J J, Tang L, Zeng G M, Liu Y N, Zhou Y Y, Deng Y C, Wang J J, Peng B. ACS Sustainable Chem. Eng. , 2017, 5(1): 1062-1072 doi: 10.1021/acssuschemeng.6b02351
Wang S M, Li D L, Sun C, Yang S G, Guan Y, He H. Appl. Catal. B, 2014, 144: 885-892 doi: 10.1016/j.apcatb.2013.08.008
Eberl J, Kisch H. Photochem. Photobiol. Sci. , 2008, 7(11): 1400-1406 doi: 10.1039/b811197a
Xu Y, Chen Y, Fu W F. Appl. Catal. B, 2018, 236: 176-183 doi: 10.1016/j.apcatb.2018.03.098
Hu Z F, Yuan L Y, Liu Z F, Shen Z R, Yu J C. Angew. Chem. Int. Ed. , 2016, 55: 9580-9585 doi: 10.1002/anie.201603331
Zhao J, Holmes M A, Osterloh F E. ACS Nano, 2013, 7(5)4316-4325 doi: 10.1021/nn400826h
Chamousis R L, Osterloh F E. Energy Environ. Sci. , 2014, 7: 736-743 doi: 10.1039/C3EE42993H

Scheme 1 Schematic illustration of preparation for traditional β-Bi2O3 (a), OV-β-Bi2O3 (b) and OV-Zn: Bi2O3 series (c)

Figure 1 (a) XRD patterns of as-prepared traditional β-Bi2O3, OV-β-Bi2O3 and OV-Zn: Bi2O3 series with different nZn/nBi; (b) Enlarged (201) peak in the 2θ range of 26°~30° for OV-β-Bi2O3 and OV-Zn: Bi2O3 series

Figure 2 SEM images of pure OV-β-Bi2O3 (a), OV-Zn: Bi2O3-0.1 (b), OV-Zn: Bi2O3-0.3 (c), OV-Zn: Bi2O3-0.5 (d), OV-Zn: Bi2O 3-1.0 (e) and traditional β-Bi2O3 (f)

Figure 3 High-resolution XPS spectra of Bi4f (a), Zn2p (b) and O1s (c) for traditional β-Bi2O3, OV-β-Bi2O3 and OV-Zn: Bi2O3-0.3 samples

Figure 4 ESR spectra of traditional β-Bi2O3, OV-β-Bi2O3 and OV-Zn: Bi2O3 series at room temperature in air

Figure 5 UV-Vis DRS spectra (a) and plots of (αhν)2 vs photon energy (b) of traditional β-Bi2O3, OV-β-Bi2O3 and OV-Zn: Bi2O3 series

Figure 6 VB XPS spectra of traditional β-Bi2O3 (a), OV-β-Bi2O3 (b) and OV-Zn: Bi2O3-0.3 (c) as the representative of OV-Zn: Bi2O3 series

Figure 7 Photocatalytic degradation of MB (a) and linear fitting for first order kinetics (b) over different catalysts under visible light irradiation; Photocatalytic degradation of 2, 4, 6-TCP (c) and linear fitting for first order kinetics (d) over different catalysts under visible light irradiation
λ> 420 nm, the light intensities were 23 mW·cm-2 for MB and 45 mW·cm-2 for 2, 4, 6-TCP

Figure 8 Plots of c/c0 versus irradiation time over OV-β-Bi2O3 (a) and OV-Zn: Bi2O3-0.3 (c) as well as photodegradation efficiency of MB over OV-β-Bi2O3 (b) and OV-Zn: Bi2O3-0.3 (d) in different recycling runs

Figure 9 XRD patterns of OV-Zn: Bi2O3-0.3 (a) and OV-β-Bi2O3 (b) before and after four-cycling degradation of MB under visible light irradiation

Figure 10 Effect of different scavengers on MB degradation process over OV-Zn: Bi2O3-0.3 catalyst

Figure 11 Photocatalytic degradation mechanism of OV-β-Bi2O3 and OV-Zn: Bi2O3 under visible light irradiation

Figure 12 (a) I-V curves of traditional β-Bi2O3, OV-β-Bi2O3 and OV-Zn: Bi2O3-0.3; (b) Photocurrent response of traditional β- Bi2O3, OV- β-Bi2O3, OV-Zn: Bi2O3-0.3 and OV- Zn: Bi2O3 -1.0 under visible light (λ>420 nm); (c) Comparison of Zn2p XPS spectra of OV-Zn: Bi2O3-0.3 before and after reaction; (d) PL spectra of β-Bi2O3, OV-β-Bi2O3, OV-Zn: Bi2O 3-0.3 and OV-Zn: Bi2O3-1.0

Figure 13 (a) Dependence of Δh and reaction rate constant (k) for the degradation of MB by OV-Zn: Bi2O3 series on intensity of ESR signal for Vo· (hESR, OV); (b) Dependence of hESR, OV and k on nZn/nBi
Δh=hlight-hdark; hlight and hdark refer to the intensities of ESR signal at g=2.004 under visible light and in dark, respectively
Table 1. Values of Eg, EVB and ECB for traditional β-Bi2O3, OV-β-Bi2O3 and OV-Zn: Bi2O3 series
| Catalyst | Eg/eV | EVB/eV | ECB/eV |
| β-Bi2O3 | 2.72 | 3.10 | 0.38 |
| OV-β-Bi2O3 | 2.40 | 2.94 | 0.54 |
| OV-Zn: Bi2O3-0.1 | 2.46 | 2.97 | 0.51 |
| OV-Zn: Bi2O3-0.3 | 2.50 | 2.99 | 0.49 |
| OV-Zn: Bi2O3-0.5 | 2.53 | 3.01 | 0.48 |
| OV-Zn: Bi2O3-1.0 | 2.80 | 3.14 | 0.34 |
 下载: 导出CSV
Table 2. Reaction rate constant (k) and correlation coefficient (R2) of traditional β-Bi2O3, OV-β-Bi2O3 and OV-Zn: Bi2O3 series for photocatalytic degradation of MB under visible light irradiation
| Catalyst | R2 | k/min-1 |
| β-Bi2O3 | 0.972 | 0.001 91 |
| OV-β-Bi2O3 | 0.995 | 0.004 98 |
| OV-Zn: Bi2O3-0.1 | 0.979 | 0.005 75 |
| OV-Zn: Bi2O3-0.3 | 0.985 | 0.009 71 |
| OV-Zn: Bi2O3-0.5 | 0.995 | 0.009 13 |
| OV-Zn: Bi2O3-1.0 | 0.998 | 0.006 21 |
下载: 导出CSV

 扫一扫看文章

扫一扫关注我们