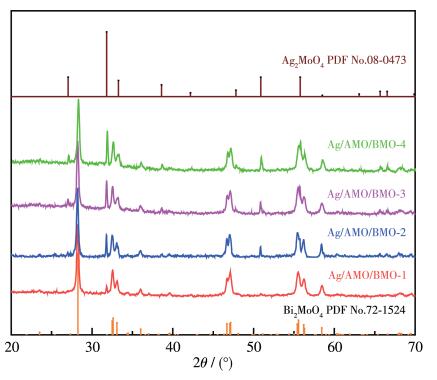
Figure 1.
XRD patterns of Ag/AMO/BMO-x (x=1, 2, 3, 4) samples and standard XRD patterns of Bi2MoO6 (PDF No.72-1524) and Ag2MoO4 (PDF No.08-0473)
Preparation and Photocatalytic Activity of Ag/Ag2MoO4/Bi2MoO6 Composite Photocatalyst
Shuai-Shuai MA , Cheng-Juan HUANG , Yu-Qing ZONG , Jian-Dong GU , Zhao-Lian YE , Jin-Juan XUE

Recently, contamination of pharmaceutical compounds especially the antibiotics in wastewater and its harm to living ecosystem have attracted wide attention all over the world[1]. Tetracycline (TC) has been widely used to prevent human and animal infections because of its antibacterial, bactericidal effect and low price[2-3]. However, drug abuse seriously endangers the ecological environment, as TC could not be completely decomposed in the living, and their residues are detected in surface water, groundwater, and even treated drinking water, which causes the potential pressure on the human health and the safety of entire ecosystem[4-5]. In order to effectively remove and degrade TC, various technologies have been developed, such as physical absorption, electrolysis, photocatalysis, microbial decomposition, electrochemical oxidation and membrane separation[6-8]. Semiconductor photocatalysis, as an advanced oxidation technology, has become the research hotspot of TC residue treatment in recent years[9]. From the perspective of solar energy utilization, visible light accounts for 44% of the total solar spectrum. Therefore, many people devote themselves to the development of superior visible-light driven photocatalysts.
As a representative member of the Aurivillius family, Bi2MO6 with a layered structure containing O2- sandwiched between layered Bi2O22+ units and perovskite-like slabs of MoO42-, is considered to be a promising photocatalyst due to the photostability and environmentally friendly features[10-11]. However, the rapid recombination rate of photoinduced charges and inadequate utilization of visible light are still serious problems when using pristine Bi2MoO6 as a photocatalyst[12-13]. Tremendous efforts have thus been made to solve these problems, including the fabrication of heterojunction, doping metal and non-metal ions, and surface modification as well[14-17].
Silver-based semiconductors, such as Ag2CO3[18], Ag3PO4[19], AgVO3[20], Ag2CrO4[21] and AgCl[22-23], have been proven to have excellent photocatalytic properties due to the surface plasmon resonance (SPR) effects of elemental silver and narrow band gap. Ag2MoO4, as a new silver - based semiconductor photocatalyst, has attracted extensive research interest in recent years due to its unique physicochemical properties and plasticity[24-25]. The surface of Ag2MoO4 tends to produce metal Ag when exposed to visible light like other Ag-based semiconductors. However, due to the high band gap excitation of Ag2MoO4, simple binary Ag2MoO4 based composite materials cannot meet the needs of high-efficiency photocatalysis. Therefore, it is reasonable to construct a ternary Ag/Ag2MoO4/Bi2MoO6 heterojunction photocatalyst which has not been researched before.
Herein, we have firstly synthesized the ternary Ag/Ag2MoO4/Bi2MoO6 heterojunction photocatalyst via hydrothermal, chemical deposition and in-situ photoreduction method. The as-prepared Ag/Ag2MoO4/Bi2MoO6 ternary composite exhibited remarkably improved photocatalytic activities in the degradation of representative antibiotic TC in comparison with pure Ag2MoO4 and Bi2MoO6 under visible light irradiation. Moreover, the stability of ternary Ag/Ag2MoO4/Bi2MoO6 photocatalyst and the mechanism of improving photocatalytic efficiency under visible light were proposed.
Pure Bi2MoO6 was prepared via a simple hydrothermal process according to our previous work[26]. Ag2MoO4/Bi2MoO6 was prepared by chemical deposition. Typically, 0.152 5 g Bi2MoO6 (0.25 mmol) was ultrasonically dispersed in 50 mL of ultrapure water, and then a certain amount (2, 4, 6, 8 mL) of AgNO3 solution (0.05 mol·L-1) was dropped into the suspension. The mixture was stirred at a rate of 1 000 r·min-1 for 30 min to make Ag+ completely adsorbed on the Bi2MoO6 surface. Then a certain amount (1, 2, 3, 4 mL) of Na2MoO4 solution (0.05 mol·L-1) was added dropwise, and stirred vigorously for 1 h under dark conditions to obtain Ag2MoO4/Bi2MoO6 (AMO/BMO). Subsequently, AMO/BMO sample was irradiated under a 500 W xenon lamp equipped with an ultraviolet filter (>420 nm) for 10 min to change part of the Ag+ into Ag to obtain Ag/AMO/BMO product. The products were collected, washed several times with deionized water and alcohol, and dried overnight at 65℃ in vacuum. The theoretical mass fractions of AMO in the series of samples obtained were 12.3%, 24.6%, 37.0% and 49.2%, respectively, and the corresponding products were named as Ag/AMO/BMO-x (x=1, 2, 3, 4, respectively). For comparison, pure Ag2MoO4 (AMO), Ag/Ag2MoO4 (Ag/AMO) and Ag/Bi2MoO6 (Ag/BMO) were prepared by adopting the similar method.
X-ray diffraction (XRD) data were obtained on an X-ray diffractometer (SmartLab, Rigaku) operated at 40 kV and 30 mA with Cu Kα X - ray radiation source, a nickel filter (λ =0.154 nm), and 2θ range of 20°~70°. The morphologies and microstructures of the samples were investigated by field emission scanning electron microscopy (FE - SEM, SUPRA55, SAPPHIRE, Zeiss) at the acceleration voltage of 5 kV. UV-Vis spectropho- tometer (UV - 3600, Shimadzu) equipped with an integrating sphere was used to investigate the UV - visible diffuse - reflectance spectra (UV - Vis DRS). The X - ray photoelectron spectra (XPS) were carried out on Thermo Scientific Escalab 250Xi, equipped with an Al Kα monochromatic X - ray source (hν =1 486.7 eV) with a line width of 0.20 eV in an analysis chamber at a bass pressure of less than 4.3×10⁻⁸ Pa. The electrochemical measurement was performed with an electrochemical workstation (CHI660B, Chenhua Instruments, Shanghai, China).
The photocatalytic activities of the samples were evaluated by the degradation of TC aqueous solution under irradiation of a 500 W xenon lamp with a 420 nm cutoff filter. Typically, 10 mg of asprepared photocatalyst was suspended in a 50 mL of TC solution (10 mg·L-1) and stirred magnetically for 60 min in the dark to ensure the establishment of the adsorption/desorption equilibrium between the catalyst and the simulated pollutant. In the course of the experiment, 1 mL of the sample was taken out every 5 min and PTFE syringe filter (0.22 μm) was used to remove the particles. Then the photodegradation rate (DR) of TC was tested by the high performance liquid chromatography (HPLC, Shimadzu LC-20A, Japan).
The XRD analysis was conducted to determine the crystalline structures and the corresponding patterns of Ag/AMO/BMO-x samples, and the results are demonstrated in Fig. 1. The intensive diffraction angels 2θ at 23.5°, 28.3°, 32.6°, 33.1°, 36.1°, 39.7°, 46.7°, 47.2°, 55.6°, 56.3° and 58.5° can be assigned to (111), (131), (002), (060), (151), (042), (202), (062), (133), (191) and (262) crystallographic planes of orthorhombic Bi2MoO6 (PDF No.72-1524). Meanwhile, other peaks at 2θ =27.1°, 31.8°, 33.3°, 38.7°, 47.8°, 50.9°, 55.8°, 65.6° and 66.5° are assigned to the (220), (311), (222), (400), (422), (511), (440), (533) and (622) planes of cubic Ag2MoO4 (PDF No. 08-0473), respectively. With the increase of AMO content, the intensity of the cubic AMO peak gradually increased. Cubic/hexagonal Ag0 peaks were difficult to find, which may be due to the low metallic Ag content and low crystallinity.
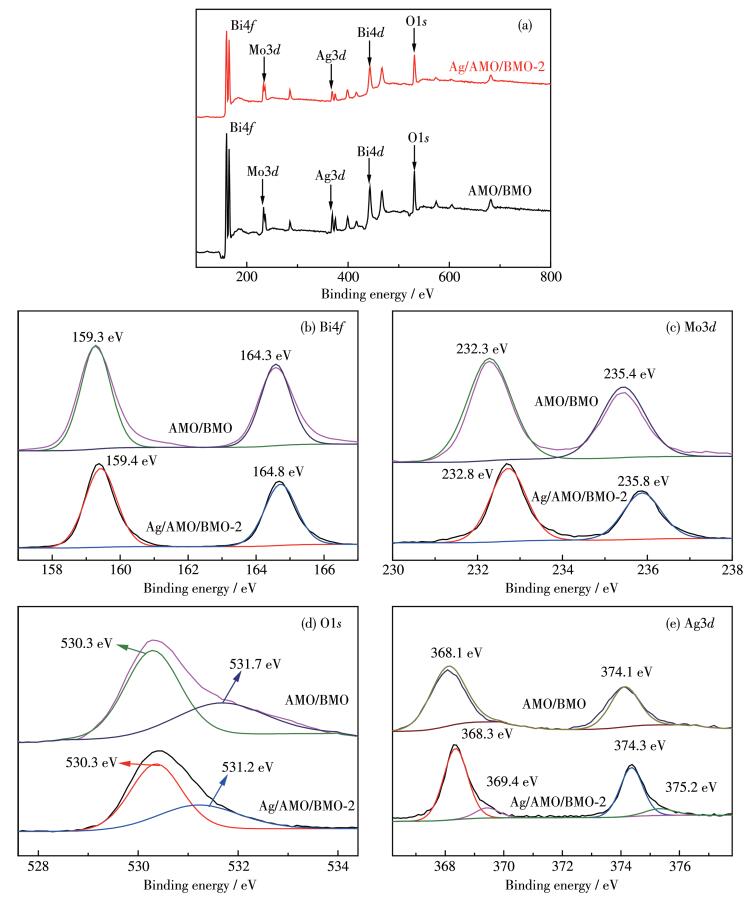
The elemental compositions and the surface chemical states of AMO/BMO and Ag/AMO/BMO-2 were obtained by XPS spectra. As depicted in Fig. 2a, the XPS survey spectra of AMO/BMO and Ag/AMO/BMO-2 illustrated that the prepared samples were composed of Bi, Mo, O and Ag elements. In Fig. 2b~2d, no obvious difference was found about the high-resolution XPS spectra of Bi4f, Mo3d and O1s over AMO/BMO and Ag/AMO/BMO-2 samples. The Bi4f spectrum in Fig. 2b for Ag/AMO/BMO-2 composite displayed two characteristic peaks at 159.4 and 164.8 eV attributed to Bi4f7/2 and Bi4f5/2, revealing that Bi exist as the form of Bi3+ [27]. In Fig. 2c, the peaks of Mo3d5/2 and Mo3d3/2 at 232.8 and 235.8 eV in the Mo3d spectrum can be attributed to the oxidation states of Mo6+ [28]. Generally, the O1s peaks in Fig. 2d can be divided into two different peaks at 530.3 and 531.2 eV, which should be attributed to the presence of Mo—O and surface —OH groups, respectively[29]. The Ag3d spectrum shown in Fig. 2e had two distinct peaks at 374.3 and 368.3 eV, which are connected to the Ag3d3/2 and Ag3d5/2 orbitals. The curves could be further divided into four peaks. The strong peaks of 368.3 and 374.3 eV can be attributed to Ag+, which proves that Ag+ is the dominant species of Ag[30]. As for Ag/AMO/BMO -2, the binding energies at 369.4 and 375.2 eV can be indexed to Ag NPs (nanopartides) [31], confirming the existence of a small amount of Ag0 in Ag/AMO/BMO-2.
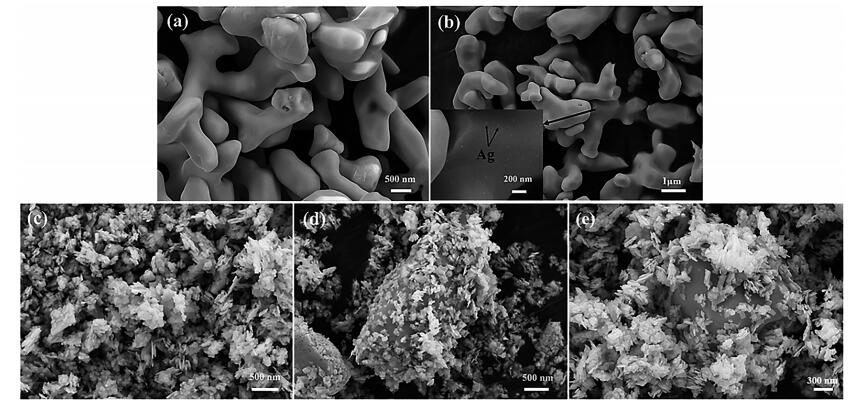
The FE-SEM images of AMO, Ag/AMO, BMO, Ag/AMO/BMO - 2 and AMO/BMO are depicted in Fig. 3. Pure AMO had an irregular cashew shape with a particle size of 2~3 μm and a smooth surface (Fig. 3a). After being irradiated with visible light, some particles believed to be silver were deposited on the surface of AMO (Fig. 3b). As shown in Fig. 3c, BMO sample showed nanoplate-like morphology with side length of 100~200 nm. As indicated in Fig. 3d and 3e, Ag/AMO/BMO -2 and AMO/BMO processed similar morphology. It can be seen that BMO nanoplates and irregular block AMO coexisted in the composite material, and most of them had good contact, which proves that the heterojunction photocatalyst has been successfully synthesized. Furthermore, we could also observe that the surface of AMO became rough after forming a heterojunction with BMO, thus increasing the contact area between each other.
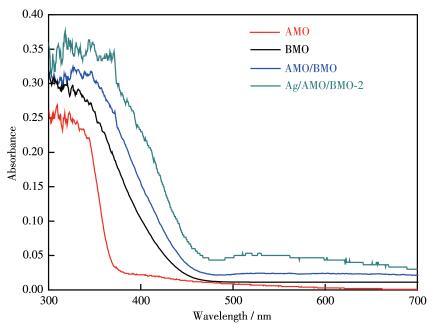
The optical properties of AMO, BMO, AMO/BMO and Ag/AMO/BMO-2 were investigated by UV-Vis DRS and the results are shown in Fig. 4. Pure AMO only has obvious absorption in the ultraviolet region, and the absorption edge was around 380 nm (band gap: 3.26 eV). It was observed that pure BMO had an adsorption edge at about 460 nm, which corresponds to the reported optical band gap of about 2.64 eV. The formation of the heterojunction between AMO and BMO broadened and increased the visible light absorption, and the wavelength thresholds of AMO/BMO sample was estimated to be about 475 nm, corresponding to the band gaps of 2.56 eV. Whereas compared with the absorption spectrum of AMO and BMO, Ag/AMO/BMO-2 sample displayed a more intense absorption ranging from 300 to 700 nm and exhibited a broad absorption peak at around 530 nm which can be attributed to the SPR effect of Ag nanoparticles[32]. Due to the expansion of the light absorption range and light intensity of Ag/AMO/BMO-2 photocatalyst, it is expected to achieve more effective utilization of the solar spectrum and show enhanced photocatalytic activity.
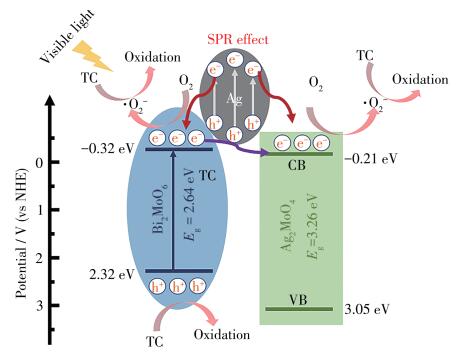
The edge position can be determined by the following empirical equation[33]: EVB=X-E0+0.5Eg, ECB= EVB-Eg, where EVB is the VB edge potential and X is theabsolute electronegativity of the semiconductor; E0 is the energy of free electrons on the hydrogen scale (~4.5 eV) and Eg is the band gap energy of the semiconductor. The X values for AMO and BMO were calculated to be 5.92 and 5.50 eV, respectively. Therefore, the EVB and ECB values of AMO were determined to be 3.05 and -0.21 eV (vs NHE), and those of BMO were calculated to be 2.32 and -0.32 eV (vs NHE), respectively.
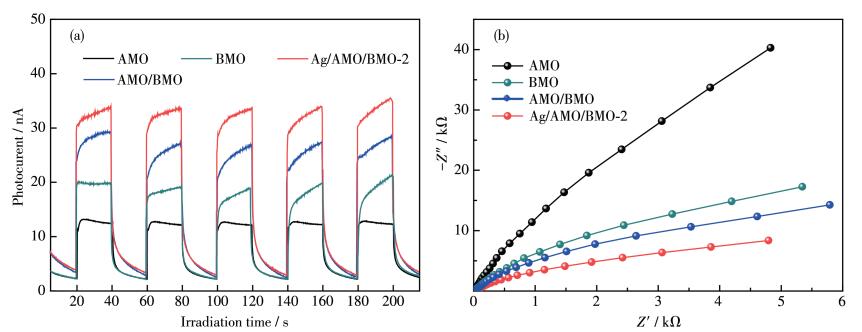
In order to determine the separation efficiency of the carrier, the photochemical measurements were performed. Fig. 5a displays the transient photocurrent responses of AMO, BMO, AMO/BMO and Ag/AMO/BMO-2 samples in several light on-off cycles. The intensity of photocurrent for AMO and BMO was weak, indicating pure photocatalyst is faced with the headache that the quantity and migration speed of charge carriers is low. AMO/BMO composites showed a higher transient photocurrent intensity compared with pure AMO and BMO, indicating that the heterojunction of AMO/BMO composites not only boost the generation but also accelerate separation of charges carriers. Obviously, it can be found that Ag/AMO/BMO-2 significantly enhanced the photocurrent performance compared to AMO/BMO, which indicates that the introduction of Ag NPs can further reduce the electron and hole recombination rate. Moreover, the charge migration rate was evaluated according to the arc radius in the EIS (electrochemical impedance spectroscopy). Fig. 5b shows the EIS Nyquist plots of AMO, BMO, AMO/BMO and Ag/AMO/BMO-2 under the identical experimental conditions. Obviously, Ag/AMO/BMO-2 showed the minimum radius of curvature, indicating its highest electronhole pairs separation and electrons transfer efficiency, which agreed well with the results of photocurrent response.
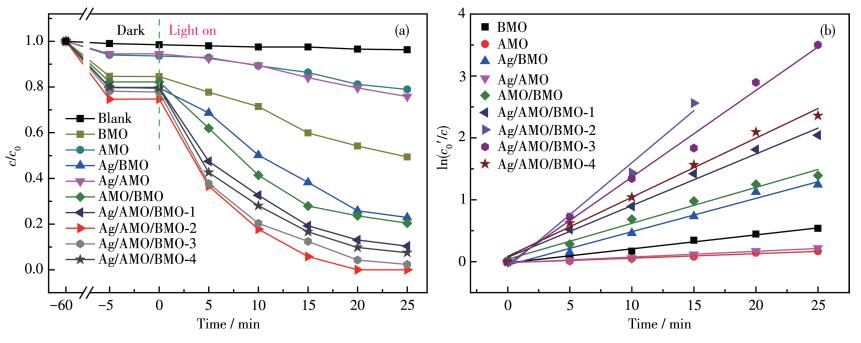
The performance of degradation of TC by all synthesized samples under visible light irradiation are shown in Fig. 6a, where c0 and c are the initial concentration of TC and the concentration remaining in the solution after the irradiation time (t), respectively. As shown in Fig. 6a, TC was rarely degraded without photocatalysts in the control test, indicating that the self-pho-tolysis of TC could be ignored. In Fig. 6a, the degradation rates of TC over Ag/AMO/BMO-x (x=1, 2, 3, 4) samples were higher than that of AMO, BMO, Ag/AMO, Ag/BMO and AMO/BMO, respectively. The photocatalytic activity of Ag/AMO/BMO composite first increased and then decreased with the increase of Ag/AMO content. Ag/AMO/BMO-2 showed the best photocatalytic performance, and the photodegradation rate of TC reached almost 100% after 20 min of irradiation. In addition, if the initial TC concentration is within the millimolar concentration range, photocatalytic degradation of organic pollutants generally follows pseudo-first-order kinetics and the kinetic model can be expressed by equation ln(c0'/c)=kt, where c0' is the initial TC concentration at the beginning of photocatalitic degradation, and k is the kinetic rate constant[34-35]. As depicted in Fig. 6b, Ag/AMO/BMO-2 photocatalyst exhibited the highest rate constant (0.168 2 min-1) among all of the samples for the degradation of TC, which was 7.2 and 17.7 times higher than those of pure BMO (0.022 6 min-1) and Ag/AMO (0.009 2 min-1), respectively. The enhanced activity of Ag/AMO/BMO -2 can be attributed to the formation of heterojunctions that can effectively separate photocarriers, and the introduction of Ag NPs in the composite material also helps to expand the optical response range and realize more effective electron transfer. Furthermore, Table 1 list the photocatalytic performance of the reported photocatalysts compared to the as-prepared samples. As expected, Ag/AMO/BMO-2 photocatalyst toward TC degradation possessed distinct advantage over the reported Bi2MoO6-based catalysts. Although a direct comparison is difficult owing to the differences in photocatalytic reaction parameters, Ag/AMO/BMO-2 photocatalyst indeed displayed excellent visible-light-driven photocatalytic activity for TC degradation. Consequently, the results further proved that Ag/AMO/BMO-2 sample could be acted as a promising photocatalyst to remove the antibiotic pollutants in the aqueous solution.
 下载:
导出CSV
下载:
导出CSV
| Photocatalyst | ccatalyst/(g·L-1) | cTC/(mg·L-1) | DR, time | Light power | Ref. |
| Bi2MoO6/Ti3C2 | 0.5 | 15 | 97%, 60 min | 15 W LED | [36] |
| Fe/Bi2MoO6 | 0.2 | 10 | 99%, 60 min | 500 W Xe lamp | [26] |
| TNCuPc/CeO2/Bi2MoO6 | 1.5 | 50 | 95%, 120 min | 800 W Xe lamp | [37] |
| WO3/Bi2MoO6 | 1.0 | 20 | 77%, 120 min | 300 W Xe lamp | [38] |
| N-TiO2/Bi2MoO6 | 0.25 | 20 | 94%, 150 min | 5WLED | [39] |
| CuBi2O4/Bi2MoO6 | 0.3 | 20 | 73%, 60 min | 300 W Xe lamp | [40] |
| Bi2MoO6/BiFeO3 | 1.0 | 10 | 93%, 300 min | 150 W Xe lamp | [41] |
| Ag/Ag2MoO4/Bi2MoO6 | 0.2 | 10 | 100%, 20 min | 500 W Xe lamp | This work |
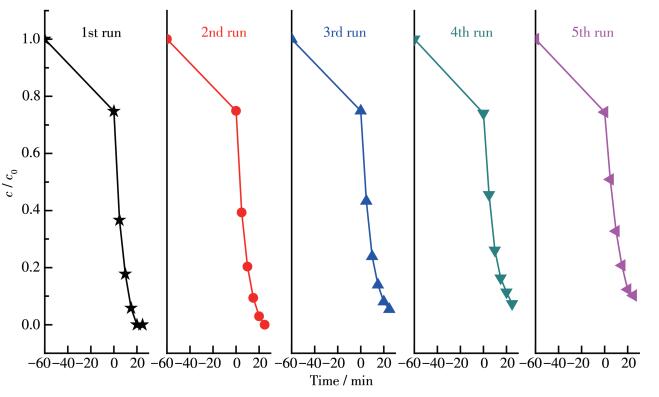
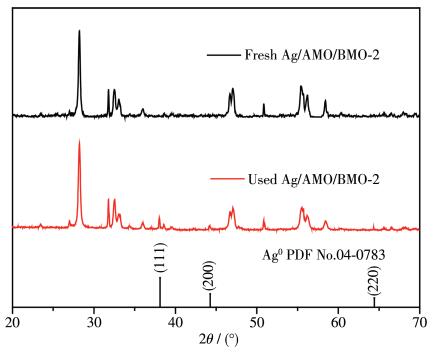
Photocatalytic stability and recyclability are the main parameters for the practical application of photocatalyst. Fig. 7 shows the photocatalytic TC degradation performance of Ag/AMO/BMO -2 sample under visible light for five runs. It can be seen that after five cycles, the removal rate of TC remained at 89.8%, indicating that Ag/AMO/BMO-2 photocatalyst possesses good stability and can be used for repeated treatment of TC. The photodecomposition of Ag/AMO/BMO -2 and the formation of more Ag NPs may be the reason for the decrease of its photocatalytic activity. A small amount of Ag NPs can promote the visible light absorption and photocatalytic activity of the catalyst, while excessive Ag NPs deposited on the surface of the catalyst will block the incidence of light and reduce the photocatalytic performance[24, 42]. The XRD pattern of the used Ag/AMO/BMO -2 collected after the cycling runs showed small peaks at 2θ=38.1°, 44.2° and 64.4°, corresponding to the (111), (200) and (220) facets of cubic Ag0 (Fig. 8), while the fresh Ag/AMO/BMO -2 had no obvious Ag0 peaks.
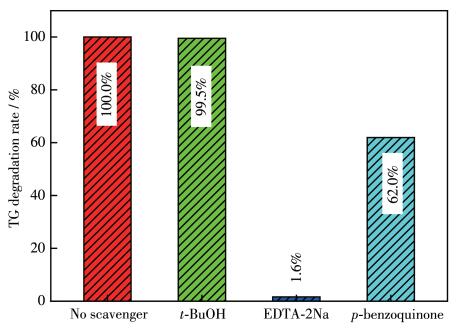
In order to deeply investigate the active species involved in photocatalysis, a series of radical captured experiments were performed. In this study, EDTA-2Na has no response to visible light due to its large energy gap, whereas BMO can be excited to produce photoelectrons (e-) and holes (h+) pairs on its surface due to the narrow energy gap. The ECB values of BMO was calculated to be -0.32 eV (vs NHE), which was lower than (1 mmol·L-1), p-benzoquinone (1 mmol·L-1) and t-BuOH (1 mmol·L-1) were used to scavenge h+, ·O2- nd ·OH, respectively[26]. As shown in Fig. 9, it is obvious that the degradation rate for TC significantly reduced after addition of p-benzoquinone and EDTA-2Na, indicating the ·O2- and h+ play significant roles during the degradation process. However, little efficiency reduction with the addition of t-BuOH demonstrated that ·OH might not the predominant active species. These facts confirm that h+ is the main active species and ·O2- plays a secondary role in the photocatalytic degradation process.
On the basis of the results described above, we proposed a possible mechanism of degradation of TC over Ag/AMO/BMO-2 photocatalyst under visible light irradiation in Fig. 10. From Fig. 4, we know that AMO the standard redox potential of O2/·O2- (-0.33 eV)[43]. However, in the above free radical trapping experiment, we confirmed that ·O2- is the main active substance on Ag/AMO/BMO-2 photocatalyst, indicating that the formation of ·O2- in the reaction is definite. The reason can be explained as follows: Ag NPs can absorb the visible light and generate electron-hole pairs due to SPR effect[44]. With visible light irradiation, photogenerated electron - hole pairs are separated on the surface of Ag NPs. The energy of hot electrons waved around its own Fermi level and the range of the vibration is from 1.0 to 4.0 eV[45]. Therefore, the excited electrons have enough energy to transfer from Ag NPs to CB of AMO and BMO. Subsequently, the electrons accumulated on the surface of AMO and BMO will be captured by absorbed O2 to form ·O2-, then further oxidized the organic contaminants. Since ECB of BMO was negative than that of AMO, the photogenerated electrons in BMO have a tendency to diffuse to the CB of AMO via the interface. This causes an efficient separation of photogenerated electrons and holes and the lifetime of the excited electrons and holes can be prolonged in the transfer process. On the other hand, because the EVB value of BMO (+2.32 eV (vs NHE)) was lower than the standard redox potentials of ·OH/H2O (+2.68 eV (vs NHE)), indicating that photoinduced holes on the VB of BMO cannot react with ·OH/H2O to form ·OH, hence h+ on the VB of BMO would be consumed by directly decomposing TC.
In summary, the Ag/AMO/BMO composites with different Ag/AMO mass fractions were synthesized via hydrothermal, chemical deposition and in-situ photore- duction method. The as-prepared Ag/AMO/BMO-2 photocatalyst exhibited significantly enhanced photocatalytic activities toward antibiotic TC degradation and the degradation rate was nearly 7.2 and 17.7 times higher than that of pure BMO and Ag/AMO, respectively. The Ag SPR effect that enlarged the optical adsorption range combining with AMO to efficiently separate photogenerated charge carriers synergistically account for the enhancement of photocatalytic activity. The optimal photocatalyst showed reasonable stability during five successive runs. Part of the catalyst deactivation is due to the excessive reduction of Ag+ to Ag0 during exposure to visible light. The main active substances responsible for photocatalytic degradation are photoinduced holes and ·O2- free radicals.
Xu J, Zhang B B, Jia L, Bi N, Zhao T Q. J. Hazard. Mater. , 2020, 386: 121630 doi: 10.1016/j.jhazmat.2019.121630
Liu X H, Guo X C, Liu Y, Lu S Y, Xi B D, Zhang J, Wang Z, Bi B. Environ. Pollut. , 2019, 254: 112996 doi: 10.1016/j.envpol.2019.112996
Yang Y Y, Song W J, Lin H, Wang W B, Du L N, Xing W. Environ. Int. , 2018, 116: 60-73 doi: 10.1016/j.envint.2018.04.011
Wu Q F, Li Z H, Hong H L. Appl. Clay Sci. , 2013, 74: 66-73 doi: 10.1016/j.clay.2012.09.026
张宇晴, 曾雪玉, 于凯, 刘桂芳, 曹海雷, 吕健, 曹荣. 无机化学学报, 2019, 35(11): 2185-2191 doi: 10.11862/CJIC.2019.243ZHANG Y Q, ZENG X Y, YU K, LIU G F, CAO H L, LÜ J, CAO R. Chinese J. Inorg. Chem. , 2019, 35(11): 2185-2191 doi: 10.11862/CJIC.2019.243
Yan X, Wang X Y, Gu W, Wu M M, Yan Y, Hu B, Che G B, Han D L, Yang J H, Fan W Q, Shi W D. Appl. Catal. B, 2015, 164: 297-304 doi: 10.1016/j.apcatb.2014.09.046
Xu W H H, Zhang G, Wai O W H, Zou S C C, Li X D D. J. Soils Sediments, 2009, 9: 364-373 doi: 10.1007/s11368-009-0091-z
Jiang D L, Xiao P, Shao L Q, Li D, Chen M. Ind. Eng. Chem. Res. , 2017, 56: 8823-8832 doi: 10.1021/acs.iecr.7b01840
梁梦君, 邓楠, 向心怡, 梅英, 杨志远, 杨赟, 杨水金. 无机化学学报, 2019, 35(2): 263-270 https://www.cnki.com.cn/Article/CJFDTOTAL-JFJY202001002.htmLIANG M J, DENG N, XIANG X Y, MEI Y, YANG Z Y, YANG Y, YANG S J. Chinese J. Inorg. Chem. , 2019, 35(2): 263-270 https://www.cnki.com.cn/Article/CJFDTOTAL-JFJY202001002.htm
Zhang L W, Xu T G, Zhao X, Zhu Y F. Appl. Catal. B, 2010, 98: 138146
Wang S Y, Ding X, Yang N, Zhan G M, Zhang X H, Dong G H, Zhang L Z, Chen H. Appl. Catal. B, 2020, 265: 118585 doi: 10.1016/j.apcatb.2019.118585
Dai Z, Qin F, Zhao H Q, Ding J, Liu Y L, Chen R. ACS Catal. , 2016, 6: 3180-3192 doi: 10.1021/acscatal.6b00490
Guo L, Zhao Q, Shen H, Han X X, Zhang K L, Wang D J, Fu F, Xu B. Catal. Sci. Technol. , 2019, 9: 3193-3202 doi: 10.1039/C9CY00579J
Zhang J J, Wang T, Chang X X, Li A, Gong J L. Chem. Sci. , 2016, 7: 6381-6386 doi: 10.1039/C6SC01803C
Zhao Z W, Zhang W D, Sun Y J, Yu J Y, Zhang Y X, Wang H, Dong F, Wu Z B. J. Phys. Chem. C, 2016, 120: 11889-11898 doi: 10.1021/acs.jpcc.6b01188
Long J L, Wang S C, Chang H J, Zhao B Z, Liu B T, Zhou Y G, Wei W, Wang X X, Huang L, Huang W. Small, 2014, 10: 2791-2795 doi: 10.1002/smll.201302950
Ding X, Zhao K, Zhang L Z. Environ. Sci. Technol. , 2014, 48: 58235831
Dong H J, Chen G, Sun J X, Li C M, Yu Y G, Chen D H. Appl. Catal. B, 2013, 134: 46-54
Zheng B J, Wang X, Liu C, Tan K, Xie Z X, Zheng L S. J. Mater. Chem. A, 2013, 1: 12635-12640 doi: 10.1039/c3ta12946b
Li D, Duan X C, Qin Q, Fan H M, Zheng W J. CrystEngComm, 2013, 15: 8933 doi: 10.1039/c3ce41365a
Liu Y, Yu H B, Cai M, Sun J W. Catal. Commun. , 2012, 26: 63-67 doi: 10.1016/j.catcom.2012.04.017
Gao S T, Feng T, Feng C, Shang N Z, Wang C. J. Colloid Interface Sci. , 2016, 466: 284-290 doi: 10.1016/j.jcis.2015.12.045
Gao S T, Liu W H, Shang N Z, Feng C, Wu Q H, Wang Z, Wang C. RSC Adv. , 2014, 4(106): 61736-61742 doi: 10.1039/C4RA11364K
Jiao Z Y, Zhang J L, Liu Z D, Ma Z. J. Photochem. Photobiol. A, 2019, 371: 67-75 doi: 10.1016/j.jphotochem.2018.11.003
Zhang J L, Ma Z. J. Taiwan Inst. Chem. Eng. , 2017, 71: 156-164 doi: 10.1016/j.jtice.2016.11.030
Xue J J, Huang C J, Zong Y Q, Gu J D, Wang M X, Ma S S. Appl. Organomet. Chem. , 2019, 33: e5187
Li H P, Deng Q H, Liu J Y, Hou W G, Du N, Zhang R J, Tao X T. Catal. Sci. Technol. , 2014, 4: 1028-1037 doi: 10.1039/C3CY00940H
Zhang M Y, Shao C L, Mu J B, Huang X M, Zhang Z Y, Guo Z C, Zhang P, Liu Y C. J. Mater. Chem. , 2012, 22: 577-584 doi: 10.1039/C1JM13470A
Li Z Q, Chen X T, Xue Z L. CrystEngComm, 2013, 15: 498-508 doi: 10.1039/C2CE26260F
Gao X M, Shang Y Y, Liu L B, Nie W, Fu F. J. Phys. Chem. Solids, 2018, 127: 186-193
Wen X J, Shen C H, Niu C G, Lai D C, Zhu M S, Sun J, Fei Z H. J. Mol. Liq. , 2019, 288: 111063 doi: 10.1016/j.molliq.2019.111063
Zhu M S, Chen P L, Liu M H. J. Mater. Chem. , 2012, 22: 2148721494
Zong X, Yan H J, Wu G P, Ma G J, Wen F Y, Wang L, Li C. J. Am. Chem. Soc. , 2008, 130: 7176-7177 doi: 10.1021/ja8007825
Zhang J L, Zhang L S, Shen X F, Xu P F, Liu J S. CrystEngComm, 2016, 18: 3856-3865 doi: 10.1039/C6CE00824K
杨冰叶, 李航商, 宁昭, 冯成, 高书涛, 王春. 无机化学学报, 2017, 33(3): 396-404 https://www.cnki.com.cn/Article/CJFDTOTAL-ZGZS201903001.htmYANG B Y, LI H S, NING Z, FENG C, GAO S T, WANG C. Chinese J. Inorg. Chem. , 2017, 33(3): 396-404 https://www.cnki.com.cn/Article/CJFDTOTAL-ZGZS201903001.htm
Zhao D X, Cai C. Inorg. Chem. Front. , 2020, 7(15): 2799-2808 doi: 10.1039/D0QI00540A
Kang L, Pang Y P, Lu Q F. Inorg. Chem. Front. , 2019, 6(11): 3215-3224 doi: 10.1039/C9QI00950G
Li S J, Hu S W, Jiang W, Zhang J L, Xu K B, Wang Z H. J. Colloid Interface Sci. , 2019, 556: 335-344 doi: 10.1016/j.jcis.2019.08.077
Zhang L H, Shen Q H, Yu L X, Huang F L, Zhang C T, Sheng J S, Zhang F, Cheng D, Yang H. CrystEngComm, 2020, 22(33): 5481-5490 doi: 10.1039/D0CE00761G
Shi W L, Li M Y, Huang X L, Ren H J, Guo F, Tang Y B, Lu C Y. Chem. Eng. J. , 2020, 394: 125009 doi: 10.1016/j.cej.2020.125009
Tao R, Shao C L, Li X H, Li X W, Liu S, Yang S, Zhao C C, Liu Y C. J. Colloid Interface Sci. , 2018, 529: 404-414 doi: 10.1016/j.jcis.2018.06.035
Li Z Q, Chen X T, Xue Z L. Sci. China Chem. , 2013, 56: 443-450 doi: 10.1007/s11426-013-4845-5
Wang Z L, Huo Y, Zhang J F, Lu C, Dai K, Liang C H, Zhu G P. J. Alloys Compd. , 2017, 729: 100-108 doi: 10.1016/j.jallcom.2017.09.152
Wang J J, Tang L, Zeng G M, Liu Y N, Zhou Y Y, Deng Y C, Wang J J, Peng B. ACS Sustainable Chem. Eng. , 2017, 5: 1062-1072 doi: 10.1021/acssuschemeng.6b02351
Linic S, Christopher P, Ingram D B. Nat. Mater. , 2011, 10(12): 911921

Figure 1 XRD patterns of Ag/AMO/BMO-x (x=1, 2, 3, 4) samples and standard XRD patterns of Bi2MoO6 (PDF No.72-1524) and Ag2MoO4 (PDF No.08-0473)

Figure 2 XPS survey spectra (a), high resolution XPS spectra of Bi4f (b), Mo3d (c), O1s (d) and Ag3d (e) core level electrons of AMO/BMO and Ag/AMO/BMO-2 samples

Figure 3 FE-SEM images of AMO (a), Ag/AMO (b), BMO (c), Ag/AMO/BMO-2 (d) and AMO/BMO (e)

Figure 5 Photocurrent response curves (a) and Nyquist plots (b) of AMO, BMO, AMO/BMO and Ag/AMO/BMO-2

Figure 6 Visible light photocatalytic activities (a) and pseudo-first-order kinetics linear fitting (b) for TC degradation over the as-prepared samples

Figure 9 Photocatalytic performance of Ag/AMO/BMO-2 in the presence of different scavengers
Table 1. Comparison of photocatalytic performance of Bi2MoO6-based photocatalysts for degradation of TC
| Photocatalyst | ccatalyst/(g·L-1) | cTC/(mg·L-1) | DR, time | Light power | Ref. |
| Bi2MoO6/Ti3C2 | 0.5 | 15 | 97%, 60 min | 15 W LED | [36] |
| Fe/Bi2MoO6 | 0.2 | 10 | 99%, 60 min | 500 W Xe lamp | [26] |
| TNCuPc/CeO2/Bi2MoO6 | 1.5 | 50 | 95%, 120 min | 800 W Xe lamp | [37] |
| WO3/Bi2MoO6 | 1.0 | 20 | 77%, 120 min | 300 W Xe lamp | [38] |
| N-TiO2/Bi2MoO6 | 0.25 | 20 | 94%, 150 min | 5WLED | [39] |
| CuBi2O4/Bi2MoO6 | 0.3 | 20 | 73%, 60 min | 300 W Xe lamp | [40] |
| Bi2MoO6/BiFeO3 | 1.0 | 10 | 93%, 300 min | 150 W Xe lamp | [41] |
| Ag/Ag2MoO4/Bi2MoO6 | 0.2 | 10 | 100%, 20 min | 500 W Xe lamp | This work |
 下载: 导出CSV

 扫一扫看文章

扫一扫关注我们