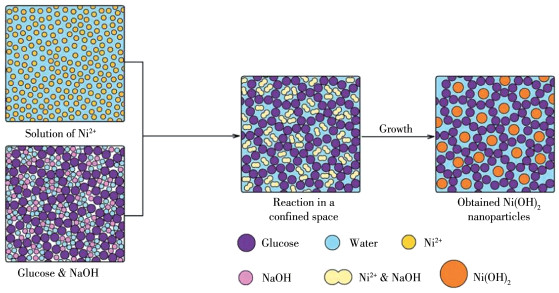
Figure 1.
Formation process of super-small Ni(OH)2 nanoparticles
Ni(OH)2 with Super-Small Nanoscale: Synthesis and Application in Li+ Adsorptions
Nan JING , An-Nan ZHOU , Guo-Hui WANG , Run-Wei WANG , Qing-Hong XU

With the development of microelectronics technology, the integration, miniaturization and intelligent of mobile equipment require that the battery has high efficiency and light weight. Due to non-pollution, high cycle life, high working voltage, light weight and rapid charging[1-5], lithium ion battery has promising prospect in our daily life. However, how to extract Li+ ion from ocean has been bothering many scientists for many years, for low concentration of Li+ in ocean[6]. Adsorption is one of a simple and low - cost method for Li+enrichment. Sieve[7-10] and grapheme[11-15] are often used as traditional adsorbents to Li+.
Nickel hydroxide (Ni(OH)2), a kind of transition metal hydroxide, has excellent electrochemical performance[16]. Due to high surface area and chemical activity, Ni(OH)2 with nanoscale was also used as catalyst, such as oxidative degradation of phenolic pollutants[17], hydrogenation reduction of nitrophenol[18]. Traditional nano Ni(OH)2 preparation methods, such as hydrothermal method[19-21], chemical precipitation method[22] andsonochemical method[23-25], usually need rigorous reaction conditions, which result in high cost and energy use, and super-small Ni(OH)2 nanoparticles (<10 nm) are hardly obtained.
In 2000, Nauta found that some extraneous water molecules could enter and exist in the water cluster in liquid helium (Fig. S1A, Supporting information) [26]. Later, Cheng proved that the distribution of ethanol and water molecules were not randomly in their mixed system (Fig.S1B)[27]. When concentration of ethanol was high, water molecules were separated into tiny agglomerates by ethanol molecules under the function of hydrogen bonds, and no isolated water molecule could be found in the system. According to the upon ideas, we pointed out“molecular cage”concept relating to the restrict area synthesis in our previous work[28-29], and molecules of glucose were used to build relatively stable“molecular cage”. In glucose solution, hydrogen bonds can be easily formed among glucose and water molecules. Once the concentration of glucose reaches a high level, water molecules will be surrounded by the“cage”(Fig. S2), and some materials with super-small nanoscale can be synthesized in the cages.
In this work, the α -Ni(OH)2 nanoparticles with 5 nm average diameter was successfully prepared by the reaction between NaOH and LiNO 3 under the existence of glucose in water solution, and the size of α-Ni(OH)2 nanoparticles was found to be controlled by the concentration of glucose (Fig. 1). However, β-Ni(OH)2 with large scale was obtained when the synthesis was processed without glucose. The preparation on α-Ni(OH)2 super- small nanoparticles is easily to be realized and has environmental friendship property.
As it is known that the Ni(OH)2 with large scale almost has no adsorption ability to Li+ ions, however, the α-Ni(OH)2 with super - small nanoscale has strong adsorption ability to Li+ when the pH value of solution is about 7.0 under room temperature. Maximum adsorption capacity of the nanoparticles to Li+ was about 214 mg·g-1, much larger than that of β-Ni(OH)2 with diame- ter of 1.0 μm (low than 30 mg·g-1).
Glucose, Ni(NO3)2, NaOH and LiNO3 were pur-chased from Beijing Chemical Reagent Company (Beijing, China). All chemicals are analytical grade and used without further purification. Deionized water was used throughout the experiments.
Nicolet 8700 Fourier transform infrared spectrometer (FTIR, Thermo Electron, USA) was used to characterize the functional groups of Ni(OH)2 samples before and after adsorption. FTIR spectra were acquired at a resolution of 4 cm-1 in a wave number range from 4 000 to 400 cm-1 with 32 co-added scans for the samples and background. X-ray diffraction (XRD) patterns of the samples were measured on a DX-1000 X-ray diffractometer with Cu Kα radiation (λ =0.154 06 nm) from 5° to 90° with a scanning rate of 10°·min-1, and the working accelerating voltage and emission current were 40 kV and 40 mA, respectively. S-4700 field emission scanning electron microscope (SEM, Hitachi, Japan) operated at 15 kV and J-3010 high resolution transmission electron microscopy (HRTEM, Hitachi J-3010, Japan) operated at 200 kV were used to observe the morphologies of synthesized Ni(OH)2 nanoparticles. The iCAP 6300 inductively coupled plasma optical atomic emission spectrometry (ICP-OES, Thermo Electron, USA) was used to investigate Li+ concentration in the solution after adsorption, and the power of ICP - OES was 1 500 W and the pump speed was 50 r·min-1. The auxiliary gas flow and atomized gas flow were 1.5 L·min-1, and the cooling air flow was 12 L·min-1. N2 adsorption-desorption isotherms were recorded on a Quantachrome NOVA 2000e sorption analyzer at the temperature of liquid nitrogen (77 K). The sample was degassed at 150 ℃ overnight prior to the measurement. The surface area was obtained by the Brunauer-Emmett -Teller (BET) method.
A certain amount of glucose (0, 5, 10 and 20 g) and 1 g of NaOH were dissolved in 100 mL of deionized water. 100 mL of Ni(NO3)2 (0.01 mol·L-1) solution was then added dropwise into the above glucose alkaline solution, and the Ni(OH)2 nanoparticle formed immediately. The products were noted as Ni-0, Ni-5, Ni-10 and Ni - 20, respectively. The synthesized Ni(OH)2 nanoparticles were separated by high-speed centrifugation (10 000 r·min-1 for 15 min) and washed with deionized water for several times to remove glucose, NaOH and other unreacted raw materials.
A certain amount of LiNO3 (from 0.02 to 1.5 g) was dissolved with 1 L of deionized water to obtain the solutions with different concentrations (from 20 to 1 500 mg·L-1) of Li+. The adsorption kinetics for Li+ on the surface of Ni(OH)2 nanoparticles was obtained from a series of experiments by dispersing 0.2 g of Ni-20 sample into 200 mL Li+ aqueous solution. The effect of temperature (from 20 to 80 ℃) was studied with the initial concentration of Li+ at 80 mg·L-1 and the contact time of 0.5 h. The effect of contact time (from 10 min to 6 h) on the adsorption process was investigated with the initial concentration of Li+ at 80 mg·L-1 under 20 ℃. The adsorption effect of concentration (from 20 to 1 500 mg·L-1) of Li+ was studied at 20 ℃ for 2 h. The mixtures after adsorption were centrifugated (10 000 r·min-1 for 15 min) and the supernates were characterized by ICP test to investigate the concentrations of residual Li+ ions. The sample Ni-0 synthesized was used to repeat the above process for a contrast. The adsorption capacity (qe, mg·g-1) was calculated with the following equation(1)
In addition, the selection adsorptions of Ni- 20 to Li+, Na+ and K+ were checked. 0.2 g of Ni-20 sample was dispersed into 200 mL neutral solution containing Li+ (1 500 mg·L-1), Na+ (1 500 mg·L-1), K+ (1 500 mg·L-1) and Mg2+ (1 500 mg·L-1) ions, and the mixture was stirred for 2 h at 20 ℃. The other experimental conditions were same as the formers.
FTIR spectra of the Ni(OH)2 particles synthesized with and without existence of glucose were studied, which are shown in Fig. 2. The product has standard absorption of β - Ni(OH)2 when no glucose was added during the preparation (Fig. 2A), and absorptions of stretching vibration of OH- in the product appeared at 3 639 cm-1. However, the spectra of the products synthesized under the existence of glucose had characteristic of α-Ni(OH)2 (Fig. 2B), and the absorptions of OHin the products were found at 3 423 cm-1. The above results indicate that the crystalline form of Ni(OH)2 synthesized changed from β to α type when glucose was added in the preparation.
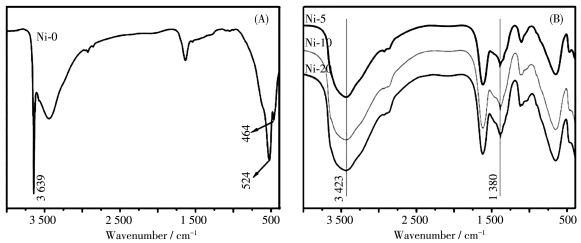
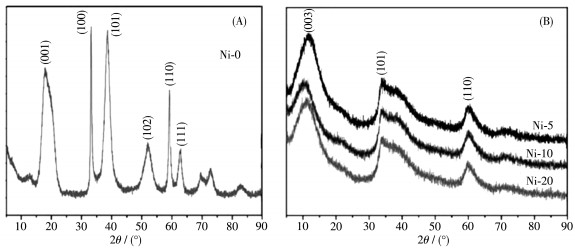
Fig. 3 shows the XRD patterns of Ni(OH)2 products. When no glucose was added during the preparation (Fig. 3A), the diffractions from (001), (100), (101), (102), (110) and (111) planes of synthesized Ni(OH)2 were found at 17.9°, 33.2°, 38.6°, 51.8°, 59.2° and 62.8°, respectively, which coincide with the standard XRD data of β-Ni(OH)2. However, when glucose was added in the preparation, XRD patterns of the Ni(OH)2 products had obvious difference from Ni- 0, and weak diffractions from (003), (101) and (110) planes of the products were located at 11.7°, 34.0° and 80.1°, respectively, which are contributed to the standard XRD pattern of α-Ni(OH)2. However, the crystallinities of these samples are low. The XRD results also proves the change of crystalline form of Ni(OH)2 particles with the glucose being added or not in preparation.
SEM images (Fig. 4) show that the morphologies of Ni(OH)2 products have obvious differences among Ni- 0, Ni-5, Ni-10 and Ni-20. 200 particles of Ni-10 and Ni -20 were chosen randomly to obtain the relevant statistical particle size. Ni-0 shows irregular bulk morphology (Fig. 4A), and there is only simple ionic reaction between Ni2+ and OH- when no glucose was added in the preparation. The morphology of Ni-5 (5 g of glucose was added, Fig. 4B) has obvious change comparing with Ni - 0, and some globular particles in the product appeared. The particle size distribution in Ni-5 was difficult to evaluate for the serious agglomeration. When the amount of added glucose was increased to 10 g in the preparation, the product (Ni-10) had irregular small particle morphology (Fig. 4C) and its diameter distribution ranged from 10 to 190 nm with an average value of 70 nm. When the amount of added glucose was increased to 20 g in the reaction, the product (Ni- 20) had super - small globular morphology, and diameter distribution of the particles ranged from 3 to 8 nm with an average value of 5 nm (Fig. 4D), further smaller than those of Ni-5 and Ni-10. That is to say, a few“restricted areas”were formed when little glucose was added, and the regular small α-Ni(OH)2 nanoparticles were difficult to obtained. On the contrary, the number of “restricted area”was increased with the increasing amount of added glucose and the size and morphology of α-Ni(OH)2 were controlled by the limitation domain effect. All the reactions between Ni2+ and OH- happened in the areas when the number of“restricted area”reached saturation. Moreover, the BET analysis shows that the surface area of synthesized Ni-20 nanoparticles was about 101 m2·g-1 while Ni-0 was only 29 m2·g-1.
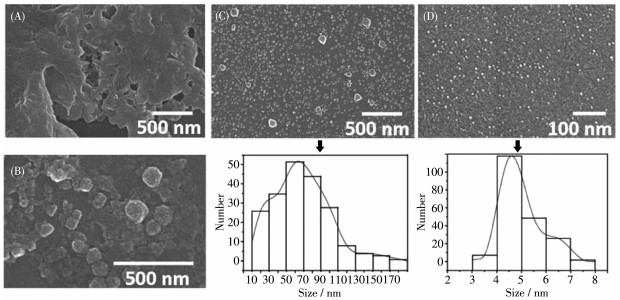
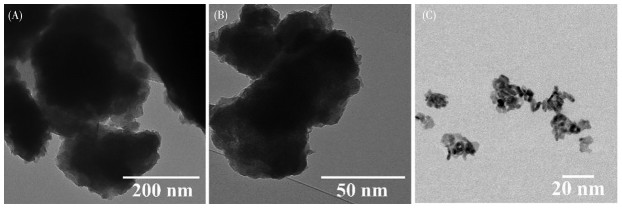
Fig. 5 shows the HRTEM images of Ni-5, Ni-10 and Ni-20. When 5 g of glucose was added in the reaction (Fig. 5A), Ni-5 showed irregular bulk morphology and the corresponding particle size of the product was about 200 nm. When the amount of added glucose was increased to 10 g (Fig. 5B), the size of α-Ni(OH)2 particle was obvious smaller than Ni-5, but its morphology was still irregularity. However, when the additive amount of glucose was further increased to 20 g (Fig. 5C), almost all α-Ni(OH)2 particles showed super-small size and the diameters of these particles were smaller than 10 nm. The HRTEM results are consistent with SEM results.
Restricted area (or molecular cage) effect of glucose in water solution possibly plays an important role in the synthesis. Some restricted areas will be formed by the hydrogen bonds among glucose molecules, for existence of hydroxyls in the molecules. The restricted area will be difficult to be formed when concentration of glucose is low in the solution, and the opposite case will appear when concentration of glucose is high. In a glucose solution with high concentration, the reactions between Ni2+ and OH- will be restricted in the molecular cages and Ni(OH)2 particles with small diameters will be obtained. This synthetic effect of molecular cage is more and more evident with increase of glucose concentration until numbers of the cages reach saturation. Thus, Ni(OH)2 with super-small globular scale and narrow distribution in size was finally synthesized.
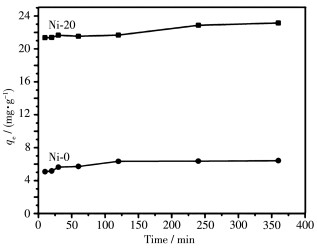
The sample Ni-20 was chosen to study the adsorption ability of α-Ni(OH)2 to Li+ ions, and Ni-0 was used for a comparison. Fig. 6 shows that the adsorption effects of Ni - 20 and Ni - 0 with contact time from 10 min to 6 h while the initial concentration of Li+ was 80 mg·L-1 and the temperature during the adsorption process was at 20 ℃. The result shows that the adsorption capacity of Ni - 0 was lower than 10 mg·g-1 after 6 h, indicating a low adsorption of bulk β-Ni(OH)2 to Li+ ions. However, the adsorption capacity of Ni-20 was about 23 mg·g-1 under the same conditions.
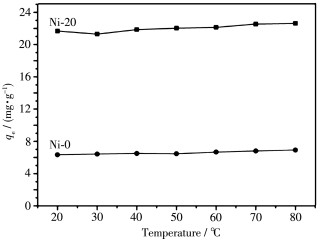
The temperature effects on adsorption process of Ni-20 and Ni-0 to Li+ at the initial concentration of 80 mg·L-1 in 30 min are shown in Fig. 7. With increase of the temperature, the adsorption capacities of both Ni- 20 and Ni-0 increased slowly and Ni-20 showed better adsorption abilities than those of Ni-0 at any temperatures. Improvement on adsorption performance of Ni(OH)2 by increasing of temperature has a little affect.
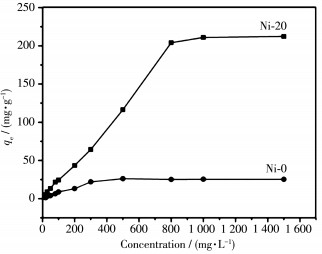
Adsorption isotherm studies are important to determine the efficacy of adsorbent. The adsorption isotherms of Ni-20 and Ni-0 were investigated by varying Li+ concentration from 20 to 1 500 mg·L-1 when the other conditions was T=20 ℃, contact time=2 h and pH =7.0 (Fig. 8). For Ni-0, even when the initial concentration of Li+ increased to 1 500 mg·L-1, the adsorption capacity was still low than 30 mg·g-1, showing poor adsorption performance to Li+. However, the largest adsorption capacity of Ni-20 was near to 214 mg·g-1, showing excellent adsorption ability. The largest adsorption capacities of Ni - 10 and Ni - 5 were about 107 and 63 mg·g-1 under the conditions, respectively. The above results indicate that the significant influence from size effect of the samples on the adsorption performance.
On the other hand, many differences on the adsorption ability of super-small α-Ni(OH)2 nanoparticles to different alkali metal ions were found. The largest adsorption capacities of Ni- 20 to Li+, Na+ and K+ were 152, 43 and 19 mg·g-1, respectively, when 0.2 g of Ni-20 was dispersed in a neutral solution containing Li+ (1 500 mg·L-1), Na+ (1 500 mg·L-1) and K+ ions (1 500 mg·L-1) for 2 h at 20 ℃. However, when the mixture contained Mg2+ ions (1 500 mg·L-1), the largest adsorption capacities of Ni-20 to the four ions were 73 mg·g-1 (Li+), 35 mg·g-1 (Na+), 14 mg·g-1 (K+) and 84 mg·g-1 (Mg2+) under the same conditions as former. The adsorbent has selective adsorption among Li+, Na+ and K+ ions, but not to Mg2+ ion. The reason on the difference possibly come from different diameters and valences of the metal ions, diameters of Li+, Na+, K+ and Mg2+ are 76, 102, 138 and 72 pm, respectively, and va-lence of Mg2+ is larger than the others.
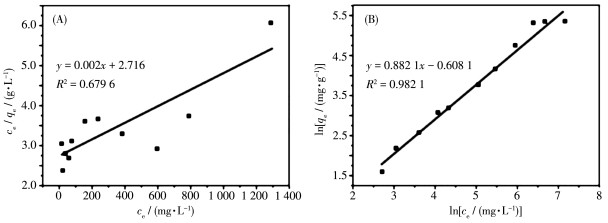
Langmuir and Freundlich adsorption models were used to investigate the adsorption behaviors of Ni-20 to Li+. Langmuir equation is expressed as follow:
|
$ \frac{{{c_{\rm{e}}}}}{{{q_{\rm{e}}}}} = \frac{1}{{{Q_{\max }}K}} + \frac{{{c_{\rm{e}}}}}{{{Q_{\max }}}} $ |
(2) |
Where qe is the equilibrium adsorption capacity (mg·g-1), ce is the equilibrium concentration (mg· L-1) of metallic ion, Qmax is the max adsorption capacity, K is the Langmuir constant which is relative to the adsorption ability.
Freundlich equation is expressed as follow:
|
$ \ln {q_{\rm{e}}} = \ln {K_{\rm{f}}} + \frac{1}{n}\ln {c_{\rm{e}}} $ |
(3) |
Where qe is the equilibrium adsorption capacity, ce is the equilibrium concentration (mg·L-1) of metal ion, Kf and n are the Freundlich model constants that can be determined by plotting ln qe versus ln ce.
Fig. 9A indicates that a linear plot cannot be obtained when ce/qe was plotted against ce (the corresponding R2 was only 0.679 6). That is to say, Langmuir model is not suitable to describe the adsorption process. On the contrary, a linear plot could be obtained when ln qe was plotted against ln ce (Fig. 9B, the corresponding R2 was 0.982 1), suggesting the adsorption accords with Freundlich model and the adsorption has a multilayer adsorption process.
SEM and FTIR were used to investigate the change on structures of Ni-20 after adsorption (Fig. 10).The size of adsorbents after the adsorption had significant increase with the increase of initial concentration of Li+. When initial concentration of Li+ was 20 mg·L-1 (Fig. 10A), the size and morphology of adsorption product was similar to the original particles for a low adsorption capacity. With the increase of initial Li+ concentration, the size of adsorbent after adsorption had obvious increase. Meanwhile, some aggregates appeared in the cases.
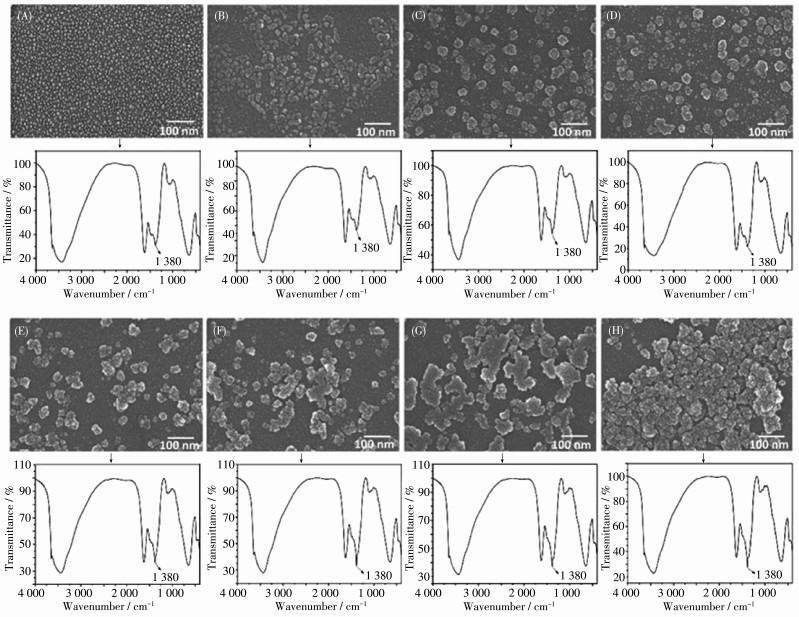
FTIR spectra of the adsorption products were similar to that of Ni- 20 when initial concentrations of Li+ were low (Fig. 10A~10D). While when the initial concentration of Li+ was more than 100 mg·L-1 (Fig. 10E~10H), the adsorption of NO3- at 1 380 cm-1 became stronger, indicating more NO3- ions were adsorbed simultaneously and LiNO3 possibly formed in the layer-by-layer adsorption process. However, LiNO3 forming on the surface of adsorbent did not dissolve again in the solutions with high concentrations of Li+.
The multilayer adsorption in this study can be explained. Due to the existence of large number of OH- groups on the surface of α -Ni(OH)2 nanoparticles and super small in size, the surface polarity of the nanoparticles is very strong. At the very beginning, some NO3- groups are stabled on the surface of nanoparticles by hydrogen bonds for the existence of OH- in Ni(OH)2. At the same time, some Li+ ions are embedded in the gaps of adsorbed NO3- groups to balance the electronegativity from nitrate, then a uniform adsorption layer of NO3- groups and Li+ ions is thus formed on the nanoparticle surface. Later, Li+ ions and NO3- groups are adsorbed continually for the electronegativity of NO3- and the positivity of Li+ adsorbed previously, and a multilayer adsorption is thus formed. Under the strong actions among the ions adsorbed and ions to the adsorbent, the NO3- and Li+ ions adsorbed could not be dissolved again. This is the reason why the particle size of Ni(OH)2 nanoparticles as adsorbents increases dramatically after adsorption.
A“molecular confinement”method was used to prepare super-small α-Ni(OH)2 nanoparticles with average diameter of 5 nm in this work. The α-Ni(OH)2 nanoparticles were used adsorbents to adsorb Li+ from water. Compared with traditional bulk β-Ni(OH)2 that had a little adsorption to Li+, the adsorption ability of super-small α-Ni(OH)2 nanoparticles had obvious improvement and its largest adsorption capacity was near to 214 mg·g-1 in high concentration solution of Li+. Further studies indicate that the adsorption obeys the Freundlich mode, and LiNO3 is possibly formed simultaneously on surface of the adsorbent during adsorption process.
Park J, Park S S, Won Y S. Electrochim. Acta, 2013, 107:467-472 doi: 10.1016/j.electacta.2013.06.059
Yan L, Yu H X, Qian S S, Li P, Lin X T, Long N B, Zhang R F, Shui M, Shu J. Electrochim. Acta, 2016, 213:217-224 doi: 10.1016/j.electacta.2016.07.115
Li X, Lin H C, Cui W J, Xiao Q, Zhao J B. ACS Appl. Mater. Interfaces, 2014, 6:7895-7901 doi: 10.1021/am501220f
Wang Y, Rong H B, Li B Z, Xing L D, Li X P, Li W S. J. Power Sources, 2014, 246:213-218 doi: 10.1016/j.jpowsour.2013.07.093
Long D H, Jeong M G, Lee Y S, Choi W, Lee J K, Oh I H, Jung H G. ACS Appl. Mater. Interfaces, 2015, 7:10250-10257 doi: 10.1021/acsami.5b00776
Choubey P K, Chung K S, Kim M S, Lee J C, Srivastave R R. Miner. Eng., 2017, 110:104-121 doi: 10.1016/j.mineng.2017.04.008
Ma L W, Nie Z R, Xi X L, Zhao L Y, Chen B Z. J. Environ. Chem. Eng., 2017, 5:995-1003 doi: 10.1016/j.jece.2017.01.024
Wang S L, Li P, Cui W W, Zhang H L, Wang H Y, Zheng S L, Zhang Y. RSC Adv., 2016, 6:102608-102616 doi: 10.1039/C6RA18018C
Xiao G P, Tong K F, Zhou L S, Xiao J L, Sun S Y, Li P, Yu J G. Ind. Eng. Chem. Res., 2012, 51:10921-10929 doi: 10.1021/ie300087s
Chen M M, Wu R Y, Ju S G, Zhang X X, Xue F, Xing W H. Microporous Mesoporous Mater., 2018, 261:29-34 doi: 10.1016/j.micromeso.2017.10.058
Sun S, Chen L Y, Sun H L, Zhang T Y. Electrochim. Acta, 2018, 259:1089-1094 doi: 10.1016/j.electacta.2017.11.017
Fan X F, Zheng W T, Kuo J L. ACS Appl. Mater. Interfaces, 2012, 4:2432-2438 doi: 10.1021/am3000962
Fan X F, Zheng W T, Kuo J L, Singh D J. ACS Appl. Mater. Interfaces, 2013, 5:7793-7797 doi: 10.1021/am401548c
Yildirim H, Kinaci A, Zhao Z J, Chan M K Y, Greeley J P. ACS Appl. Mater. Interfaces, 2014, 6:21141-21150 doi: 10.1021/am506008w
Koh W, Lee J H, Lee S G., Choi J I, Jang S S. RSC Adv., 2015, 5:32819-32825 doi: 10.1039/C4RA15619F
Li H, Ding Y C, Yuan J L, Wang Z Y. J. Power Sources, 1995, 57(57):137-140
Saeed M, Ilyas M. Appl. Catal. B, 2013, 129:247-254 doi: 10.1016/j.apcatb.2012.09.028
Jiang Z F, Xie J M, Jiang D L, Wei X J, Chen M. CrystEngComm, 2013, 15:560-569 doi: 10.1039/C2CE26398J
Jiang C, Zhao B, Cheng J Y, Li J Q, Zhang H J, Tang Z H, Yang J H. Electrochim. Acta, 2015, 173:399-407 doi: 10.1016/j.electacta.2015.05.081
Xiao Q, Wang X X, Huang S P. Mater. Lett., 2017, 198:19-22 doi: 10.1016/j.matlet.2017.03.172
Wang H Z, Shi X, Zhang W G, Yao S W. J. Alloys Compd., 2017, 711:643-651 doi: 10.1016/j.jallcom.2017.04.035
Wang T, Pan J Q, Achille K G, Sun Y Z. Int. J. Hydrogen Energy, 2017, 42:19139-19147 doi: 10.1016/j.ijhydene.2017.06.012
Numan A, Duraisamy N, Omar F S, Gopi D, Ramesh K, Ramesh S. Prog. Nat. Sci., 2017, 4:416-423
Vidotti M, Van Greco C, Ponzio E A, Cordoba de Torresi S I. Electrochem. Commun., 2006, 8:554-560
Abbasian H, Ghanbari D. Physica E, 2015, 65:106-109 doi: 10.1016/j.physe.2014.09.001
Nauta K, Miller R E. Science, 2000, 287:293-295 doi: 10.1126/science.287.5451.293
CHENG Y S, ZHANG C J. Journal of Taishan Medical College, 2007, 28(4):263-266 doi: 10.3969/j.issn.1004-7115.2007.04.008
Jing N, Zhou A N, Xiang Y Q, Xu Q H. Mater. Chem. Phys., 2018, 205:480-486 doi: 10.1016/j.matchemphys.2017.11.059
Jing N, Zhou A N, Xu Q H. J. Hazard. Mater., 2018, 353:89-98 doi: 10.1016/j.jhazmat.2018.02.049

Figure 2 FTIR spectra of Ni(OH)2 nanoparticles prepared with various glucose concentrations

Figure 3 XRD patterns of Ni(OH)2 nanoparticles prepared with various glucose concentrations

Figure 4 SEM images and the corresponding statistical particle size results of Ni(OH)2 prepared with various glucose concentrations: Ni-0 (A), Ni-5 (B), Ni-10 (C) and Ni-20 (D)

Figure 5 HRTEM images of α-Ni(OH)2 prepared with various glucose concentrations: Ni-5 (A), Ni-10 (B) and Ni-20 (C)

Figure 6 Effect of contact time (10, 20, 30 min, 1, 2, 4 and 6 h) on adsorption capacity for Ni-0 and Ni-20

Figure 7 Effect of temperature (20, 30, 40, 50, 60, 70 and 80 ℃) on adsorption capacity for Ni-0 and Ni-20

Figure 8 Effect of initial metal concentration (from 20 to 1 500 mg·L-1) on adsorption capacity for Ni-20

 扫一扫看文章

扫一扫关注我们
 下载:
下载:

 下载:
下载:

