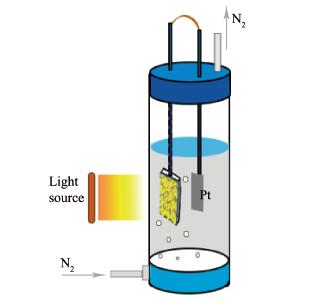
Figure 1.
Schematic illustration on a PEC N2 fixation install
Fabrication of ZnIn2S4/Au Nanosheet Arrays for Visible-Light-Response Photoelectrochemical N2 Fixation
Kun LI , Xiao-Yan CAI , Yu-Long ZHAO , Xiu-Quan GU , Liang MAO

Ammonia plays a unique role in the agricultural production, biomedicine, electronic technology, energy and chemical industries[1-2]. Meanwhile, ammonia pos-sesses the advantages of high hydrogen content (mass fraction of 17.6%) and energy density[3-5], which is also considered as an ideal hydrogen storage material and can be used as a fuel source for fuel cells. The demand for ammonia is rising with the social development. Tra-ditionally, the N2 fixation process requires both H2 and other harsh conditions[4-6], while H2 is mainly obtained from the decomposition of fossil fuels, leading to a large energy consumption and release of greenhouse gases[7]. Thus, it is necessary to develop a green, cheap route to synthesize ammonia.
Recently, much attention has been paid onto pho-tocatalytic N 2 fixation, which is a cheap, green route for synthesizing the ammonia. The triple bond of N2 owns a large bond energy of 941 kJ·mol-1[8], thus the N 2 reduction is much more difficult than water splitting into H2. As is well known to all, TiO2 is one of the earliest photocatalysts for N2 fixation. Early in 1977, Schrauzer et al. discovered that NH 3 could be produced by using a Fe - doped TiO2 NPs photocatalyst under ultraviolet (UV) illumination[9].
So far, a series of photocatalysts have been demonstrated to own photocatalytic N2 fixation capability, including TiO 2[10], BiOBr[11], CdS[12], g-C3N4[13] and so on. Li et al. have illustrated that the BiOBr nanosheets of oxygen vacancies possessed a capability to reduce N2 under visible light irradiation, leading to a photocatalyt-ic NH3 yield rate of 104.2 mmol·h-1 [11]. Wang et al. reported a visible -light- driven photocatalytic N 2 reduc-tion process by using a type of K+ doped g-C3N4 nanoribbon photocatalysts, producing a considerable NH3 yield of 3.42 mmol·g-1·h-1 [14].
Compared to the powders-based photocatalytic N2 fixation system, the photoelectrochemical (PEC) cell might own a larger advantage for the N2 fixation. Under a bias, the carrier separation could be more efficient, leading to a higher activity of photoexcited electrons to reduce N2. Li et al. firstly used Au NPs to modify TiO2 nanorod arrays electrode since 2017, and 13.4 nmol·cm-2·h-1 of photocatalytic ammonia production rate was achieved under 1 sun illumination[15]. The local surface plasmon resonance (LSPR) effect induced by the Au NPs enhances visible light absorption and makes up for the shortcoming of TiO2 poor absorption of visible light[16-17]. Hu et al. also demonstrated that Au NPs could facilitate activating the N2 molecules under a natural solar irradiation, and confirmed that Au nanoparticles could convert photons into a strong elec-tric field from a theoretical viewpoint, thereby inducing more photoexcited charges in the photocatalyst[18].
Recently, metal chalcogenides have attracted a great deal of attention in the photocatalysis fields, ow-ing to their advantages of visible light absorption and excellent charge transport properties[19]. However, bina-ry chalcogenides (e. g., CdS, MoS2) always exhibit poor stability during the photocatalysis reaction. In contrast, the polymetallic chalcogenides display excellent photo-catalytic stability in both the water reduction or oxidiza-tion reactions. So far, ZnIn2S4 has been applied widely in many fields, including photocatalytic water splitting into H2[20-21], photoreduction of CO2[22], photodegrada-tion, and so on. Nevertheless, there haven't any reports on the PEC N2 fixation performance of ZnIn2S 4 nano-structured arrays.
In this study, the ZnIn2S4/Au (namely, ZnIn2S4 modified with ultrathin Au NPs) arrays were synthe-sized for PEC N2 fixation, while the effect of Au loading amounts was investigated on the PEC activity, too. The kinetic process of photoexcited carrier separation was characterized by the photoluminescence (PL) and PEC measurements. The results show that the Au NPs not only produce the LSPR to enhance the visible light absorption of the ZnIn2 S 4, but also reduces the carrier recombination rate and increases the lifetime of photo-generated charges under strong optical electric field. The photocatalytic ammonia production rate of ZnIn2S4/ Au(40) NSA reached 2.26 μg·cm-2·h-1, which was twice higher than the pure ZnIn2S4 without any Au loading.
ZnIn2S4 NSAs were prepared on the FTO glass substrates by a facile hydrothermal method[23-24]. Initially, a precursor solution was prepared by adding Zn(NO3)2· 6H2O (0.5 mmol, 99%, Sinopharm), InCl3·4H2O (1 mmol, 99%, Macklin) and CH4N2S (2 mmol, 98%, Macklin) into 20 mL distilled water (DI water), and then stirred for 20 min. The pH value of this mixture solution was adjusted to 2.0 by adding the dilute HCl solution dropwise. Afterwards, the above solution and two same FTO substrates were transferred to 50 mL Teflon kettles. These Teflon kettles were sealed up and kept at 180 ℃ for 180 min in an oven. After cooling down, ZnIn2S 4 NSAs samples were taken out and washed by DI water for 2 min, dried at 60 ℃ overnight in a vacuum oven.
The ZnIn2S4/Au NSAs were prepared via a photo-deposition route. Typically, a ZnIn2S4 NSAs sample was immersed into a diluent HAuCl4 aqueous solution. After 30 min illumination by a 500 W Xe lamp, the ZnIn2 S4/Au samples were taken out, washed by DI water and dried at 60 ℃ in a vacuum oven. Three ZnIn2S4/Au NSAs samples were prepared and labeled as ZnIn2S4/Au(X), depending on the adding volume (μL) values (X=20, 40, 60) of the primary HAuCl4 so-lution (50 mmol·L-1) into 100 mL DI water.
The crystal structure of the samples was measured by X-ray diffraction (XRD, Haoyuan DX-2700) with a Cu Kα source (λ =0.154 06 nm) and a scanning range from 10° to 80°. X - ray tube voltage and current were set at 40 kV and 30 mA, respectively. The morphology was investigated by both the field - emission scanning electron microscopy (FESEM, SU8220, Hitachi) operat-ing at 10 kV. The chemical composition and valence states were evaluated by X-ray photoelectron spectros-copy (XPS, EscaLab 250Xi). The absorption spectra were recorded on a Varian Cary 300 UV - Vis spectro-photometer with an integrating sphere. The steady-state PL spectra were tested on a FS5 fluorescence spectrom-eter with an excitation wavelength of 370 nm, while the time-resolved photoluminescence (TRPL) spectra were acquired on FLS980. All the above measurements were carried out at room temperature (RT).
As displayed in Fig. 1, the photocatalytic N2 fixa-tion was carried out in a quartz tube, which contained 30 mL methanol aqueous solution (Vwater:Vmethanol=4:1). Herein, a ZnIn2S4/Au NSAs and a Pt foil were applied as the working and the counter electrodes, respectively. And also, two electrodes were connected with a wire di-rectly, without any external bias in the whole measure-ment process. Prior to the reaction, the pure N2 was bubbled into the solution with a flow of 20 mL·min-1 for 30 min to exhaust air. The ZnIn2S4/Au samples were irradiated by a full solar spectrum light source with an intensity of 100 mW·cm-2, which was provided by a 500 W Xe lamp without any filters. The 1.0 mL reac-tion solution was taken out from the tube every 25 min and mixed with Nessler's reagent for evaluating the concentration of NH4+, since NH3 was totally dissolved in water. The NH4+ concentration was determined by monitoring the absorbance at 420 nm timely with a UV-Vis spectrometer.
A three-electrode system was used for PEC mea-surements in a cubic quartz cell, which was connected with an electrochemical workstation (CHI660E). A 500 W Xe lamp was employed for providing a full-spectrum irradiation, and also a Pt foil, saturated calomel (Hg/ HgCl2, SCE) and a ZnIn2S4/Au(X) sample were em-ployed as the counter, reference and the working elec-trodes, respectively. A 0.1 mol·L-1 Na2SO4 aqueous so-lution (pH=7.0) was used as the electrolyte. The poten-tials versus SCE (VSCE) were converted to those versus reversible hydrogen electrode (VRHE) through the Nernst equation:
|
$ {V_{{\rm{RHE}}}} = {V_{{\rm{SCE}}}} + 0.059{\rm{pH + 0}}{\rm{.242}} $ |
(1) |
The PEC measurements have the same illumination intensity with the fixation of N2. The electrochemical impedance spectra (EIS) were recorded under irradia-tion at 0.2 V (vs SCE) with the frequency varying from 10-2 Hz to 50 kHz, while the Mott-Schottky (M-S) plots were measured at a constant frequency of 1 kHz. The photocurrentdensity-time (J-t) plots were obtained under a bias of 0 V (vs SCE) with an alternative irradiation.
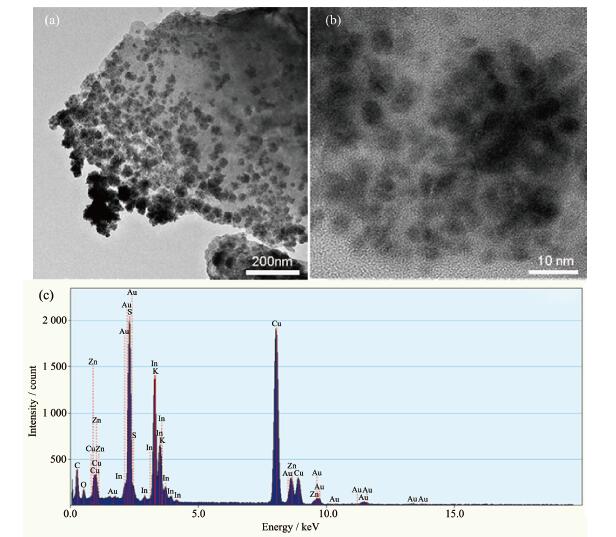
Fig. 2 compares the FESEM images of ZnIn2S4 and ZnIn 2S4/Au NSAs samples. It shows that ZnIn2S4 NSAs with uniform thickness were distributed on FTO glass substrates. Apparently, ZnIn2S4 NSAs has a typical pet-al-shaped structures, which not only could provide mul-tiple reflection to increase the visible- light utiliza-tion[25-26], but also have a larger specific surface area and active sites. The edges of ZnIn 2 S4 NSAs have high-er photoelectric activity than the planes[20], thus the Au3+ is more easily reduced to Au NPs on the ZnIn2S4 NSAs edges. The deposition amount of Au NPs increas-es with increasing the HAuCl4 concentration, while the ZnIn2S4 NSA morphology did not change after Au load-ing. Fig. 3 displays the TEM images of ZnIn2S4/Au(40) NSAs and the corresponding energy dispersive X-ray spectroscopy (EDS) pattern. Apparently, the average size of these Au NPs was about 5 nm, while the Au NPs were mainly distributed in the regions near the edges. The existence of Au elements is also confirmed in the EDS spectrum indicated in Fig. 3c.
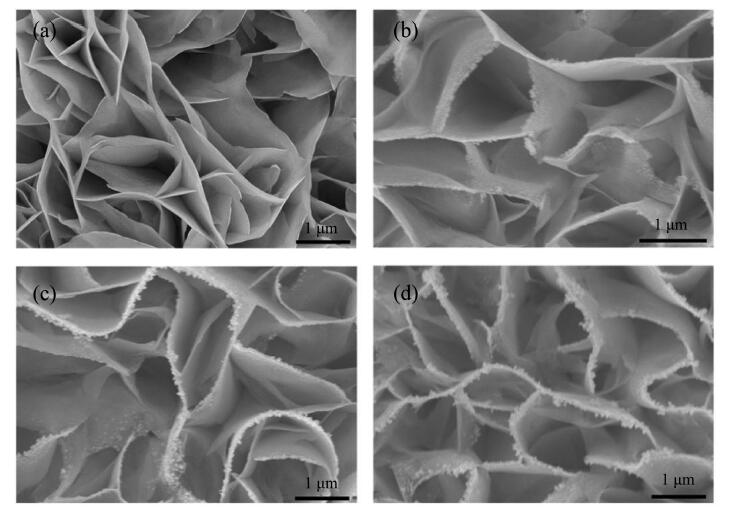
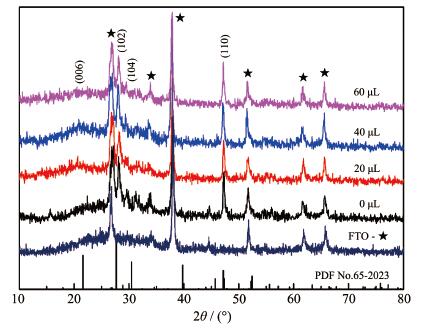
Fig. 4a also shows the XRD patterns of the sam-ples with various Au loading amounts. All the peaks can be indexed to the hexagonal phase of ZnIn2S4 (PDF No.65-2023), except a few peaks from the cubic phase SnO2 (the main composition of FTO substrate). It should be noted that three main peaks of ZnIn2S4 appeared at 27.69°, 30.45°, 47.19° and were assigned to the (102), (104), (110) planes, respectively. No any Au related peaks were found in the ZnIn2S4/Au NSAs due to their ultralow Au loading amounts. It is worth mentioning that the Au mass loading content of ZnIn2 S4/ Au(40) could be determined to approximately 1.6% by using an inductively coupled plasma mass spectrome-try (ICP-MS).
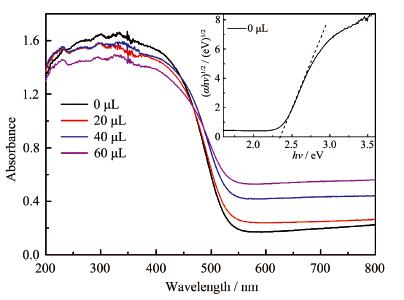
The light absorption properties of the samples are analyzed by UV-Vis absorption spectroscopy, as shown in Fig. 5. Apparently, ZnIn2S4 displays a clear absorp-tion edge around 500 nm, corresponding to its direct bandgap of ~2.33 eV. After loading Au NPs, the visible - light absorption of ZnIn2S4 was enhanced efficiently, which might be ascribed to the unique LSPR[15, 27]. And also, it is noted that the visible light absorption capaci-ty increased with improving the Au loading amounts. Namely, the ZnIn2S4/Au(60) NSAs displays the highest visible - light absorption of all. The LSPR peak of Au was not clearly observed in Fig. 5, which might be over-lapped with the absorption peak of ZnIn2S4 (located around 530 nm).
XPS measurements were carried out to examine the chemical valence status and elemental composition of the ZnIn2S 4/Au samples (Fig. 6). S2p core level spec-trum of ZnIn2S4/Au(40) samples before and after Au loading were compared in Fig. 6a. It is worth noting that both the S2p3/2 and S2p1/2 peaks show significant shifts with regard to the ZnIn2S4 one, implying that there might be a large interaction between Au and ZnIn2S4. Such an interaction should be favor of carrier transfer between two components (Au and S). Further investiga-tion is underway, the core level spectra of the In and Zn elements are discussed in Fig. 6b and 6c. It is note-worthy that no any changes in the peak positions are detected for two elements (In and Zn), except a small change in the peak intensity. It means that Au doesn't form a chemical bond with Zn or In, but its existence would decrease the XPS signals of these elements. Fur-thermore, the existence of Au has been confirmed by the appearance of Au related peaks (i. e., Au4f7/2 and Au4 f5/2) in Fig. 6d, which proves that Au NPs exist in a zero valence state.
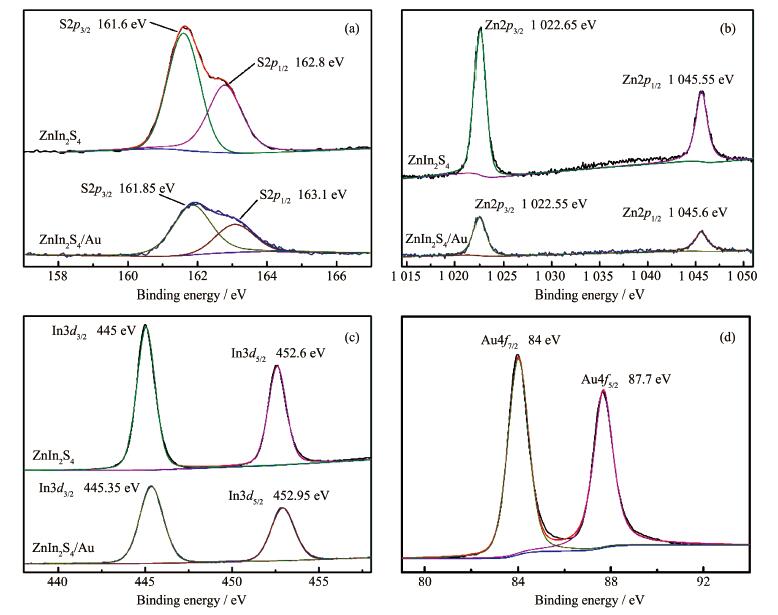
Fig. 7a compares the PEC N2 fixation performance of ZnIn2S4 NSAs loaded with various Au amounts under a full-spectrum irradiation. When a suitable amount of Au NPs was loaded onto the NSAs, the PEC N2 fixation performance reached the maximum value of 2.26 μg· cm-2·h-1 at an Au loading amount of 40 μL. The ZnIn2S 4 /Au(40) sample also displays a positive correlation of NH4+ production rate with the N2 fixation time, which is also another evidence for clarifying the excel-lent photocatalytic stability. Nevertheless, with a further increase of Au loading amounts, the PEC N2 fixa-tion performance gets reduced to 1.59 μg·cm-2 ·h-1 for ZnIn2S 4/Au(60), which might be attributed to a reduc-tion of the contact area with electrolyte. It would hinder the adsorption of N2 on the surface of ZnIn2S4 NSAs. Otherwise, the stability test of ZnIn2S 4 /Au(40) is shown in Fig. 7b, where the N 2 photofixation activity remains nearly unchanged even after five runs of the PEC mea-surements, showing that ZnIn2S4/Au has an excellent photostability for N2 photofixation under irradiation.
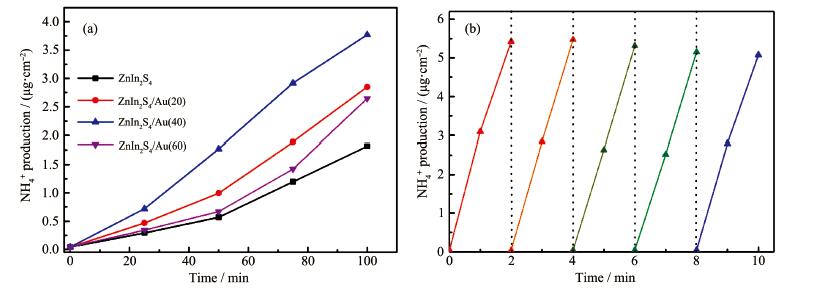
Fig. 8 also compares the PEC N2 fixation performance of ZnIn2S4 NSAs with and without adding hole scavenger into the solution. As could be seen in Fig. 8a, the ZnIn2S4 shows a poor N2 fixation activity without adding any hole scavenger (i. e., methanol). After add-ing methanol into the electrolyte, the NH4+ generation rate of ZnIn2S 4 was improved significantly, which due to an efficient suppression of the photoexcited electron-hole recombination. In details, the holes are swallowed by methanol, which provides more chances for elec-trons to reduce N2. Furthermore, Fig. 8a exhibits the PEC N2 fixation performance is also very weak when bubbled Ar into the solution, which indicating that the reaction depends on external N2. In Fig. 8b, the calibra-tion curve was obtained for quantitative analysis of the NH3 concentration, showing a better linear relationship between absorbance and ammonia concentration.
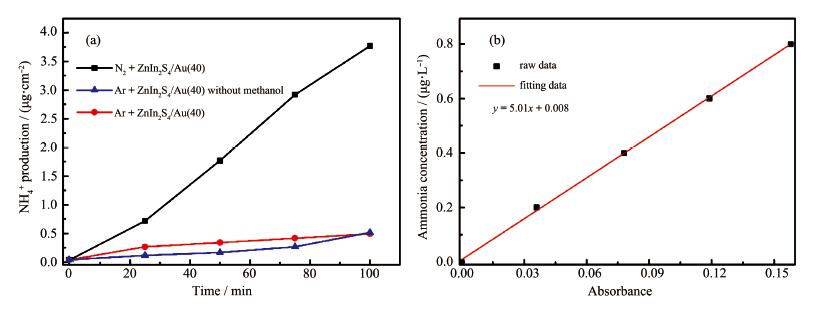
Fig. 9 also indicates the XRD patterns and SEM images of ZnIn2S4/Au after the PEC N2 fixation mea-surements for 100 min. It is found clearly that XRD patterns remained unchanged, while the Au NPs were deposited on the edges of ZnIn2S4 NSAs even after fin-ishing PEC fixation measurements. Both the ZnIn2S4 NSAs and Au NPs displayed excellent photostability, while no any photocorrosion phenomena was observed.
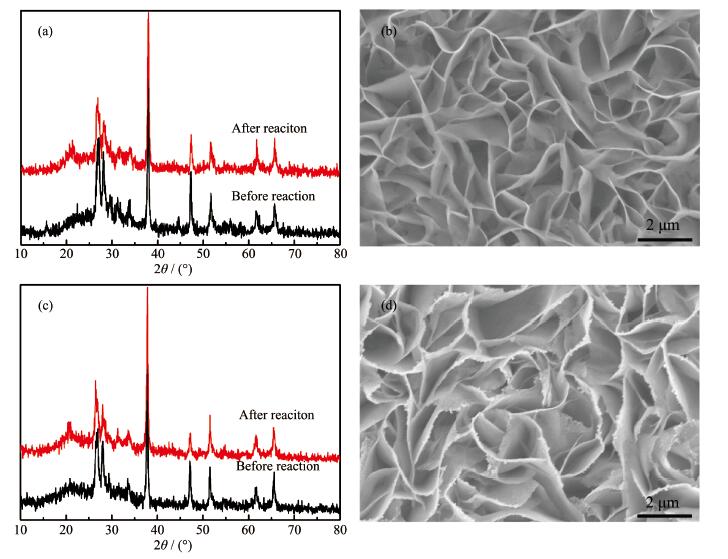
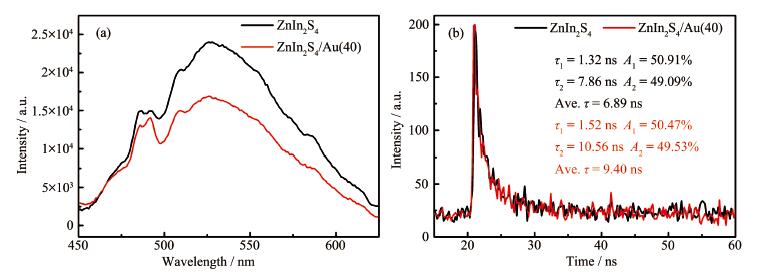
Fig. 10a also compares the steady -state PL spectra of ZnIn2S4 and ZnIn2S4/Au(40). Both the samples dis-play a broad peak centered at approximately 530 nm, which could be assigned to the near band edge emis-sion of ZnIn2S 4 (i. e., band -to-band transition). Com-pared to single ZnIn2S4, the ZnIn2S4/Au(40) displays an obvious PL quenching, suggesting that there might be a significantly enhanced carrier separation from the load-ing of Au NPs. Otherwise, the TRPL spectra of two samples were also compared in Fig. 10b to analyze the charge carrier dynamics process. Obviously, the ZnIn2S4/Au(40) displays a longer average carrier life-time (9.40 ns) than the single ZnIn2S4 (6.89 ns), indicat-ing that the Au loading could lower the electron - hole recombination or improve the carrier separation effi-ciently. The result is consistent with the phenomenon indicated in Fig. 10a, too. Thus, both the experimental results could explain why the N2 fixation performance of ZnIn2S4 was enhanced efficiently by Au loading.
In order to further understand the charge transport mechanism, the PEC measurements were carried out by constructing a three- electrode cell under a simulat-ed solar irradiation. As displayed in the Nyquist plots of Fig. 11a, the ZnIn 2 S4/Au electrode displayed a small-er semicircle than pure ZnIn2 S4, implying that the charge transfer resistance across the solid-liquid inter-face was lowered efficiently after loading the Au NPs[22]. However, with a further increase of Au NPs, the semicircle of ZnIn2S4/Au(60) was higher than that of ZnIn2S 4/Au(40), indicating that excessive Au NPs may hinder the charge carrier transfer across solid -liquid in-terface again. In Fig. 11b, the J - t plots were compared to analyze the PEC performance of different Au loaded ZnIn 2 S4 NSA samples. Obviously, all the ZnIn2S 4/Au ones displayed higher photocurrent density than the pure ZnIn2S4. Of them, the highest PEC activity ap-pears in the ZnIn2S4/Au(40) sample, which was in a good agreement with the aforementioned PEC N2 fixation results. It could be explained by a fact that the loading of Au NPs on the ZnIn2S4 NSAs enhanced both the visible - light harvesting and solid - liquid charge transfer process.
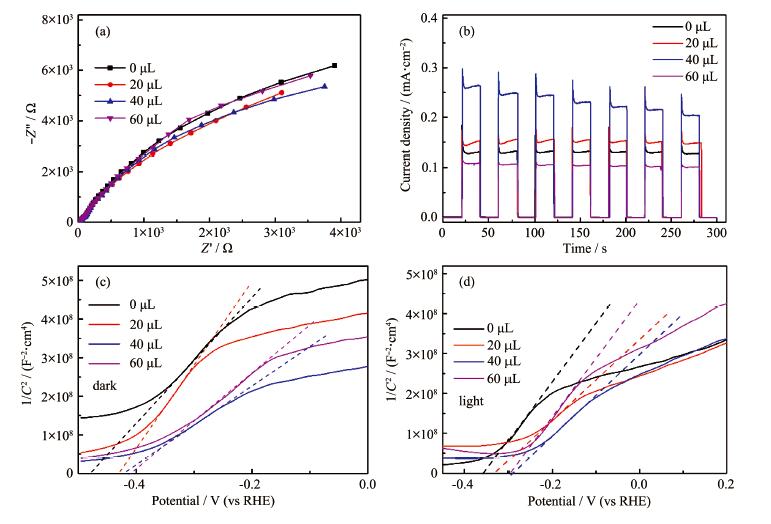
Fig. 11c and 11d show the M - S plots of ZnIn2S4 and ZnIn2 S4/Au(X) obtained in dark and light, respec-tively. As is well known, both the flat - band potential (VFB) and donor density (Nd) could be determined by fit-ting the M-S plots linearly with the following formula[28]:
|
$ \frac{1}{{{C^2}}} = \frac{2}{{{e_0}\varepsilon {\varepsilon _0}{N_{\rm{d}}}}}\left( {V - {V_{{\rm{FB}}}} - \frac{{kT}}{{{e_0}}}} \right) $ |
(2) |
where C is the interfacial capacitance; ε is the dielec-tric constant of the semiconductor; ε0 is the permittivi-ty of free space; VFB represents the flat band potential; Nd represents the charge carrier density; V is the applied voltage; k is Boltzmann's constant; T is the absolute temperature; e0 is the electronic charge of ZnIn2S4 or ZnIn2 S4/Au NSAs sample. The fitted results are displayed in Table 1. The positive slope means that all the samples are n-type semiconductors. For the M-S plots obtained in dark, the VFB value shifts towards the more positive side from -0.48 to -0.40 V (vs RHE) with increasing the Au loading amounts, while there aren't obvious changes in the plot slope (or said, Nd). It is well known that there a direct relationship between VFB and Fermi - level (EF) [29], the more positive the VFB value is, the lower the EF position is. The positive shift-ing of VFB might be related with an enhanced charge transfer from ZnIn2S4 to Au and electrolyte, leading to a lowering EF of ZnIn2S4. Furthermore, the M-S plots un-der a solar irradiation show almost the same variation trend with those measured in dark, with the VFB shifting from -0.35 to -0.28 V (vs RHE). It is worth mentioning that all the ZnIn2S4/Au samples under irradiation also display more positive VFB values than those in dark, im-plying that there isn't any electron accumulation in ZnIn2S4 even under a solar irradiation. The result fur-ther confirms that the photoexcited electron transfer pathway is from ZnIn2S4 to Au NPs, as would be illus-trated in Fig. 12.
 下载:
导出CSV
下载:
导出CSV
| Sample | In dark | Under irradiation | ||||
| Slope | VFB/ V (vs RHE) | Slope | VFB/ V (vs RHE) | |||
| ZnIn2S4 | 1.639×10⁹ | -0.48 | 1.467×10⁹ | -0.35 | ||
| ZnIn2S4/Au(20) | 2.169×10⁹ | -0.43 | 1.116×10⁹ | -0.32 | ||
| ZnIn2S4/Au(40) | 1.022×10⁹ | -0.42 | 1.024×10⁹ | -0.29 | ||
| ZnIn2S4/Au(60) | 1.243×10⁹ | -0.40 | 1.412×10⁹ | -0.28 | ||
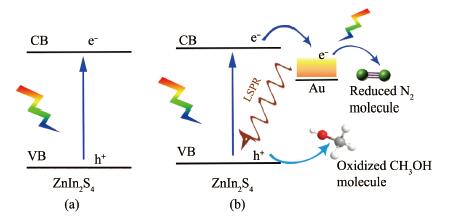
Fig. 12 also shows a schematic model to clarify the mechanism for the variation of N 2 fixation activity. For the pure ZnIn2S4 NSAs, a number of electron-hole pairs are generated by the photo-excitation. After loading with ultrathin Au NPs, the visible light absorption of ZnIn2S4 NSA was enhanced by the LSPR effect, leading to the increased number of photogenerated carriers in the semiconductor ZnIn2S 4 electrodes[30]. Meanwhile, these Au NPs also act as electrons trap, leading to a lowering of the interface resistance across solid elec-trode/liquid electrolyte. Finally, the above various fac-tors result in a significant enhancement of both the PEC activity and N2 fixation performance.
In summary, ZnIn2S4/Au NSAs were synthesized by depositing ~5 nm Au NPs on the surface of ZnIn2S4 NSAs for realizing a PEC N2 fixation (into NH3 or NH4+). It was demonstrated that the Au NPs decoration facilitated enhancing the N2 fixation activity of ZnIn2S4, reaching a maximum NH3 generation rate of 2.26 μg· cm-2·h-1 in the ZnIn2S4 /Au(40) sample. Loading the excessive Au NPs would result in a lowering of the N2 fixation performance, which might be attributed to the Au NPs blocking N2 adsorption of ZnIn2S4. The varia-tion of the N2 fixation performance is consistent with that of the PEC activity. It also means that the enhanced PEC performance after Au loading might be ascribed to the enhanced visible-light absorption, charge carrier separation and plasmon-induced reso-nance energy transfer. This work not only develops a new photoanode for the N 2 photoreduction or NH3 syn-thesis, but also expands the application of ZnIn2S4 NSAs in the PEC fields.
Smil V. Nature[J]. , 1999, 400(6743): 415-415.
Ithisuphalap K, Zhang H G, Guo L, et al. Small Methods, 2019, 3(6):1800352 doi: 10.1002/smtd.201800352
Wang S, Guan B Y, Wang X, et al. J. Am. Chem. Soc., 2018, 140(45):15145-15148 doi: 10.1021/jacs.8b07721
Christensen C H, Johannessen T, Sørensen R Z, et al. Catal. Today, 2006, 111(1/2):140-144
Mukherjee S, Cullen D A, Karakalos S, et al. Nano Energy, 2018, 48:217-226 doi: 10.1016/j.nanoen.2018.03.059
van der Ham C J M, Koper M T M, Hetterscheid D G H, et al. Chem. Soc. Rev., 2014, 43(15):5183-5191 doi: 10.1039/C4CS00085D
Medford A J, Hatzell M C. ACS Catal., 2017, 7(4):2624-2643
Jia H P, Quadrelli E A. Chem. Soc. Rev., 2014, 43(2):547-564
Schrauzer G N, Guth T D. J. Am. Chem. Soc., 1977, 99(22):7189-7193 doi: 10.1021/ja00464a015
Mao L, Cai X Y, Yang S Q, et al. Appl. Catal. B, 2019, 242:441-448 doi: 10.1016/j.apcatb.2018.10.007
Li H, Shang J, Ai Z H, et al. J. Am. Chem. Soc., 2015, 137(19):6393-6399 doi: 10.1021/jacs.5b03105
Khan M M T, Bhardwaj R C, Bhardwaj C. Angew. Chem. Int. Ed., 1988, 27(7):923-925 doi: 10.1002/anie.198809231
Liu Q X, Ai L H, Jiang J. J. Mater. Chem. A, 2018, 6(9):4102-4110 doi: 10.1039/C7TA09350K
Wang W K, Zhang H M, Zhang S B, et al. Angew. Chem. Int. Ed., 2019, 58(46):16644-16650 doi: 10.1002/anie.201908640
Li C, Wang T, Zhao Z J, et al. Angew. Chem. Int. Ed., 2018, 57(19):5278-5282 doi: 10.1002/anie.201713229
Kawawaki T, Nakagawa T, Sakamoto M, et al. J. Am. Chem. Soc., 2019, 141(21):8402-8406 doi: 10.1021/jacs.9b01419
Christopher P, Xin H L, Marimuthu A, et al. Nat. Mater., 2012, 11(12):1044-1050 doi: 10.1038/nmat3454
Cai X Y, Zhu M S, Elbanna O A, et al. ACS Catal., 2018, 8(1):122-131
Ai G J, Li H X, Liu S P, et al. Adv. Funct. Mater., 2015, 25(35):5706-5713 doi: 10.1002/adfm.201502461
Zhou M, Liu Z H, Song Q G, et al. Appl. Catal. B, 2019, 244:188-196 doi: 10.1016/j.apcatb.2018.11.031
Yang G, Ding H, Chen D M, et al. Appl. Catal. B, 2018, 234:260-267 doi: 10.1016/j.apcatb.2018.04.038
Wang S, Guan B Y, Lou X W D. J. Am. Chem. Soc., 2018, 140(15):5037-5040 doi: 10.1021/jacs.8b02200
Peng S, Zhu P, Thavasi V, et al. Nanoscale, 2011, 3(6):2602-2608 doi: 10.1039/c0nr00955e
Wang L M, Wei M, Gu X Q, et al. J. Electron. Mater., 2018, 47(11):6540-6550 doi: 10.1007/s11664-018-6573-2
Gao B, Liu L F, Liu J D, et al. Appl. Catal. B, 2013, 129:89-97 doi: 10.1016/j.apcatb.2012.09.007
Xu H C, Wang Y, Dong X L, et al. Appl. Catal. B, 2019, 257:117932 doi: 10.1016/j.apcatb.2019.117932
Kawawaki T, Takahashi Y, Tatsuma T, et al. J. Phys. Chem. C, 2013, 117(11):5901-5907 doi: 10.1021/jp3120836
Maruska H P, Ghosh A K. Sol. Energy, 1978, 20(6):443-458 doi: 10.1016/0038-092X(78)90061-0
Wang L M, Gu X Q, Zhao Y L, et al. J. Mater. Sci.-Mater. Electron., 2018, 29(22):19278-19286 doi: 10.1007/s10854-018-0054-5
Meng F K, Li J T, Cushing S K, et al. ACS Catal., 2013, 3(4):746-751

Figure 2 FESEM images of ZnIn2S4 (a), ZnIn2S4/Au(20) (b), ZnIn2S4/Au(40) (c) and ZnIn2S4/Au(60) (d) NSAs samples

Figure 5 UV-Vis absorption spectra of ZnIn2S4/Au NSAs samples with different Au loadings

Figure 6 XPS spectra of ZnIn2S4/Au(40) sample: (a) S2p, (b) Zn2p, (c) In3d and (d) Au4f

Figure 7 PEC N2 fixation (a) and cyclic stability plots (b) of ZnIn2S4/Au(40) NSAs samples

Figure 8 PEC N2 fixation with ZnIn2S4/Au(40) sample under different conditions (a); Linear relationship between peak absorbance value and NH3 concentration (b)

Figure 9 XRD patterns and SEM images of pure ZnIn2S4 (a, b) and ZnIn2S4/Au(40) (c, d) NSAs after PEC N2 fixation reactions

Figure 11 Nyquist plots under irradiation (a), J-t plots at 0 V vs SCE (b), M-S plots in dark (c) and M-S plots under irradiation (d) of ZnIn2S4/Au NASs samples with various Au loading amounts
Table 1. Calculated electronic parameters from the M-S plots in dark and Nyquist plots under irradiation
| Sample | In dark | Under irradiation | ||||
| Slope | VFB/ V (vs RHE) | Slope | VFB/ V (vs RHE) | |||
| ZnIn2S4 | 1.639×10⁹ | -0.48 | 1.467×10⁹ | -0.35 | ||
| ZnIn2S4/Au(20) | 2.169×10⁹ | -0.43 | 1.116×10⁹ | -0.32 | ||
| ZnIn2S4/Au(40) | 1.022×10⁹ | -0.42 | 1.024×10⁹ | -0.29 | ||
| ZnIn2S4/Au(60) | 1.243×10⁹ | -0.40 | 1.412×10⁹ | -0.28 | ||
 下载: 导出CSV

 扫一扫看文章

扫一扫关注我们