Figure 1.
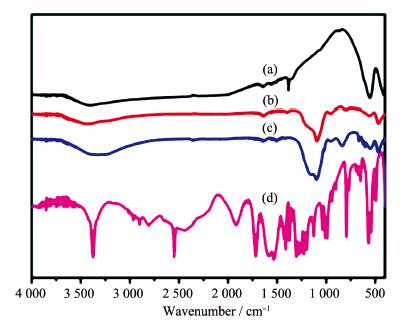
FT-IR spectra of (a) ZnFe2O4, (b) ZnFe2O4@SiO2, (c) ZnFe2O4@SiO2-NALC and (d) NALC
Chiral Discrimination Tyrosine Enantiomers Based on N-Acetyl-L-cysteine Modified ZnFe2O4@SiO2 Nanoparticles
Shao-Kai CHEN , Xin LI , Chen-Chen GUO , Yi-Xuan WEI , Sai-Wei YUAN , Hui-Hua SONG

Chirality is ubiquitous in our real life, and it is the basic feature of our life processes. Most biological ele-ments, medical drugs and many organic molecules are chiral molecules[1]. Due to the particular characteristics of chiral substances in physiological activities and life processes, the application and development of chiral substances in pharmaceuticals, biochemistry, asymmetric catalysts make more and more research groups begin to study the phenomenon of chirality.
Since a pair of enantiomers can exhibit different chemical properties, physiological and pharmacological activities under the same environment, so the identification of enantiomers is very important in the chiral field[2]. At the same time, chiral recognition is one of the important and special modes of molecular recognition, which has aroused widespread concern[3]. Current-ly, there are many methods for chiral analyses, such as chiral ligand exchange chromatography (CLEC), high performance liquid chromatography (HPLC), gas chromatography (GC), capillary electrophoresis (CE) [4]. However, these existing analytical tests strongly rely on expensive chiral columns and their operation is complicated, so it is necessary to find a method for distinguishing chiral enantiomers with low cost, less time-consuming and simple operation. Recently, recognition of chiral molecules has been developed based on optical spectroscopic techniques (such as fluorescence and ultraviolet-visible), electrochemistry, and circular dichroism (CD). These techniques have drawn special attention for discrimination of two enantiomers[5].
Due to the unique properties of metal nanoparticles with grain boundary ratio, surface energy ratio and surface atomic ratio, more and more research teams have used metal nanoparticles for chiral recognition[2-4]. Most of the nanomaterials used for chiral recognition are chiral precious metal nanomaterials[5-11] and quantum dots[12-16]. However, these nanomaterials require harsh preparation conditions or relatively high synthesis costs, so it's necessary to prepare a simple and inexpensive nanomaterial for chiral recognition. Magnetic nanomaterials are cheap, easy to obtain, and have great potential in high-efficiency separation, sensitive measurement and selective catalysis. After using a chiral selector to modify the magnetic nanoparticles, the prepared composite material not only has its own magnetic properties but also has chirality[17]. Therefore, magnetic nanomaterials modified by chiral ligands have great potential in chiral recognition. Among the spinel-structured magnetic oxides, ZnFe2O4 is a relatively special type of magnetic oxide because of its simple synthesis process, short synthesis cycle and low preparation cost. It is widely used in various fields of research[18], but application of chiral identification is still scarce. In this work, we choose ZnFe2O4 as a core material to explore its recognition ability. Due to the obvious aggregation phenomenon between magnetic nanoparticles, we need to find a solution that can reduce this phenomenon. Changing the particle morphology is an effective method. For example, the use of inorganic compounds to coat magnetic nanoparticles can alleviate the aggregation phenomenon caused by magnetism. As the first choice of shell material, SiO2 can not only reduce the interaction between magnetic particles but also play a certain stabilizing effect[19]. N-acetyl-L-cysteine (NALC) was chosen as a chiral candi-date for modifying the nanoparticles due to its chiral structure, and it can be bound to the surface of nanoparticles via the -SH and -COOH bonds through heating reflux.
Our laboratory has reported that NALC, as a chi-ral modifier, was loaded on CuFe2O4 @SiO2 nanoparticles surface, and the product was taken as chiral probes for recognition of chiral tyrosine enantiomers by using UV-Vis spectrum[20]. To further explore the mech-anism of chiral recognition, NALC -capped ZnFe2O4 @SiO2 (ZnFe 2O 4 @SiO2 -NALC) was synthesized and characterized by X-ray powder diffraction (XRD), infra-red spectroscopy (FT-IR), energy dispersive X-ray spectroscopy (EDS), scanning electron microscopy (SEM), high resolution transmission electron microsco-py (HRTEM) and vibrating sample magnetometer (VSM). The results showed that the nanomaterial can recognize the L-/D-Tyr through ultraviolet-visible spec-troscopy and fluorescence spectroscopy.
ZnCl2, sodium hydroxide and absolute ethanol were purchased from Tianjin Yongda Chemical Reagent Co., Ltd (Tianjin, China). FeCl3·6H2 O was purchased from Shanghai Maclean Biochemical Tech-nology Co., Ltd (Shanghai, China). NALC, tetraethyl orthosilicate (TEOS) and L-/D-Tyr were purchased from Beijing Belling Way Reagent Company (Beijing, China). Ammonium hydroxide was purchased from Tianjin Kaitong Chemical Reagent Company Limited (Tianjin, China).
The UV-Vis spectrum was recorded on a U-3010 Spectrophotometer (Hitachi, Japan) at room tempera-ture. The fluorescence spectra was acquired by a Fluo-rescence Spectrometer (FS5) (Edinburgh Instruments, United Kingdom).The FT-IR spectra was acquired on a FT-IR-8900 spectrometer system from 4 000 to 400 cm-1 (KBr pellets) (Shimadzu Corporation, Japan). The powder XRD patterns were collected on a Bruker D8-Advance X-ray diffractometer using Cu Kα radiation (λ =0.154 2 nm, U=40 kV, I=40 mA) in 2θ range of 10°~ 80° at room temperature. The SEM and EDS were taken with a S-4800 Cold Field Emission Scanning Electron Microscope at an acceleration voltage of 3 kV (Hitachi, Japan). The HRTEM was conducted on Hita-chi H-7650 (Hitachi, Japan). VSM were tested by 735 Vibrating sample magnetometer (LAKESHORE, USA).
ZnFe2O4 nanoparticles (NPs) were synthesized by the chemical co-precipitation method. FeCl3·6H2O (10 mmol) and ZnCl2 (5 mmol) were dissolved in deionized water (100 mL), and stirred vigorous using magnetic stirrer for 2 h at room temperature. Then the pH value of the solution was adjusted to about 13 by addition of a dilute aqueous NaOH solution, then the mixture was stirred magnetically for 6 h. The resulting precipitate was filtered, washed with deionized water and absolute ethanol until the pH value reached 7, and calcined at 500 ℃ to obtain ZnFe2O4 nanoparticles.
ZnFe2O4 (1 g) was added to a mixed solution of distilled water (20 mL) and absolute ethanol (60 mL), and the solution was sonicated for 15 min to achieve the dispersion. The concentrated ammonia water (2 mL) was added to the above solution immediately, then tetraethyl orthosilicate (TEOS, 0.5 mL) was added drop-wise to the above solution slowly under stirring vigor-ously. The resulting solution was mechanically stirred for 12 h at room temperature, and the products were collected by centrifuged, washed three times with deionized water and absolute ethanol respectively, and dried at 60 ℃ for 3 h.
ZnFe2O4@SiO 2 (1 g) was dispersed in absolute eth-anol (10 mL) using an ultrasonic bath for 30 min. Then, NALC (0.6 g) and H2SO4 (1 mL, 98%) were added to the above solution. This solution was heated under reflux conditions, and the color changes from reddish brown to light yellow green. After completion of the reflux heating, the solution was mechanically stirred overnight to allow for the completion of the reaction. The resulting nanoparticles were separated using cen-trifugation, washed with absolute ethanol, and dried at 60 ℃ for 3 h to get ZnFe2O4@SiO2-NALC chiral core-shell nanomaterial.
The FT-IR spectra of ZnFe2O4, ZnFe2O4 @SiO2, ZnFe2O4@SiO2-NALC and NALC are shown in Fig. 1. In the infrared spectrum of ZnFe2O4 (Fig. 1a), a strong and sharp absorption band appeared at ~570 cm-1 is the O-M characteristic vibration absorption peak[21-22], which is the characteristic absorption peak of zinc ferrite. New peaks at 1 092, 796 and 468 cm-1 were observed for ZnFe2O4@SiO2 and ZnFe 2O4@SiO2-NALC (Fig. 1b and 1c), which equivalent of the typical sym-metric and bending vibrations of Si-O-Si[23-27]. These results prove that the SiO2 shell has been successfully loaded on the material surface.
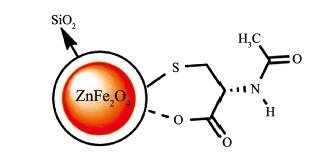
The FT-IR spectrum of NALC exhibited a series of typical characteristic peaks of amino acids. It is worth noting that, a weak band near 2 550 cm-1 virtual-ly confirms the presence of-SH group in NALC mole-cule. When NALC bound on the surface of Zn-Fe2O4@SiO2 (Fig. 1c), a dramatic collapse occurred in a range of 1 150~1 300 cm-1[28], and the peaks at 1 018 and 1 103 cm-1 are related to the stretching of C-O and C-N bonds[29], so it can be proved that there is NALC in the sample. Concurrently, the -SH stretching band at 2 550 cm-1 of NALC disappeared in the IR spectrum of NALC-modified ZnFe2O4@SiO2 nanoparticles, which indicates that the NALC and the nanoparticles are bonded by the-SH bond. In addition, the decrease of stretching vibration peak of -COOH at 1 720 cm-1 indi-cates that the carboxylic acid structure in NALC mole-cule is deprotonated[30]. This deprotonation process is assisted by the interaction of the carboxylic acid group with the ZnFe2O4@SiO2 surface, which acts as a proton acceptor[31]. Therefore, the IR spectrum show that Zn-Fe2 O4@SiO2 is compatible with NALC through the bind-ing of the two groups (-SH and -COOH) [31]. The struc-ture of ZnFe2O 4@SiO2-NALC is shown in Fig. 2.
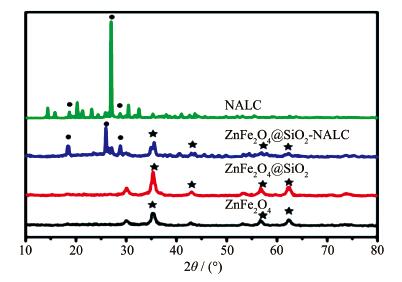
The XRD patterns of ZnFe2O4, ZnFe2O4@SiO2, and ZnFe2 O4@SiO2- NALC are shown in Fig. 3. The pow-der XRD patterns of ZnFe2O4 could be assigned to ZnFe2O4 with a cubic spinel structure (PDF No.01-082-1049). The XRD diffraction peaks of ZnFe 2O4@SiO2 are similar to the ZnFe2O4, indicating that the SiO2 shell coated on the surface of ZnFe2O4 is amor-phous[32-33]. We also used the purchased pure NALC for XRD test. The test result is shown in Fig. 3, and we could see that the synthesized ZnFe2O4@SiO2-NALC nanomaterial exhibits characteristic peaks of NALC at 2θ=18.34°, 26.08° and 28.74°. Therefore, the ZnFe2O4 @SiO2-NALC chiral nanomaterial was successfully syn-thesized. ZnFe2O4@SiO2-NALC peaks showed some irregular shift or broadening, which may be attributed to the amorphous nature of the NALC structure and its influence on the crystal morphology[5, 34].
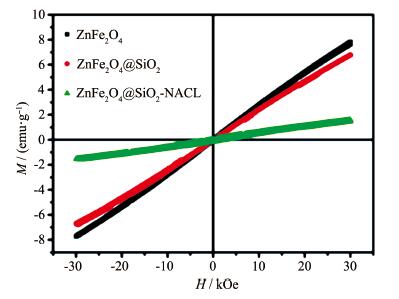
The magnetization curves of ZnFe2O4, ZnFe2O4 @SiO2 and ZnFe2O4@SiO2-NALC measured at 300 K are shown in Fig. 4. The magnetization curve was approximately a straight line, which proves all materials are paramagnetic[21]. After the ZnFe2O 4 nanoparticles were coated or modified by SiO2 and NALC, the paramagnetic decreased, which further proves that the synthesis of chiral nanomaterials is successful.
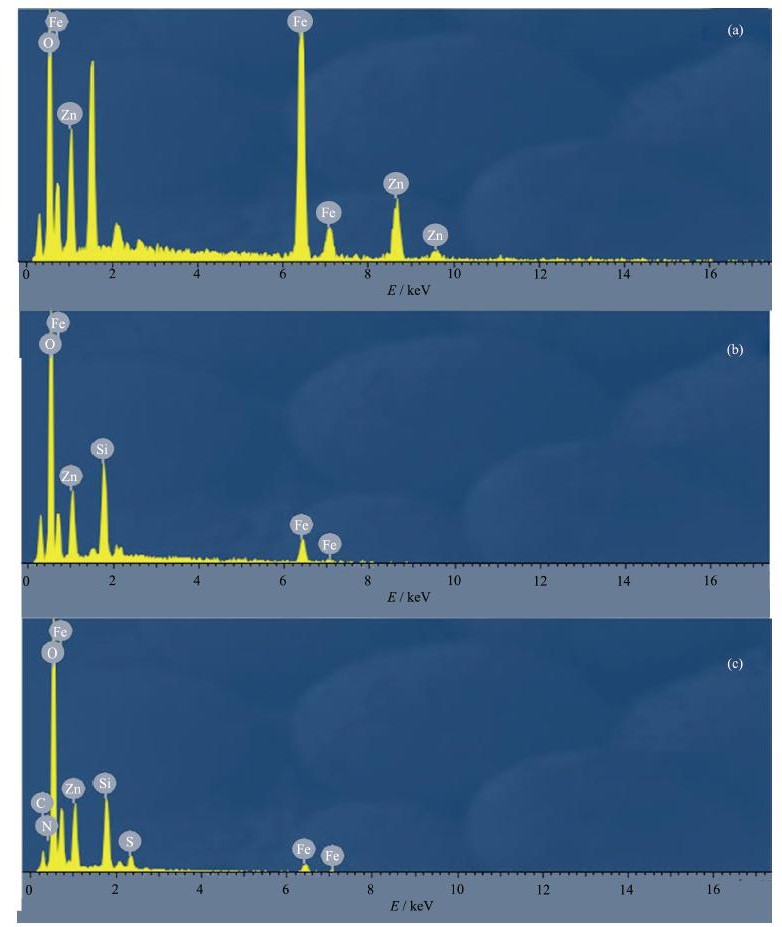
According to the EDS spectrum (Fig. 5a), the product is composed of Zn, O, Fe elements, which can prove that the product is ZnFe2O 4. As shown in Fig. 5b, there were Zn, O, Fe, Si elements, which can be attrib-uted to ZnFe2O4@SiO2. Fig. 5c is EDS spectrum of Zn-Fe2O4@SiO2 -NALC, the compound contained C, N, Fe, Zn, O, Si, S elements, which proves that it is Zn-Fe2O4@SiO2-NALC chiral compound.
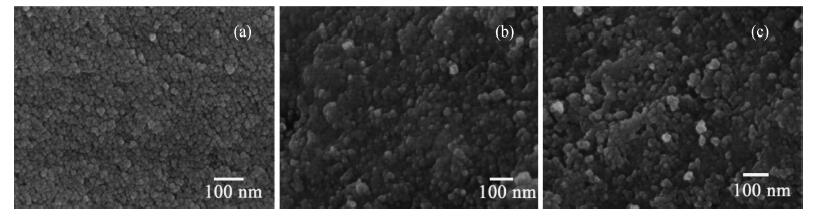
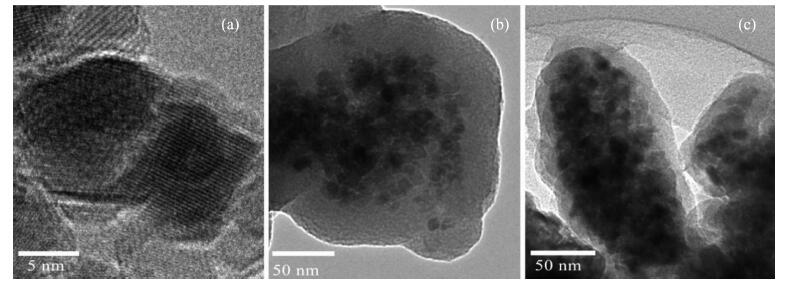
The specific morphology and structural features of pure ZnFe2O4, ZnFe2O4@SiO2, and ZnFe2O4@SiO2- NALC were characterized by SEM (Fig. 6) and HRTEM (Fig. 7). The average diameter of bare ZnFe2O4 particles was about 7 nm, and the aggregation phenomenon was obvious. After ZnFe2O4 was coated with SiO2, SEM and HRTEM images show that SiO2 covered multiple aggre-gated ZnFe 2 O4 nanoparticles to form a core-shell struc-ture with a thickness of about 30 nm (Fig. 6b and 7b). Fig. 6c and 7c show the SEM and HRTEM images of ZnFe2O 4@SiO2 surface modification with NALC. The morphology is similar to that of previously synthesized ZnFe2O4@SiO2.
The enantioselective interaction of ZnFe2O4@SiO2-NALC chiral nanomaterials can be probed using UV - Vis spectrum.
As shown in Fig.S1 (Supporting information), tyro-sine has absorption peaks at wavelengths of 220 and 274 nm, respectively. The UV absorption of L-/D-Tyr is completely coincident when the concentration of Tyr is the same. The same conclusion could be obtained with different concentrations of L-/D-Tyr, as shown in Fig. S1b and S1c. Fig.S1d presents the UV-Vis spectrum of ZnFe2O4@SiO2 and ZnFe2O4@SiO2-NALC nanoparti-cles, it can be concluded that the nanomaterials have no obvious absorption peak at 200 to 500 nm.
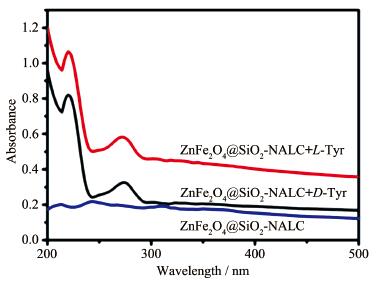
In order to study the chiral recognition ability of ZnFe2O4@SiO2-NALC, the nanoparticles were added into L-Tyr or D-Tyr solution, respectively. As shown in Fig. 8, the absorbance of L-/D-Tyr changed significantly after adding chiral nanomaterial. The D-Tyr solution showed significantly lower absorbance than L-Tyr solution.
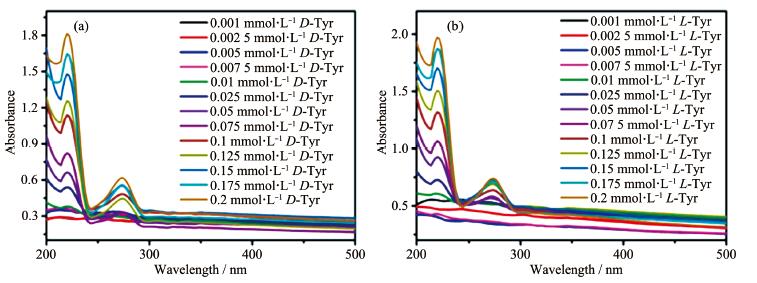
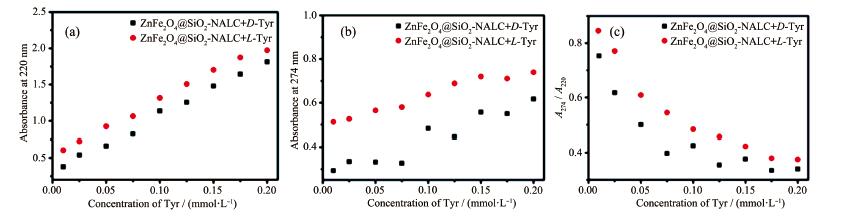
In order to verify the universality of the experi-mental results, same experimental operation was car-ried out with different concentrations of Tyr. In the presence of ZnFe2O4@SiO2-NALC, the absorbance of L-Tyr or D -Tyr with different concentrations is shown in Fig. 9. Absorbance changes in the assay mixtures recorded at 220 and 274 nm are shown in Fig. 10 and Table 1 and 2. These results show that the absorbance of D-Tyr solution is significantly lower than that of L -Tyr solution in the presence of ZnFe2O4@SiO2- NALC with the same concentration. The experiment result indicates that ZnFe2 O4@SiO2-NALC chiral nanoparti-cles can be used as a probe to detect chiral Tyr enantio-mer[32]. As shown in Fig. 10c and Table 3, a dramatic experimental phenomenon in the absorbance ratio (A274/ A220) of ZnFe2O4@SiO 2 -NALC was observed. Obviously, there is a difference in the absorbance ratio (A274/A220) between the two enantiomers in each case, and the ab-sorbance ratio of D-Tyr (A274/A220) is always lower than that of L-Tyr at the same amino acid concentration[10, 35]. These experimental results show that chiral ZnFe 2O4 @SiO2-NALC nanoparticles can identify tyrosine by ultraviolet-visible spectroscopy in solution. There was a good linear relationship between the maximum absor-bance at 220 nm in the UV-Vis spectrum and the concentration of tyrosine enantiomer (0.010~0.250 mmol· L-1), and the lowest detection limit of tyrosine is 10 μmol·L-1.
 下载:
导出CSV
下载:
导出CSV
| cTyr / (mmol·L-1) |
Absorbance of ZnFe2O4@SiO2-NALC at 220 nm | |
| L-Tyr | D-Tyr | |
| 0.010 | 0.379 | 0.606 |
| 0.025 | 0.540 | 0.727 |
| 0.050 | 0.663 | 0.926 |
| 0.075 | 0.822 | 1.064 |
| 0.100 | 1.136 | 1.317 |
| 0.125 | 1.255 | 1.507 |
| 0.150 | 1.479 | 1.703 |
| 0.175 | 1.644 | 1.873 |
| 0.200 | 1.814 | 1.973 |
下载:
导出CSV
| cTyr / (mmol·L-1) |
Absorbance of ZnFe2O4@SiO2-NALC at 274 nm | |
| L-Tyr | D-Tyr | |
| 0.010 | 0.292 | 0.512 |
| 0.025 | 0.333 | 0.526 |
| 0.050 | 0.331 | 0.564 |
| 0.075 | 0.326 | 0.580 |
| 0.100 | 0.483 | 0.637 |
| 0.125 | 0.445 | 0.688 |
| 0.150 | 0.557 | 0.720 |
| 0.175 | 0.549 | 0.710 |
| 0.200 | 0.617 | 0.739 |
下载:
导出CSV
| cTyr / (mmol·L-1) |
A274/A220 of ZnFe2O4@SiO2-NALC | |
| L-Tyr | D-Tyr | |
| 0.010 | 1.028 | 0.754 |
| 0.025 | 1.224 | 1.069 |
| 0.050 | 1.152 | 1.015 |
| 0.075 | 1.258 | 1.106 |
| 0.100 | 1.103 | 1.157 |
| 0.125 | 1.145 | 1.136 |
| 0.150 | 1.188 | 1.375 |
| 0.175 | 1.260 | 1.191 |
| 0.200 | 1.419 | 1.305 |
The pH value of the solution is a critical parame-ter of chiral recognition. Here, using Britton- Robinson (B-R) buffer and phosphate buffer to adjust the pH value of the solution, we explored the ability of ZnFe2O4@SiO2-NALC nanoparticles to recognize tyrosine in a pH range of 2.36~9.18. The experimental results are shown in Fig. S2~S4 and Table S1~S15. The results showed that when the solution was acidic or alkaline, the absorbance of D-Tyr system might be higher, lower or the same as that of L-Tyr with the increase of tyro-sine concentration. The above results show that ZnFe2O4@SiO2- NALC nanoparticles can only recognize Tyr enantiomer in neutral environment.
As the second proof that nanomaterials recognize tyrosine, the fluorescence properties of different con-centrations of tyrosine were investigated as shown in Fig.S5. It is obvious that L-Tyr exhibited similar fluo-rescence absorbance to D-Tyr when no substance was added and a peak emerged at 304 nm (λex=229 nm) in the fluorescence emission spectra.
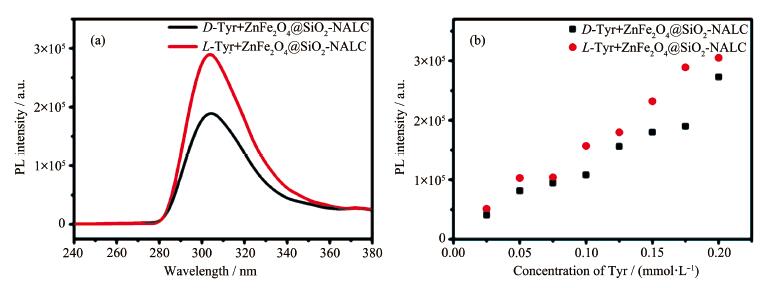
As shown in Fig. 11, when the concentration of Tyr was 0.175 mmol·L-1, the fluorescence intensity of Zn-Fe2O4@SiO2-NALC system with L-Tyr was significantly higher than that of ZnFe2O4@SiO2-NALC system with D-Tyr. In order to investigate whether the results are universal, we also explored the influence of different Tyr concentrations on the fluorescence intensity as shown in Fig. 11b and Table 4. The results show that as the concentration of tyrosine increased, the intensity of the fluorescence peak at 304 nm also increased corre-spondingly. In addition, under the same tyrosine con-centration, the fluorescence intensity of the ZnFe2O4 @SiO2-NALC system with L-Tyr is always higher than that of the ZnFe2O4 @SiO2- NALC system with D-Tyr. These experimental results show that chiral ZnFe2O4 @SiO2- NALC nanoparticles can identify tyrosine enan-tiomers by fluorescence spectroscopy in solution. There was a linear relationship between the maximum emis-sion intensity at 304 nm in the fluorescence spectrum and the concentration of tyrosine enantiomer (0.025~ 0.200 mmol·L-1), and the lowest detection limit of tyro-sine was 25 μmol·L-1.
 下载:
导出CSV
下载:
导出CSV
| cTyr / (mmol·L-1) |
Fluorescence intensity of ZnFe2O4@SiO2-NALC | |
| L-Tyr | D-Tyr | |
| 0.025 | 40 600 | 51 100 |
| 0.050 | 81 400 | 103 000 |
| 0.075 | 94 400 | 104 000 |
| 0.100 | 108 000 | 157 000 |
| 0.125 | 156 000 | 180 000 |
| 0.150 | 156 001 | 232 000 |
| 0.175 | 156 002 | 289 000 |
| 0.200 | 156 003 | 305 000 |
As shown in Fig. S6~S7 and Table S16~S19, the influence of pH value on the identification properties is discussed (using B-R buffer to adjust the pH value of the solution, the pH range was 2.22~9.18). The experi-mental phenomena show that under acidic or alkaline conditions, the fluorescence intensity showed that the maximum fluorescence intensity of D-Tyr was not always weaker than L-Tyr. The results indicate that ZnFe2O4@SiO2-NALC chiral nanomaterial is impossi-ble to identify Tyr under acidic and alkaline conditions by fluorescence spectroscopy, only materials in a neu-tral environment can recognize Tyr enantiomers.
To explore and clarify the mechanism of chiral recognition is the key issue. Under the suitable experi-mental conditions, the selectivity between chiral sub-stances is due to the preferential interaction between the chiral modifier and one of the enantiomers. In this experiment NALC and Tyr readily combine to con-struct diastereomers, with stability determined by the chirality of identified amino acids (i. e., chirality of Tyr). And the same type of enantiomer to combine has a more stable structure because the stability of com-plexes depends on the steric hindrance and trans effect of the ligand[36-38]. Therefore, the ZnFe2O4@SiO2-NALC material has a stronger binding affinity with the L-Tyr than with the D-Tyr, thus achieving the purpose of chiral recognition.
In this study, we assemble a novel chiral nanoma-terial ZnFe2O4@SiO2-NALC for enantioselective recog-nition of Tyr enantiomers. The assay described in this work is easily readout with using a UV- Vis spectra and fluorescence spectra. In comparison with common chiral recognition methods, the method is more attrac-tive because of its cheapness and ready availability. This is the first application of the ZnFe2O4@SiO2-NALC for chiral recognition, opening up a new method for designing more effective enantioselective strategies. Furthermore, this work provides a cheap and conve-nient method for identifying other chiral enantiomers or compounds.
Supporting information is available at http://www.wjhxxb.cn
Zhang L, Xu C L, Liu C W, et al. Anal. Chim. Acta, 2014, 809:123-127 doi: 10.1016/j.aca.2013.11.043
Ghosh S, Fang T H, Uddin M S, et al. Colloids Surf. B, 2013, 105:267-277 doi: 10.1016/j.colsurfb.2012.12.037
Su H Y, Zheng Q L, Li H B. J. Mater. Chem., 2012, 22:6546-6548 doi: 10.1039/c2jm16746h
Sun Y, Zhang L, Li H B. New J. Chem., 2012, 36:1442-1444 doi: 10.1039/c2nj40098g
Jafari M, Tashkhourian J, Absalan G. Talanta, 2018, 178:870-878 doi: 10.1016/j.talanta.2017.10.005
Lomeli-Rosales D A, Rangel S, Zamudio-Ojeda A, et al. ACS Omega, 2016, 1:876-885 doi: 10.1021/acsomega.6b00141
Song G X, Xu C L, Li B X. Sens. Actuators B, 2015, 215:504-509 doi: 10.1016/j.snb.2015.03.109
Song G X, Zhou F L, Xu C L, et al. Analyst, 2016, 141:1257-1265 doi: 10.1039/C5AN02434J
Wang Y, Zhou X, Xu C, et al. Sci. Rep., 2018, 8:5296-5304 doi: 10.1038/s41598-018-23674-y
Zhang L, Xu C L, Song G X, et al. RSC Adv., 2015, 5:27003-27008 doi: 10.1039/C5RA01271F
Zor E. Talanta[J]. , 2018, 184: 149-155.
Carrillocarrión C, Cárdenas S, Simonet B M, et al. Anal. Chem., 2009, 81:4730 doi: 10.1021/ac900034h
Copur F, Bekar N, Zor E, et al. Sens. Actuators B, 2019, 279:305-312 doi: 10.1016/j.snb.2018.10.026
Delgado-Perez T, Bouchet L M, de la Guardia M, et al. Chem. Eur. J., 2013, 19:11068-11076 doi: 10.1002/chem.201300875
Guo Y, Zeng X P, Yuan H Y, et al. Spectrochim. Acta Part A, 2017, 183:23-29 doi: 10.1016/j.saa.2017.04.014
Yang J D, Tan X P, Zhang X N, et al. Spectrochim. Acta Part A, 2015, 151:591-597 doi: 10.1016/j.saa.2015.07.012
Deng X J, Li W B, Ding G S, et al. Sep. Purif. Rev., 2017, 48:14-29
Yoo P S, Reddy D A, Jia Y, et al. J. Colloid Interface Sci., 2017, 486:136-143 doi: 10.1016/j.jcis.2016.09.066
赵大雷, 杨群, 李广.安徽大学学报:自然科学版, 2017, 41:78-84
Chen S K, Sun Y, Li X, et al. J. Solid State Chem., 2019, 280:120994-121003 doi: 10.1016/j.jssc.2019.120994
于敏娜, 魏长平, 刘颖.化工进展, 2010, 29:278-281
Ren C R, Ding X G, Fu H Q, et al. RSC Adv., 2017, 7:6911-6921 doi: 10.1039/C6RA27728D
Atia A A, Donia A M, Al-Amrani W A. Chem. Eng. J., 2009, 150:55-62 doi: 10.1016/j.cej.2008.12.004
Chang Q, Zhu L H, Yu C, et al. J. Lumin., 2008, 128:1890-1895 doi: 10.1016/j.jlumin.2008.05.014
Lan S, Wu X M, Li L L, et al. Colloids Surf. A, 2013, 425:42-50 doi: 10.1016/j.colsurfa.2013.02.059
Wang Q, Gao W, Liu Y, et al. Chem. Eng. J., 2014, 250:55-65 doi: 10.1016/j.cej.2014.03.106
Zhao W, Liang C, Wang B B, et al. ACS Appl. Mater. Inter-faces, 2017, 9:41927-41936 doi: 10.1021/acsami.7b14799
Gao F, Ma S Y, Xiao X C, et al. Talanta, 2017, 163:102-110 doi: 10.1016/j.talanta.2016.10.091
Rabbani M, Heidari-Golafzani M, Rahimi R. Mater. Chem. Phys., 2016, 179:35-41 doi: 10.1016/j.matchemphys.2016.05.005
Bieri M, Gautier C, Burgi T. Phys. Chem. Chem. Phys., 2007, 9:671-685 doi: 10.1039/B609930K
Gautier C, Burgi T. Chem. Commun., 2005, 43:5393-5395
Tashkhourian J, Afsharinejad M. Anal. Methods, 2016, 8:2251-2258 doi: 10.1039/C5AY03021H
Li S X, Liang W J, Zheng F Y, et al. Sens. Actuators B, 2016, 224:48-54 doi: 10.1016/j.snb.2015.10.016
Rhim J W, Hong S I, Park H M, et al. J. Agric. Food Chem., 2006, 54(16):5814-5822 doi: 10.1021/jf060658h
Contino A, Maccarrone G, Zimbone M, et al. J. Colloid Inter-face Sci., 2015, 443:30-35 doi: 10.1016/j.jcis.2014.11.067
Chen Z, Yamada K, Niitsuma M, et al. Anal. Chim. Acta, 2000, 403(1):173-178
Sabolović J, Tautermann C S, Loerting T, et al. Inorg. Chem., 2003, 42:2268-2279 doi: 10.1021/ic025967d
Hyeokseo S, Sudeok K, Suhan M. Anal. Methods, 2013, 6(1):73-76

Figure 1 FT-IR spectra of (a) ZnFe2O4, (b) ZnFe2O4@SiO2, (c) ZnFe2O4@SiO2-NALC and (d) NALC

Figure 4 Magnetization curves for ZnFe2O4, ZnFe2O4@SiO2 and ZnFe2O4@SiO2-NALC measured at 300 K

Figure 9 UV-Vis absorption spectra of ZnFe2O4@SiO2-NALC in the presence of (a) D-Tyr or (b) L-Tyr with different concentrations

Figure 10 (a) Relationship between absorbance and Tyr concentration at 220 nm; (b) Relationship between absorbance and Tyr concentration at 274 nm; (c) Plot of absorbance ratio A274/A220 and D- or L-Tyr concentration over a range of 0.01~ 0.25 mmol·L-1

Figure 11 (a) Fluorescence emission spectra (λex=229 nm) of ZnFe2O4@SiO2 -NALC in the presence of L-Tyr and D -Tyr (0.175 mmol·L-1); (b) Effect of Tyr concentration on fluorescence intensity of ZnFe2O4@SiO2-NALC-Tyr system at λem=304 nm
Table 1. Absorbance at 220 nm of ZnFe2O4@SiO2- NALC in the presence of D-Tyr or L-Tyr with different concentrations
| cTyr / (mmol·L-1) |
Absorbance of ZnFe2O4@SiO2-NALC at 220 nm | |
| L-Tyr | D-Tyr | |
| 0.010 | 0.379 | 0.606 |
| 0.025 | 0.540 | 0.727 |
| 0.050 | 0.663 | 0.926 |
| 0.075 | 0.822 | 1.064 |
| 0.100 | 1.136 | 1.317 |
| 0.125 | 1.255 | 1.507 |
| 0.150 | 1.479 | 1.703 |
| 0.175 | 1.644 | 1.873 |
| 0.200 | 1.814 | 1.973 |
 下载: 导出CSV
Table 2. Absorbance at 274 nm of ZnFe2O4@SiO2- NALC in the presence of D-Tyr or L-Tyr with different concentrations
| cTyr / (mmol·L-1) |
Absorbance of ZnFe2O4@SiO2-NALC at 274 nm | |
| L-Tyr | D-Tyr | |
| 0.010 | 0.292 | 0.512 |
| 0.025 | 0.333 | 0.526 |
| 0.050 | 0.331 | 0.564 |
| 0.075 | 0.326 | 0.580 |
| 0.100 | 0.483 | 0.637 |
| 0.125 | 0.445 | 0.688 |
| 0.150 | 0.557 | 0.720 |
| 0.175 | 0.549 | 0.710 |
| 0.200 | 0.617 | 0.739 |
下载: 导出CSV
Table 3. Absorbance ratio A274/A220 of ZnFe2O4@SiO2 ⁃NALC in the presence of D⁃Tyr or L⁃Tyr with different concentrations
| cTyr / (mmol·L-1) |
A274/A220 of ZnFe2O4@SiO2-NALC | |
| L-Tyr | D-Tyr | |
| 0.010 | 1.028 | 0.754 |
| 0.025 | 1.224 | 1.069 |
| 0.050 | 1.152 | 1.015 |
| 0.075 | 1.258 | 1.106 |
| 0.100 | 1.103 | 1.157 |
| 0.125 | 1.145 | 1.136 |
| 0.150 | 1.188 | 1.375 |
| 0.175 | 1.260 | 1.191 |
| 0.200 | 1.419 | 1.305 |
下载: 导出CSV
Table 4. Fluorescence intensity (λem=304 nm) of ZnFe2O4@SiO2-NALC in the presence of D-Tyr or L-Tyr with different concentrations
| cTyr / (mmol·L-1) |
Fluorescence intensity of ZnFe2O4@SiO2-NALC | |
| L-Tyr | D-Tyr | |
| 0.025 | 40 600 | 51 100 |
| 0.050 | 81 400 | 103 000 |
| 0.075 | 94 400 | 104 000 |
| 0.100 | 108 000 | 157 000 |
| 0.125 | 156 000 | 180 000 |
| 0.150 | 156 001 | 232 000 |
| 0.175 | 156 002 | 289 000 |
| 0.200 | 156 003 | 305 000 |
下载: 导出CSV

 扫一扫看文章

扫一扫关注我们