Figure 1.
XRD patterns of CeZr

CeO2-ZrO2 is a key material used in automotive three-way catalysts (TWCs) on account of its outstand-ing oxygen storage capacity. Thermal stability of CeO2-ZrO2 at temperature up to 1 000 ℃ is an essential requirement taking into account its actual working con-ditions[1]. With the improvement of emission standards, there is an increasing demand for the thermal stability of CeO2-ZrO2 solid solutions at high temperature. This pushes researchers to develop new synthesis route. Several ways such as co-precipitation[2], microemulsion, hydrothermal and sol-gel method[3] have been applied to prepare these materials. Among these methods, co-precipitation is commonly used because of its inex-pensive and flexible. In co-precipitation method, struc-ture and property of the final product can be changed either by altering preparation conditions or introducing co-precipitation agents such as surfactants[4-6]. As sur-factants can significantly enhance the surface area of CeO2-ZrO2, it has received widespread attention. But when the material is heat-treated to a high enough tem-perature (especially exceed 800 ℃), the mesoporous structure collapse and then cause significant decrease of specific surface and reducibility. To prevent sinter-ing at high calcination temperature, Li's[7] group report-ed a soft and hard process in the preparation of high thermal stability metal oxide (TiO2, Nb2O). In this meth-od, amphiphilic di-block copolymer and metal salt solu-tions were first mixed to form sol. Then the sol was evaporated and subsequently calcinated in N2. In this process, it decomposed into mixture of carbon and met-al oxides in the inert gas. Serious sintering of metal oxide could be avoided due to encapsulating or isolat-ing of carbon formed in calcination. The high specific surface area of nano-sized particles may be generated by subsequent low temperature air calcination to remove carbon species[7]. By using this method, CeO2-ZrO2 mixed oxides such as Ce0.8Zr0.2O[8], Ce0.5Zr0.5O2[9] also synthesized by other researchers. But these researches focused on their texture property such as BET (Brunaner-Emmett-Teller) surface area. The redox property and catalytic performance which are neces-sary and vital for automobile exhaust purification cata-lysts were almost not studied. Our previous studies[10] have disclosed that Ce0.65Zr 0.35O2 prepared by soft-hard template method behaved excellent catalytic perfor-mance. In this study, we focus on the impact of calcina-tion temperature on structure, texture, oxygen storage capacity (OSC), redox properties of Ce0.65Zr0.35O2. The performance of corresponding Pd-only catalysts was also intensively studied.
Ce0.65Zr0.35O2 was prepared according to the refer-ence[10]. Ce(NO3)3·6H 2O was dissolved in deionized water, then Zr(NO)3 was added into Ce(NO3)3 solution to form mixed solution. Copolymer solution (polyvinyl alcohol and polyethylene glycol) was added in the mixed solution. After being stirred for 1 h, ammonium carbonate solution was added in the mixed solution to form precipitate. The pH value of precipitation process was controlled at 9.0. The obtained precipitate was aged, filtered, washed, and then dried. The dried pre-cipitate was calcined in atmosphere of N2 at 500, 600, 700, 800, 1 000 ℃ for 6 h, respectively. In the process of calcination, the precipitate was decomposed and formed mixture of Ce-Zr oxides and carbon. In order to remove the carbon powder and obtain the final product, the carbonated product was calcinated in air at 450 ℃ for 3 h. The resultant sample was labelled as CeZr-Nx(x=5, 6, 7, 8, 10). For instance, CeZr-N5 was the sam-ple calcined in N2 at the temperature of 500 ℃. As a contrast, the sample calcinated direct in air at 1 000 ℃ was also prepared and named CeZr-A10.
Pd(NO3)2 solution was impregnated onto Ce0.65Zr0.35O2 materials to form catalysts. The catalysts were first wet milled to form uniform slurry and then smeared onto ceramic honeycomb to form monolithic catalysts. By drying and roasting (550 ℃ for 3 h), the final catalysts were obtained. The content of PdO was 2%(w/w). The final catalysts were labelled as Pd/ CeZr-Nx, which corresponded to the supports calcined at different temperatures.
D/Max-rA diffraction instrument was used in X-ray diffraction (XRD) experiment. Cu Kα (λ=0.154 18 nm) was used as radiation. The operating current and voltage were 40 kV and 100 mA, respectively, and the scan range was 10°≤2θ ≤80°. N2 adsorption-desorption was tested on automatic instrument Quadrasorb SI. The samples were vacuumed at 300 ℃ to eliminate impuri-ty, and then analyzed at-196 ℃ in liquid nitrogen. Renishaw in Via Raman Laser spectrometer was used in Raman spectrum analysis. The wavelength of the excitation was 785 nm and the resolution was 1.5 cm-1. The data collection was carried out at indoor tempera-ture. The scanning scale was 100~2 000 cm-1. X-ray photoelectron spectroscopy (XPS) was operated on an electron spectrometer XSAM-800. Al Kα served as source of X-ray. C1s (284.8 eV) was used to check the electron binding energy. OSC was tested within a fixed bed reactor. Samples were first heated for 1 h in H2at 550 ℃ and then cooled to 200 ℃ in N2. O2 was pulse injected into the sample during the test. The signal was detected by thermal conductivity detector (TCD). H2-temperature-programmed reduction (H2-TPR) was operated in micro-reactor. The samples were first purged with N2 at 450 ℃. Then, they were cooled to am-bient temperature. In the process of test, the samples were heated to 900 ℃ at the rate of 10 ℃·min-1 in mix-ture gas of H2/N2 (5:95, V/V).
A packed bed was used as reactor to test catalytic performance. The measured waste gas was composed of 0.86% CO, 0.06% C3H8, 0.12% NO, 12% CO2 and 10% H2O (volume fraction). O2 was adjustable. N2 was balance gas. The space velocity in reaction was 40 000 h-1. Automotive exhaust analyzer (FGA-4100) was used to detect pollutant concentration.
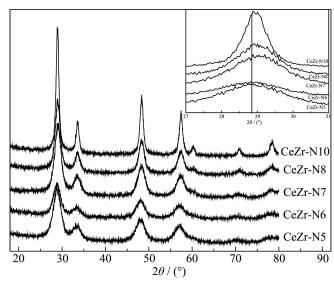
Fig. 1 shows the XRD patterns of CeZr samples. In Fig. 1, the major peaks of all samples are characteristic of cubic fluorite structure. The diffraction peak of iso-lated ZrO2 couldn't be observed, indicating that CeO2-ZrO2 solid solutions are formed. The samples calcined at 500, 600 and 700 ℃ have large and diffuse diffraction peaks, indicating their low crystallinity. With the further raising of temperature, more intensive diffraction peaks could be observed. The result reveals an increase in crystallinity, which is ascribed to agglomeration and sintering of CeO2-ZrO2 crystallites. Meanwhile, the BET surface area of samples decreased (Table 1). The grain size increased to 9.7 nm and BET surface area decreased to 61 m2·g-1 after calcination temperature increased to 1 000 ℃. But the growth of grains and decrease of BET surface area were signifi-cantly less than CeZr-A10. The results declare that the coexistence of amorphous carbon powder can prevent the particles from growing up very well at low tempera-ture. But when the temperature rises, the role is weak-ened. It is clarified by the fact that the thermodynamic force is small at low calcination temperature and can-not provoke the growth of Ce-Zr grains. Thus, inhibito-ry action of carbon powder preponderates. In this case, the resulting Ce-Zr oxides have low crystallinity[9]. When the thermodynamic force becomes powerful and dominant at high calcination temperature, it suppresses the effect of coexisting carbon powder and then Ce-Zr grains grow up.
 下载:
导出CSV
下载:
导出CSV
| Sample | Cell parameter/nm | Crystal size/nm | Surface area/(m2·g-1) | Rmean / nm | V/(mL·g-1) |
| CeZr-N5 | 0.531 5 | 5.2 | 168 | 3.0 | 0.29 |
| CeZr-N6 | 0.529 9 | 5.2 | 144 | 3.5 | 0.27 |
| CeZr-N7 | 0.528 4 | 5.5 | 123 | 4.2 | 0.26 |
| CeZr-N8 | 0.528 2 | 6.6 | 89 | 5.9 | 0.26 |
| CeZr-N10 | 0.527 1 | 9.7 | 61 | 5.8 | 0.18 |
| CeZr-A10 | 0.530 3 | 10.8 | 16 | 15.2 | 0.1 |
In order to investigate the shift of the peaks, the diffraction of (111) crystal plane was amplified and list-ed in the inset of Fig. 1. As can be seen when the cal-cining temperature rose from 500 to 1 000 ℃, the peaks moved to higher diffraction angle and cell param-eters dropped from 0.531 5 to 0.527 1 nm owing to the shrinkage of the lattice, which arose from insertion of Zr4+ into CeO 2 lattice. The ionic radius of Ce4+ is 0.097 nm, which is bigger than Zr4+ (0.084 nm) [11-12]. So, the substitution of Zr4+ for Ce4+ leads to the shrinkage of crystal cell. Much larger shift in peak position is attrib-uted to more insertion of Zr4+ ions into the ceria lat-tice[4]. It is worthwhile to point out that no distinguish-able separated phases or asymmetric peaks could be observed, even the calcination temperature high up to 1 000 ℃, which is probably attributed to overlap of the diffraction profiles. As it can be verified by the follow-ing discussion of Raman result, the samples calcinated at 800 and 1 000 ℃ had two apparent distinct peaks. However, traditional diffraction analysis cannot differ-entiate Ce-rich phase from Zr-rich phase when they are coexistence, since their crystalline structure is almost the same[13-14].
As shown in Table 1, it is obviously that raising the calcination temperature leads to decline of the surface area. The decrease of surface area ranks in the order of CeZr-N5 > CeZr-N6 > CeZr-N7 > CeZr-N8 > CeZr-N10. The result demonstrates that in the inert atmo-sphere, collapse of pore structure still can't be avoided at high temperature. The reason is that with the raising of calcination temperature, thermal shrinkage of amorphous carbon gradually becomes aggravated, and its supporting role to pore canal is weakened. And then, collapse of pore structure occurred, which led to decrease of BET surface area. The BET surface area of CeZr-N10 was 61 m2·g-1, which was more than three times of CeZr-A10. The result indicates that the thermal stability of the sample can be remarkably improved as it is prepared by soft-hard method. The reason is that the destruction of pore structure can be alleviated in a certain degree due to the formation of amorphous carbon in inert atmosphere which can support the pore wall of samples. In order to investigate ultimate ther-mal stability of CeZr-N10, it was calcined at 1 000 ℃ for another 6 h. After calcined, the BET surface area declined to 28 m2·g-1, pore diameter increased to 7.2 nm and pore volume decreased to 0.1 mL·g-1. The results demonstrate sintering of the sample at high cal-cination temperature in the absence of amorphous carbon. Though the BET surface area of aged CeZr-N10 declined, it was still higher than CeZr-A10 (16 m2·g-1), indicating higher thermostability of CeZr-N10. To our knowledge, the BET surface area of aged CeZr-N10 was relatively large compared to other CeO2-ZrO2 mate-rials with high content of Ce. That is to say, soft-hard method can improve anti-sintering ability of CeO2-ZrO2 materials.
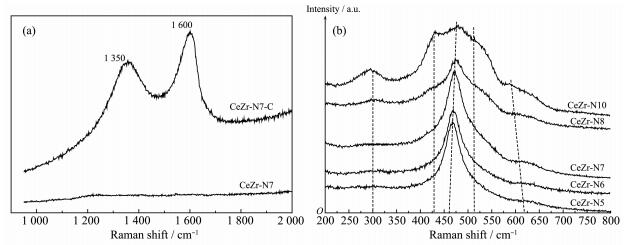
Raman spectrum was used to explore existence of carbon and structure of the final materials. A typical spectrum of intermediate products roasting in N2 at 700 ℃ (CeZr-N7-C) is shown in Fig. 2a. As shown in Fig. 2a, CeZr-N7-C displayed two bands around 1 600 and 1 350 cm-1, which are attributed to graphite carbon and disordered carbon, respectively[7]. After calcinated in air at 450 ℃, the two bands mentioned above disap-peared (Fig. 2a, CeZr-N7), indicating the complete removal of carbon. The final samples (Fig. 2b) displayed two bands at 462~478 cm-1 and 620 cm-1, respectively. The band located at 462~478 cm-1 was strong. It is attributed to symmetric vibration of Ce-O bond (F2g) in cubic fluorite CeO2[15]. No band attributed to ZrO2 can be observed. The result declares that cerium zirconium solid solution is formed, which agrees with XRD result. With the rise of calcination temperature, the peak at 462 cm-1 moved to high band, which demonstrates that more Zr4+ insert into ceria lattices at high temperature. As it has been reported that the increase of Zr content in the ceria-zirconia solution can make the vibration of Ce-O bond band shift to higher wave number[16]. The band at 620 cm-1 belongs to intrinsic oxygen vacancies in the lattice, which arise from the addition of Zr into the CeO2[4]. When calcination temperature rose from 500 to 1 000 ℃, the intensity of peak at 620 cm-1 increased and shifted to low wavenumber, demonstrat-ing increase of oxygen vacancies. Besides the two bands mentioned above, another two bands at 430 and 515 cm-1 could be observed for CeZr-N8 and CeZr-N10, indicating segregation of Zr-rich phase of sample because of calcination at high temperature in inert atmosphere. Nevertheless, owing to its poor diffraction ability of oxygen atoms, XRD cannot distin-guish such phase separation from cubic structure. Previous studies have been proposed that phase separa-tion of CeO2 -ZrO2 oxide may be promoted by surface energy[17-18]. If the grain size is below the critical value, the solid solution is stable. If it exceeds a crucial point, the proportion of surface energy to the total energy of the system is so small that it cannot maintain the stabil-ity of crystal, which results in phase separation, and then much stabler Ce-rich and Zr-rich phases are formed. Combined with the XRD result, we deduce that phase segregation of the sample at high temperature may be attributed to increase of crystal size because of sintering. Note also that with elevating of calcination temperature, the peaks at 302 and 620 cm-1 became strong, which implies that high calcination temperature at inert atmosphere can create more oxygen vacancies. Two reasons may be account for this. One is that more Ce4+ ions are reduced to Ce3+ by amorphous carbon at high calcination temperature, which will be confirmed by XPS result. The other possibility is that the segrega-tion of Ce-Zr may induce the formation of Ce-rich and Zr-rich oxides, which is responsible for the increase of structure defect[19].
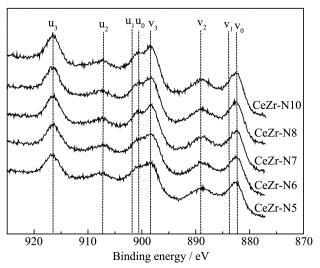
The surface composition and the cerium oxidation state are shown in Table 2 and Fig. 3. Eight peaks could be observed in the Ce3d spectra of CeZr (Fig. 3). The peaks marked as"v"are characteristic peaks of Ce3d5/2, while peaks marked as"u"are characteristic peaks of Ce3d3/2. The bands labeled as (v0, u0), (v2, u2) and (v3, u3) are characteristic of Ce4+. Those labeled as (v1, u1) are related to Ce3+ [20]. It can be seen form Fig. 3, the bands labeled as v1 and u1 couldn't be distin-guished clearly, which indicates that cerium in all the oxides exists mainly in Ce4+. Table 2 summarizes the result of the surface elemental distribution. It is found that the molar ratio of the Ce to Zr (nCe/nZr) in all CeZr samples descended with the rise of calcination temper-ature. The nCe/nZr in CeZr-N5 and CeZr-N6 was 2.02 and 1.92, respectively, which exceeded theoretic atomic ratio, suggesting that the surfaces of CeZr-N5 and CeZr-N6 are richer in Ce than anticipated. It may be because that Zr4+ can't be easily intercalated into CeO2 lattice at relative low calcination temperature. Zhao's[21] study has shown that the insertion of Zr4+ into CeO2 lattice increased gradually with calcination tempera-ture rising, until homogeneous solid solution formed. As it is proved by XRD result, the cell parameters of CeZr-N5 and CeZr-N6 are bigger than the others. Raman spectrum result also demonstrates that the intensity of peak at 620 cm-1 associated with oxygen vacancies increased with the rise of calcination temper-ature. The XRD and Raman spectrum results further testify that the insertion of Zr4+ into CeO2 is progres-sive. So, Ce-rich phase forms in outer part at relative low temperature. The nCe/nZr in CeZr-N7 was 1.85, which was near to the theoretical value (1.86) and indi-cates that more Zr4+ ions insert into ceria lattices and well element homogeneity of it. However, the nCe/nZr in CeZr-N8 and CeZr-N10 were much lower than the theoretic atomic ratio, indicating that the outer parts of the two samples are Zr-rich. Such finding is consistent with the assumption that crystalline phase of CeZr-N8 and CeZr-N10 is a combination of cubic Ce-rich and tetrag-onal Zr-rich mixed phase, as confirmed in Raman spec-trum result. Previous researches[2, 4] have revealed that high temperature treatment to CeZr makes Zr4+ move from bulk to surface, and at last samples rich in tetrago-nal Zr phase form at outer space. Our work conforms with the literatures.
下载:
导出CSV
| Sample | Surface composition / %a | nCe/nZr | fu3 / %b | xPd2 +c | |||
| Ce3d | Zr3d | O1s | Pd3d | ||||
| CeZr-N5 | 17.06 | 8.68 | 74.26 | — | 2.02 | 16.64 | — |
| CeZr-N6 | 16.67 | 8.65 | 74.68 | — | 1.92 | 16.40 | — |
| CeZr-N7 | 17.49 | 9.45 | 73.06 | — | 1.85 | 16.39 | — |
| CeZr-N8 | 16.92 | 9.72 | 73.36 | — | 1.74 | 16.04 | — |
| CeZr-N10 | 16.07 | 9.88 | 74.05 | — | 1.63 | 15.49 | — |
| Pd/CeZr-N5 | 16.50 | 8.37 | 73.93 | 1.20 | 1.97 | 17.25 | 100% |
| Pd/CeZr-N6 | 16.80 | 8.89 | 73.04 | 1.27 | 1.89 | 17.04 | 100% |
| Pd/CeZr-N7 | 17.25 | 9.36 | 72.10 | 1.29 | 1.84 | 16.88 | 100% |
| Pd/CeZr-N8 | 16.40 | 9.51 | 72.94 | 1.15 | 1.72 | 16.39 | 100% |
| Pd/CeZr-N10 | 15.96 | 9.96 | 73.02 | 1.06 | 1.62 | 16.13 | 100% |
| a Molar fraction; b Aarea fraction of u3 peak to all the characteristic peaks of Ce3d; c Molar fraction, xPd2+=nPd2+/nPd×100%. | |||||||
The relative molar ratio of Ce3+ in the surface region can be assessed indirectly by the fraction of u3 peak (fu3). The higher the fu3 is, the lower molar ratio of the Ce3+ is. The results are also presented in Table 2. Ce3+ content in CeZr samples is found to increase with the calcination temperature. For CeZr-N5, CeZr-N6 and CeZr-N7, the increase of Ce3+ with the rise of calcination temperature is attributed to improvement of homogeneity of solid solution. As it was reported in literature[22-23], homogenous CeO2-ZrO2 solid solution is in favor of formation of Ce3+ or development of oxygen vacancies. Although phase segregation occurs in CeZr-N8 and CeZr-N10, their Ce3+ ratio is even higher than CeZr-N7. The high Ce3+ ratios of CeZr-N8 and CeZr-N10 are probably attributed to following two reasons: (i)the formation of CeO2-ZrO2 nanocrystalline oxides with Ce-rich and Zr-rich domains induces the increase of structure defect as proved by Raman spectra; (ii). more Ce4+ is reduced to Ce3+ by amorphous carbon at high calcination temperature. High ratio of Ce3+ is favorable to redox property of CeZr, which will be proved by OSC and H2-TPR results next.
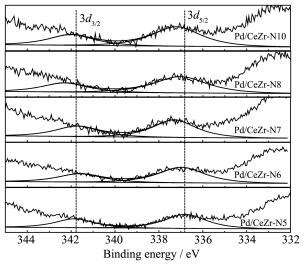
It can be seen from Table 2, after Pd is loaded on the CeZr, the ratio of Ce/Zr and Ce3+ decreased slightly. This is attributed to adsorption of Pd species on surface defect sites of CeZr[24-25]. The variation of nCe/nZr and Ce3+ ratio in Pd/CeZr are in accordance with their corresponding supports. The content of Pd on surface increased in the order of Pd/CeZr-N10 < Pd/CeZr-N8 < Pd/CeZr-N5 < Pd/CeZr-N6 < Pd/CeZr-N7. It has been disclosed that the dispersion of Pd species is related to surface area of support and interaction of Pd/CeZr, and large surface area and strong interaction between Pd and CeO2-ZrO2 are in favor of dispersion of Pd[26]. For Pd/CeZr-N7, Pd/CeZr-N8 and Pd/CeZr-N10, the dis-persion of Pd species is depend on surface area of sup-port. While for Pd/CeZr-N5, Pd/CeZr-N6 and Pd/CeZr-N7, the dispersion of Pd species may be related to interaction between Pd and CeZr support. As shown in Fig. 4, Pd3d spectra can be fitted into two peaks. The peaks located in a range of 336.9~337.3 eV belong to Pd3d5/2, while those located at 341.6~342.3 eV belong to Pd3d3/2. These peaks are all attributed to Pd2+. The result indicates that Pd species in all the catalysts exist mainly in the form of Pd2+. The binding energy of Pd3d5/2 increases in the sequence of Pd/CeZr-N5 < Pd/ CeZr-N6 < Pd/CeZr-N7. As it has been reported that the increase of binding energy of Pd3d5/2 is ascribed tocstrong interaction between Pd species and support[27]. So, the stronger interaction between Pd and CeZr-N7 imparts Pd/CeZr-N7 higher dispersion of Pd species than those of Pd/CeZr-N6 and Pd/CeZr-N5.
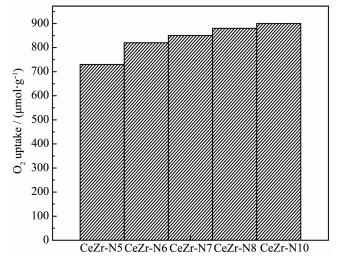
OSC is an important indicator of TWC. It can adjust the balance between reductants and oxidants during purifying automobile exhaust and speed the transfer of oxygen atoms, which is benefit to oxidation reaction at low temperature[28]. The OSC result of CeZr is presented in Fig. 5. It can be found from Fig. 5 that with elevation of calcination temperature from 500 to 1 000 ℃, the OSC value rose from 730 to 900 μmol· g-1. For CeZr-N5, CeZr-N6 and CeZr-N7, the increase of OSC is due to the improvement of homogeneity of CeO2-ZrO2 solid solution. As it was reported, improving the structural homogeneity of CeO2-ZrO2 tends to facili-tate its OSC and redox capabilities[2]. Although phase separation occurred in CeZr-N8 and CeZr-N10, they had higher OSC value than the others. Two factors may be responsible for this. One is that phase reorganiza-tion of Ce and Zr atoms results in lattice distortion at the interfacial atomic layers, which creates more labile oxygen atoms[5]. The other reason is that inhomoge-neous phase composition of the sample promotes the formation of interfacial boundaries, which leads to superior oxygen storage capacity[29]. Previous research has shown that the number of oxygen vacancies which is directly in proportion to the concentration of Ce3+ is a crucial aspect for OSC of CeO2-based oxygen storage materials[30]. In our study, the order of OSC value is per-fectly consistent with the content of Ce3+.
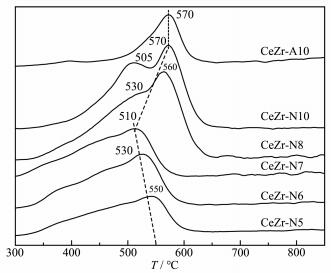
TPR results of CeZr and their corresponding cata-lysts are shown in Fig. 6 and 7, respectively. Generally, the reduction of CeO2 -ZrO2 can be divided into two regions at about 500 and 800 ℃. The reduction peak at 500 ℃ is assigned to the behavior of surface oxygen, while the peak at 800 ℃ is ascribe to the behavior of bulk oxygen[31]. However, in the current work, CeZr-N5, CeZr-N6 and CeZr-N7 all showed a broad reduction peak following an asymmetric form in a range of 510~ 550 ℃, suggesting that the reduction peaks of surface and bulk Ce4+ species are overlapped. CeZr-N8 showed a main reduction peak located around 560 ℃ with an obvious shoulder peak around 530 ℃ by the reason of phase separation. While for CeZr-N10, two obviously separated peaks located at 505 and 570 ℃ could be observed owing to more serious phase segregation than CeZr-N8. The two peaks derive from various oxygen species with diverse reducibility which coexist in CeZr-N8 and CeZr-N10. It is attributed to mixed phase com-position of CeZr-N8 and CeZr-N10, which is consistent with Raman spectrum and XPS results. The max reduc-tion temperature declines in the sequence of CeZr-N10 > CeZr-N8 > CeZr-N5 > CeZr-N6 > CeZr-N7. The reduc-tion temperature of CeZr-N7 was lowest despite its rela-tively smaller surface area than CeZr-N6 and CeZr-N5. Thus, it can be concluded that improvement the unifor-mity of CeO2-ZrO2 mixed oxides can prominently modi-fy oxygen environment around Ce and Zr. While for CeZr-N10 and CeZr-N8, they are inclined to be reduced at relatively high temperature owing to their relatively low surface area and heterogeneous phase structure. CuO was used as reference material to estimate H2 con-sumption of the samples. The results for CeZr-N5, CeZr-N6, CeZr-N7, CeZr-N8 and CeZr-N10 were 540, 636, 654, 680 and 880 μmol·g-1, respectively. It is apparent that the H2 consumption increases when calcination temperature goes up. As it was reported that the deple-tion of H2 is strongly associated with the accessible reactive oxygen present in Ce-Zr mixed oxides[19]. Com-bined with Raman spectrum and XPS results, the increase of H2 consumption is attributed to phase rear-rangement of the sample calcined at high temperature which creates more labile oxygen atoms. The result is also in accordance with Zhang's[19] study. As for CeZr-A10, it showed a relatively low intensity reduction peak at 570 ℃ and its H2 consumption was 310 μmol· g-1. The high reduction temperature and low H2 con-sumption of CeZr-A10 demonstrate its poor reducibili-ty due to serious sintering which results in decrease of oxygen vacancies and labile oxygen atoms.
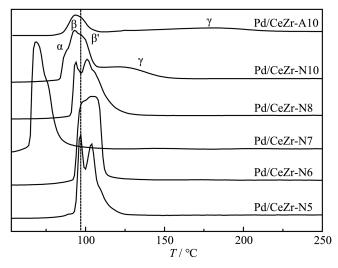
The H2-TPR spectra of Pd/CeZr catalysts are shown in Fig. 7. Unlike the supports, reduction in the catalysts happened at relatively low temperature (below 200 ℃) due to reduction of PdO species. As presented in Fig. 7, calcination temperature of the supports has significant effect on their corresponding Pd only cata-lysts. Pd/CeZr-N5 showed two hydrogen depletion peaks (denoted as α and β, respectively) in low temper-ature zone because of its relatively low homogeneous of phase structure. According to previous literature[32], α peak is derived from the reduction of uniform distribu-tion PdO species, while β peak arises from the reduc- tion of steady PdO species possessing strong mutual effect with supports. Compared with Pd/CeZr-N5, Pd/ CeZr -N6 and Pd/CeZr-N7 exhibited unimodal reduc-tion features due to improvement of homogeneity, but the reduction peaks were somewhat asymmetric. It is notable that Pd/CeZr-N8 and Pd/CeZr-N10 catalysts exhibit a splitting of β peak owing to the phase separa-tion of the supports. In addition, another peak γ was ob-served in Pd/CeZr-N10, which is connected to surface oxygen reduction[33]. The occurrence of γ peak arises from weak mutual effect between the support and PdO, which is in accordance with heterogeneity of Pd/CeZr-N10. As for Pd/CeZr-A10, because of more severe sin-tering, its reduction temperature of γ peak was higher than Pd/CeZr-N10. The maximum peak temperature for all the catalysts increases as the following order: Pd/ CeZr-N7 < Pd/CeZr-N8≈Pd/CeZr-N10≈Pd/CeZr-A10 < Pd/CeZr-N6≈Pd/CeZr-N5. Hydrogen consumption of Pd/CeZr-N5, Pd/CeZr-N6, Pd/CeZr-N7, Pd/CeZr-N8, Pd/CeZr-N10 and Pd/CeZr-A10 was 710, 925, 928, 625, 523 and 460 μmol·g-1, respectively, which is far greater than theoretical hydrogen consumption of Pd owing to the strong mutual effect between Pd and CeO2-ZrO2 support. It is so-called"spillover effect"[34]. It has been disclosed that hydrogen consumption is related to dispersion of Pd and oxidative Pd2+ species, and higher dispersion of Pd and more Pd2+ species are conducive to improving hydrogen consumption[35]. Based on XPS result, hydrogen consumption is in consistent with the Pd content in the surface of the catalysts. It is worth noting that high H2 consumption of the supports may not coincide with high H2 consumption of their corre-sponding catalysts. For example, CeZr-N10 had highest H2 consumption, while Pd/CeZr-N10 possessed lowest H2 consumption among the catalysts prepared by soft-hard template method. H2 consumption of CeZr-N7 was significantly lower than CeZr-N10, but Pd/CeZr-N7 possessed highest H2 consumption, which may be ascribed to high dispersion of Pd on CeZr-N7 and strong interaction between Pd and CeZr-N7 as proved by XPS result. Highly dispersed Pd and strong interac-tion between Pd and the supports are benefit to more available reducible species including PdO species and some Ce4+ species promoted by Pd[36]. So, reducibility of the support and the catalyst is not highly correlated. It was also disclosed in Li's[37] study that H2 consumption of fresh Pd/CZAc was higher than Pd/CZAm, while H2 consumption of their supports was inverse. Pd/CeZr-N7 possessed lowest reduction temperature and highest H2 depletion, indicating the best redox capability of it. It may be attributed to uniform distribution of Pd on CeZr-N7 on account of strong mutual effect between Pd and CeZr-N7. Though the reduction temperature of Pd/ CeZr-N6 was slightly higher than Pd/CeZr-N8 and Pd/ CeZr-N10, its H2 consumption was almost equal to Pd/ CeZr-N7. In this regard, Pd/CeZr-N6 also behaves excellent redox property. Comprehensive consideration reduction temperature and total H2 depletion, the redox performance rises in the sequence of Pd/CeZr-A10 < Pd/ CeZr-N10 < Pd/CeZr -N8 < Pd/CeZr-N5 < Pd/CeZr-N6 < Pd/ CeZr-N7. Among all the catalysts prepared by soft-hard template method, Pd/CeZr-N10 behaves the worst reduction performance because of the sintering of the support at high calcination temperature, but its reduction performance is significantly better than Pd/ CeZr-A10. So, it can be concluded that soft-hard tem-plate method imparts catalyst better thermal stability.
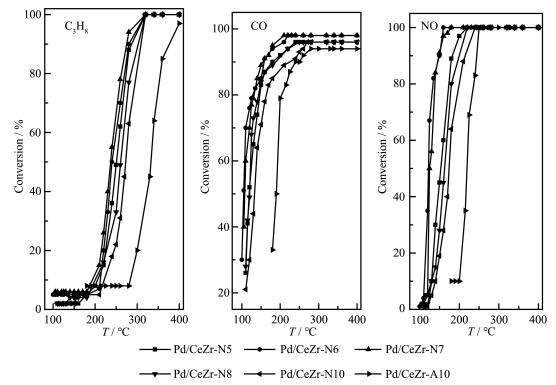
The conversions of C3H6, CO and NO over Pd/ CeZr are showed in Fig. 8. Table 3 also provides T50 (light-off temperature) and T90 (full-conversion tempera-ture) of C3H 8, CO and NO. In comparison, the activity of Pd/CeZr-A10 is also showed in Fig. 8 and Table 3. Based on the data in Fig. 8 and Table 3, T50 and T90 of C3H8, CO, NO on Pd/CeZr-N7 were lowest, demonstrat-ing its excellent catalytic activity. T50 and T90 of C3H8, CO, NO on Pd/CeZr-N6 were slightly higher than on Pd/CeZr-N7, but significantly lower than on other cata-lysts, indicating its lower activity than Pd/CeZr-N7 but higher activity than others. The T50 of CO over Pd/CeZr-N5 and Pd/CeZr-N8 were the same, but conversion of C3H8 and NO over Pd/CeZr-N5 were about 10 ℃ lower than those on Pd/CeZr-N8.The result indicates that Pd/ CeZr-N5 exhibits better activity for conversion of C3H8 and NO than Pd/CeZr-N8. The T50 of C3H6, NO and CO over Pd/CeZr-N8 were 262, 163 and 120 ℃, respectively, which is clearly lower than those of Pd/CeZr-N10, sug-gesting that Pd/CeZr-N8 possesses better catalytic property than Pd/CeZr-N10. The T50 and T90 of C3H6, NO, CO over Pd/CeZr-A10 were significantly higher than Pd/CeZr-N10, which indicates the activity of Pd/ CeZr-A10 is worse than Pd/CeZr-N10. Based on the above analysis, the activity of the catalysts declines in sequence of Pd/CeZr-N7 > Pd/CeZr-N6 > Pd/CeZr-N5 > Pd/CeZr-N8 > Pd/CeZr-N10 > Pd/CeZr-A10. Following two reasons may be account for the result: (i)Pd/CeZr-N7 shows best dispersity of Pd species than other cata-lysts. Highly dispersed Pd can offer more active sites which are benefit to catalytic reaction. As disclosed by XPS result, the content of Pd species follows a decline of Pd/CeZr-N7 > Pd/CeZr-N6 > Pd/CeZr-N5 > Pd/CeZr-N8 > Pd/CeZr-N10, which agrees with the activity of the catalysts(ii). The excellent reducibility of the highly dispersed PdOx species is benefit to the activity of the catalysts. As it has been reported that excellent reduc-tion performance is benefit to oxidation of CO and C3H8[38-39].In addition, outstanding reducibility is also in favor of the reaction between adsorbed oxygen and reductant, hence the improvement of reduction to NO[40]. It can be seen in our study the activity is consistent with the reducibility of the catalysts. Despite extraordinary OSC performance of CeZr-N10, its corresponding catalyst Pd/CeZr-N10 showed the worst three-way activity among the catalysts prepared by the same method. It is possible. As it has been found in Muraki's study that Rh/CeO2-ZrO2 with higher OSC presented lower activity than Rh/CeO2 with lower OSC[41]. Kusatsugu's study[42] also disclosed negative effect of OSC on activity of Fe-doped Pd/CeO2 -ZrO2 when the OSC was too high. Kolli[43] discovered that Pd/ Al2O3-Ce0.75Zr0.25O2-La2O3 with high dynamic OSC showed low CO oxidation efficiency because of smaller surface area than Pd/Ce 0.75Zr0.25O2-Al2O3. So, low activi-ty of Pd/CeZr -N10 may be attributed to the decline of Pd dispersity and reduction capacity induced by its low BET surface area. As proved by XPS and H2-TPR re-sults, Pd/CeZr-N10 possessed lowest surface Pd con-tent and worst redox performance. As for Pd/CeZr-N5, Pd/CeZr-N6 and Pd/CeZr-N7, the activity is in accor-dance with OSC and reduction capacity. The result proves the importance of Pd dispersion and reducibility to catalytic performance once again. T50 and T90 for C3H8, NO and CO of unit specific surface on catalysts are listed in Table 4. It is obviously that the specific ac-tivity is connected to specific area of catalyst. Com-bined with the BET surface area, the specific activity increased with the rising of surface area. As large sur-face area is benefit to dispersity of PdO and provides more approachable active sites, the catalytic activity is improved[44]. Though Pd/CeZr-A10 and Pd/CeZr-N10 were calcined at the same temperature, Pd/CeZr -A10 possessed worse activity than Pd/CeZr-N10 because of severe sintering. The result indicates that the catalysts prepared by soft-hard template method have excellent thermal stability.
下载:
导出CSV
| Catalyst | T50/℃ | T90/℃ | ||||||
| C3H8 | NO | CO | C3H8 | NO | CO | |||
| Pd/CeZr-N5 | 251 | 152 | 120 | 290 | 185 | 180 | ||
| Pd/CeZr-N6 | 240 | 125 | 105 | 285 | 150 | 152 | ||
| Pd/CeZr-N7 | 238 | 120 | 108 | 280 | 150 | 150 | ||
| Pd/CeZr-N8 | 262 | 163 | 120 | 300 | 200 | 185 | ||
| Pd/CeZr-N10 | 274 | 175 | 133 | 310 | 216 | 201 | ||
| Pd/CeZr-A10 | 335 | 220 | 190 | 365 | 245 | 225 | ||
下载:
导出CSV
| Catalyst | T50 / (℃·g·m-2) | T90 / (℃·g·m-2) | |||||
| C3H8 | NO | CO | C3H8 | NO | CO | ||
| Pd/CeZr-N5 | 1.49 | 0.9 | 0.71 | 1.73 | 1.10 | 1.07 | |
| Pd/CeZr-N6 | 1.67 | 0.87 | 0.73 | 1.98 | 1.04 | 1.06 | |
| Pd/CeZr-N7 | 1.93 | 0.98 | 0.88 | 2.28 | 1.22 | 1.22 | |
| Pd/CeZr-N8 | 2.94 | 1.83 | 1.35 | 3.37 | 2.25 | 2.08 | |
| Pd/CeZr-N10 | 4.49 | 2.87 | 2.18 | 5.08 | 3.54 | 3.30 | |
| Pd/CeZr-A10 | 20.94 | 13.75 | 11.88 | 22.81 | 15.31 | 14.00 | |
Based on above analysis, conclusions can be drawn as follows: (i)the calcination temperature of the supports has outstanding effect on the catalytic perfor-mance of their corresponding catalysts; (ii)the dispersi-ty of Pd and reduction property of the catalysts are key factors affecting the catalytic performance; (iii) the spe-cific activity is positive correlation to the specific area of the catalyst; (iV)soft-hard template method can impart the excellent thermal stability of the catalysts.
In soft-hard template method, calcination tempera-ture has strong effect on structure performance, redox property and activity of Ce0.65Zr0.35O2 supports and their corresponding catalysts. With calcination temperature increasing, the structure properties decline, but the OSC and reduction property of Ce0.65Zr0.35O2 increase because of phase reorganization to form two different phase components with Ce-rich and Zr-rich domains, which result in lattice distortion at the interfacial atom-ic layers. The redox property of their corresponding catalysts decreases with going up of calcination temper-ature because of the sintering of the supports which results in decline of three-way catalytic activity. Although high temperature roasting leads to decline of catalytic performance, the catalysts loaded on Ce0.65Zr0.35O2 prepared by soft-hard template method behave excellent activity compared with that calcined direct in air.
Lan L, Chen S H, Li H M, et al. Mater. Des., 2018,147:191-199 doi: 10.1016/j.matdes.2018.03.041
Deng J, Yuan S D, Xiong L, et al. Mater. Charact., 2019,155:109808 doi: 10.1016/j.matchar.2019.109808
Cai W, Zhong Q, Zhang S L, et al. Chem. Eng. J., 2014,236:223-232 doi: 10.1016/j.cej.2013.09.032
Zhao B, Li G F, Ge C H, et al. Appl. Catal. B, 2010,96:338-349 doi: 10.1016/j.apcatb.2010.02.031
Lan L, Chen S H, Zhao M, et al. J. Mol. Catal. A, 2014,394(15):10-21 http://www.wanfangdata.com.cn/details/detail.do?_type=perio&id=DE20101005498
Wang Q Y, Zhao B, Li G F, et al. Environ. Sci. Technol., 2010,44(10):3870-3875 doi: 10.1021/es903957e
Lee J, Oriall M C, Warren S C, et al. Nat. Mater., 2008,7(3):222-228 http://www.wanfangdata.com.cn/details/detail.do?_type=perio&id=DE20101005498
Xie G Q, Lu J Q, Zheng H Y, et al. J. Alloys Compd., 2010, 493(1/2):169-174 http://www.wanfangdata.com.cn/details/detail.do?_type=perio&id=DE20101005498
Zhang D. Korean J. Chem. Eng., 2008,25(5):1205-1207 http://www.wanfangdata.com.cn/details/detail.do?_type=perio&id=DE20101005498
黄利华,陈山虎,龚茂初,等.无机化学学报, 2016,32(2):193-201 http://www.wanfangdata.com.cn/details/detail.do?_type=perio&id=DE20101005498
Saada R, Kellici S, Heil T, et al. Appl. Catal. B, 2015,168:353-362 http://www.wanfangdata.com.cn/details/detail.do?_type=perio&id=DE20101005498
Alla S K, Kollu P, Singh S, et al. Mater. Res. Bull., 2018,104:65-71 doi: 10.1016/j.materresbull.2018.04.008
Mamontov E, Brezny R, Manoj M, et al. J. Phys. Chem. B, 2003,107:13007-13014 doi: 10.1021/jp030662l
Specchia S, Finocchio E, Busca G, et al. J. Catal., 2009,263:134-145 doi: 10.1016/j.jcat.2009.02.002
Deng J, Li S S, Xiong L, et al. Mater. Chem. Phys., 2019,236:121767 doi: 10.1016/j.matchemphys.2019.121767
Reddy B M, Khan A, Yamada Y, et al. Langmuir, 2003,19:3025-3030 doi: 10.1021/la0208528
Bozo C, Gaillard F, Guilhaume N. Appl. Catal. A, 2001,220(1/2):69-77 http://www.wanfangdata.com.cn/details/detail.do?_type=perio&id=DE20101005498
Kenevey K, Valdivieso F, Soustelle M, et al. Appl. Catal. B, 2001,29(2):93-101 http://www.wanfangdata.com.cn/details/detail.do?_type=perio&id=DE20101005498
Zhang H L, Hu W, Zhou C X, et al. Appl. Catal. A, 2018,563:204-215 doi: 10.1016/j.apcata.2018.07.012
Deng J, Li S S, Xiong L, et al. Appl. Surf. Sci., 2020, 505:144301 doi: 10.1016/j.apsusc.2019.144301
赵明,余全伟,蔡黎,等.功能材料, 2008(5):793-796 http://www.wanfangdata.com.cn/details/detail.do?_type=perio&id=DE20101005498
Gong P J, Xie J L, Fang D, et al. Chem. Eng. J., 2019,356:598-608 doi: 10.1016/j.cej.2018.09.042
Li S S, He J S, Dan Y, et al. Mater. Chem. Phys., 2020,240:122150 doi: 10.1016/j.matchemphys.2019.122150
Deng J, Zhou Y, Li S S, et al. J. Ind. Eng. Chem., 2018,64:219-229 doi: 10.1016/j.jiec.2018.03.018
Hinokuma S, Fujii H, Okamoto M, et al. Chem. Mater., 2010, 22:6183-6190 doi: 10.1021/cm102355x
Sekizawa K, Widjaja H, Maeda S, et al. Appl. Catal. A, 2000, 200(1/2):211-217 http://www.wanfangdata.com.cn/details/detail.do?_type=perio&id=DE20101005498
Kobayashi T Y T, Kayano T, Kayano K. Appl. Catal. B, 2001, 3:287-292 http://www.wanfangdata.com.cn/details/detail.do?_type=perio&id=DE20101005498
Guo J X, Shi Z H, Wu D D, et al. Mater. Res. Bull., 2013,48:495-503 doi: 10.1016/j.materresbull.2012.11.006
Lan L, Chen S H, Cao Y, et al. J. Colloid Interface Sci., 2015, 450:414-416 http://www.wanfangdata.com.cn/details/detail.do?_type=perio&id=DE20101005498
Kullgren J, Hermansson K, Broqvist P. J. Phys. Chem. Lett., 2013,4:604-608 doi: 10.1021/jz3020524
Martínez L M, Araque M, Centeno M A, et al. Catal. Today, 2015,242(5):80-90 http://www.wanfangdata.com.cn/details/detail.do?_type=perio&id=DE20101005498
Lin S Y, Yang L Y, Yang X, et al. Appl. Surf. Sci., 2014,305:642-649 doi: 10.1016/j.apsusc.2014.03.153
Wang Q Y, Li G F, Zhao B, et al. Appl. Catal. B, 2010,101(1/2):150-159 http://www.wanfangdata.com.cn/details/detail.do?_type=perio&id=DE20101005498
Christou S Y, Costa C N, Efstathiou A M. Top. Catal., 2004, 30:325-331 http://www.wanfangdata.com.cn/details/detail.do?_type=perio&id=DE20101005498
Wu Z L, Li M J, Overbury S H. J. Catal., 2012,285:61-73 doi: 10.1016/j.jcat.2011.09.011
Lan L, Yan C Y, Chen S H, et al. J. Taiwan Inst. Chem. Eng., 2018,85:98-105 doi: 10.1016/j.jtice.2017.12.022
Li S S, Zhang H L, Dan Y, et al. J. Mol. Catal., 2020,482:110696 doi: 10.1016/j.mcat.2019.110696
Iglesias-Juez A, Martinez-Arias A, Fernandez-Garcia M. J. Catal., 2004,221:148-161 doi: 10.1016/j.jcat.2003.07.010
Hungria A B, Fernandez-Garcia M, Anderson J A, et al. J. Catal., 2005,235:262-271 doi: 10.1016/j.jcat.2005.08.012
Barrera A, Viniegra M, Bosch P, et al. Appl. Catal. B, 2001, 34:97-111 doi: 10.1016/S0926-3373(01)00206-5
Muraki H, Zhang G. Catal. Today, 2000,63:337-345 doi: 10.1016/S0920-5861(00)00477-6
Kusatsugu K, Nakamura Y, Haneda M. Appl. Catal. A, 2019, 587:117268 doi: 10.1016/j.apcata.2019.117268
Kolli T, Kroger V, Keiski R L. Top. Catal., 2007,45:165-168 doi: 10.1007/s11244-007-0259-y
Li S S, Deng J, Dan Y, et al. Appl. Surf. Sci., 2020, 506:144866 doi: 10.1016/j.apsusc.2019.144866
Table 1. Lattice parameters and texture property of CeZr
| Sample | Cell parameter/nm | Crystal size/nm | Surface area/(m2·g-1) | Rmean / nm | V/(mL·g-1) |
| CeZr-N5 | 0.531 5 | 5.2 | 168 | 3.0 | 0.29 |
| CeZr-N6 | 0.529 9 | 5.2 | 144 | 3.5 | 0.27 |
| CeZr-N7 | 0.528 4 | 5.5 | 123 | 4.2 | 0.26 |
| CeZr-N8 | 0.528 2 | 6.6 | 89 | 5.9 | 0.26 |
| CeZr-N10 | 0.527 1 | 9.7 | 61 | 5.8 | 0.18 |
| CeZr-A10 | 0.530 3 | 10.8 | 16 | 15.2 | 0.1 |
 下载: 导出CSV
Table 2. Surface elemental content of CeZr and Pd/CeZr
| Sample | Surface composition / %a | nCe/nZr | fu3 / %b | xPd2 +c | |||
| Ce3d | Zr3d | O1s | Pd3d | ||||
| CeZr-N5 | 17.06 | 8.68 | 74.26 | — | 2.02 | 16.64 | — |
| CeZr-N6 | 16.67 | 8.65 | 74.68 | — | 1.92 | 16.40 | — |
| CeZr-N7 | 17.49 | 9.45 | 73.06 | — | 1.85 | 16.39 | — |
| CeZr-N8 | 16.92 | 9.72 | 73.36 | — | 1.74 | 16.04 | — |
| CeZr-N10 | 16.07 | 9.88 | 74.05 | — | 1.63 | 15.49 | — |
| Pd/CeZr-N5 | 16.50 | 8.37 | 73.93 | 1.20 | 1.97 | 17.25 | 100% |
| Pd/CeZr-N6 | 16.80 | 8.89 | 73.04 | 1.27 | 1.89 | 17.04 | 100% |
| Pd/CeZr-N7 | 17.25 | 9.36 | 72.10 | 1.29 | 1.84 | 16.88 | 100% |
| Pd/CeZr-N8 | 16.40 | 9.51 | 72.94 | 1.15 | 1.72 | 16.39 | 100% |
| Pd/CeZr-N10 | 15.96 | 9.96 | 73.02 | 1.06 | 1.62 | 16.13 | 100% |
| a Molar fraction; b Aarea fraction of u3 peak to all the characteristic peaks of Ce3d; c Molar fraction, xPd2+=nPd2+/nPd×100%. | |||||||
下载: 导出CSV
Table 3. T50 and T90 of C3H8, NO, CO on the catalysts
| Catalyst | T50/℃ | T90/℃ | ||||||
| C3H8 | NO | CO | C3H8 | NO | CO | |||
| Pd/CeZr-N5 | 251 | 152 | 120 | 290 | 185 | 180 | ||
| Pd/CeZr-N6 | 240 | 125 | 105 | 285 | 150 | 152 | ||
| Pd/CeZr-N7 | 238 | 120 | 108 | 280 | 150 | 150 | ||
| Pd/CeZr-N8 | 262 | 163 | 120 | 300 | 200 | 185 | ||
| Pd/CeZr-N10 | 274 | 175 | 133 | 310 | 216 | 201 | ||
| Pd/CeZr-A10 | 335 | 220 | 190 | 365 | 245 | 225 | ||
下载: 导出CSV
Table 4. T50andT90of C3H8, NO, CO on unit specific surface of the catalysts
| Catalyst | T50 / (℃·g·m-2) | T90 / (℃·g·m-2) | |||||
| C3H8 | NO | CO | C3H8 | NO | CO | ||
| Pd/CeZr-N5 | 1.49 | 0.9 | 0.71 | 1.73 | 1.10 | 1.07 | |
| Pd/CeZr-N6 | 1.67 | 0.87 | 0.73 | 1.98 | 1.04 | 1.06 | |
| Pd/CeZr-N7 | 1.93 | 0.98 | 0.88 | 2.28 | 1.22 | 1.22 | |
| Pd/CeZr-N8 | 2.94 | 1.83 | 1.35 | 3.37 | 2.25 | 2.08 | |
| Pd/CeZr-N10 | 4.49 | 2.87 | 2.18 | 5.08 | 3.54 | 3.30 | |
| Pd/CeZr-A10 | 20.94 | 13.75 | 11.88 | 22.81 | 15.31 | 14.00 | |
下载: 导出CSV

 扫一扫看文章

扫一扫关注我们