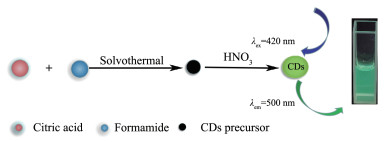
Figure 1.
Schematic diagram of synthesis of green fluorescent CDs
Nitric Acid Assisted Synthesis of Water-Soluble Green Fluorescent Carbon Dots for pH Measurement and Fe3+ Ions Detection
Ya-Chao KANG , Yuan-Yuan HUANG , Hua-Zhen SUN , Wan-Li ZHENG , Xian-Li MA , Dong-Li JIANG

In the past decade, the fluorescent carbon dots (CDs), as a kind of new fluorescent material, has dem-onstrated its bright application prospects in cell imag-ing[1], photocatalysis[2], photoelectric devices[3], biosen-sors[4] and other fields due to its unique luminescence characteristics, stable optical properties[5] and other advantages. Compared with traditional semiconductor quantum dots, fluorescent carbon dots exhibit better biocompatibility since they are free of toxic heavy metals. However, most of the reported fluorescent car-bon dots emit blue light, which are similar to the blue fluorescence emitting from the fluorescent substances in the organism after excitation, resulting in a relatively low signal-to-noise of the living body fluorescence imaging[6]. Meanwhile, the short - wavelength excitation light will be harmful to living cells and biological sys-tems[7]. Obviously, these shortcomings seriously hinder their further application in the biological field. There-fore, synthesizing long - wave emission fluorescent car-bon dots has gradually become a new research hotspot. Recently, some red or green fluorescent carbon dots have been reported with the efforts of the researchers. Gao et al. [8] synthesized carbon dots that emitted red fluorescence in DMSO. Ding et al.[9] obtained different long -wave emission fluorescent carbon dots by separat-ing via silica column chromatography. Lu et al. [10] acquired an orange -red fluorescent polymer carbon dots in alcohol with a quantum yield (QY) of 30.64%, in which dopamine and o - phenylendiamine were used as the carbon source. Xu et al.[11] reported a green fluo-rescent CDs (QY=2.46%) prepared by hydrothermal method using aniline and urea as raw materials. Miao et al.[12] synthesized fluorescence carbon dots from cit-ric acid and urea, which could emit green fluorescence in ethanol. However, the reported long - wave emission CDs usually suffer from several drawbacks such as poor water - solubility, low quantum yield, expensive raw materials, complex synthesis processes and single function. Consequently, it is still a challenge to devel-op cheaper and simpler processes to synthesize long - wave emission fluorescent carbon dots that can serve multiple purposes with good water - solubility and high quantum yield.
Iron ion (Fe3+) is one of the essential trace ele-ments in the human body. It is an essential component of heme groups and iron-sulfur protein. It plays a cru-cial role in many physiological activities, including en-zyme catalysis, oxygen transportation, oxygen metabo-lism, transcriptional regulation and other processes[13]. Studies have demonstrated that the deficiency or excess of iron ions in the human body can lead to vari-ous physical problems such as anemia, heart failure and tissue damage[14]. Therefore, it is very important to detect Fe3+ selectively and accurately in the environ-ments and organisms. So far, the methods for detecting Fe3+ mainly include spectrophotometry[15], inductively coupled plasma - mass spectrometry[16], atomic absorp-tion spectrometry[17] and electrochemistry[18]. These detection methods show high precision and accuracy. However, they usually require complicated operation process, cumbersome sample processing and expensive equipment, which make them difficult to suit for rapid detection. Fluorescence spectrometry can be designed to detect metal ions due to their high sensitivity, conve-nience and fast response. Nevertheless, the reported fluorescent probes, such as the organic chromophore, the fluorescent conjugated polymer and the traditional semiconductor quantum dots, are generally toxic, water insoluble and poor biocompatibility, which may limit their applications in biological detection. Accordingly, it is very important and necessary to develop a low - cost, biocompatible, low - toxic, water - soluble fluores-cent probe for Fe3+ detection.
In this work, a good water-solubility green fluores-cence- emitting carbon dots was synthesized using cheap citric acid, formamide and concentrated nitric acid as raw materials. The fluorescence performance of as-prepared CDs was examined, and its possible appli-cations in anti - counterfeiting technique, the pH probe and Fe3+ detection were investigated.
Citric acid, HCONH2, CH3COCH3, HNO3, KBr, Fe(NO3) 3, NiCl2 and Cu(NO3)2 were purchased from Xilong chemical industry Co., Ltd.; SnCl2, NaOH, MgCl2, AgNO3, CrCl3, HgCl2, Pb(NO3)2, Cd(NO3)2 and BaCl2 were obtained from Sinopharm Chemical Reagent Co., Ltd. The reagents used were all AR grade. The ultrapure water used in the experiment was from HHitech Medium - S800UVF with a resistivity of 18.2 MΩ·cm.
The preparation of the CDs precursor was similar to the related literature[8]. Firstly, 1.53 g of citric acid was dissolved in 25 mL formamide thoroughly to form a clear solution. Afterward, the as-prepared solution was transferred to 50 mL Teflon- lined stainless -steel auto-clave and heated at 160 ℃ for 6 h in an oven. After cooling down to room temperature, the as-prepared so-lution was centrifuged at the speed of 16 000 r·min-1 for 5 min. The precipitate was washed with acetone un-til the supernatant being colorless and dried in an oven at 60 ℃ for 12 h to obtain the CDs precursor.
Then, 0.04 g of CDs precursor reacted with 0.5 mL of concentrated nitric acid for 1 min at room tem-perature. After that, ultrapure water was added into the mixture to prepare 50 mL solution. Subsequently, the mixed solution was centrifuged at the speed of 16 000 r·min-1 for 5 min. The supernatant (the green fluores-cent CDs solution) was retained and stored at 4 ℃ for further research.
After lyophilizing the CDs with BIOCOOL Pilot 2-4LD vacuum freeze dryer, its phase composition was characterized by the Bruker D8 Advance X-ray diffrac-tometer operated at 40 kV and 40 mA with a graphite monochromatized Cu Kα1 radiation (λ =0.154 06 nm). The sample was tested at a scan rate of 6 (°)·min-1 with the scanning 2θ angles from 10° to 70°. The morphology, size and dispersibility of the sample were observed by FEI Tecnai F20 field emission high resolution-transmission electron microscope (HRTEM) at an ac-celerating voltage of 200 kV. The functional groups of the samples were measured by Fourier transform infra-red spectroscopy (FT -IR, IRPrestige-21) using the KBr pellet technique with a scan range of 4 000~400 cm-1.
The fluorescence spectra of the samples were test-ed with Shimadzu RF-5301 fluorescence spectrometer. The fluorescence lifetime of the sample was measured using a FLS - 980 fluorescence spectrophotometer with 359 nm as the excitation wavelength. The QY of CDs was measured according to the method described in the literature[19]. The rhodamine 6G was chosen as the stan-dard substance. The UV absorption values of CDs solu-tion and rhodamine 6G (dissolved in absolute ethanol) were measured by UV - 1600PC ultraviolet spectropho-tometer (the UV absorption value was ensured to be be-low 0.1[20]). The UV absorption values and the fluores-cence emission curve of the CDs solution and the rho-damine 6G solution were measured with excitation at 420 nm. The calculated peak area and the measured UV absorption value were substituted into the following formula:
|
$ {\mathit{\Phi }_{\rm{x}}} = {\mathit{\Phi }_{\rm{s}}}\left( {{A_{\rm{s}}}/{A_{\rm{x}}}} \right)\left( {{F_{\rm{x}}}/{F_{\rm{s}}}} \right)\left( {\eta _{\rm{x}}^2/\eta _{\rm{s}}^2} \right) $ |
(1) |
Where Φ is the QY (Φs=95%), A is the ultraviolet ab-sorption value, F is the integral area of the fluores-cence emission curve, η is the refractive index of the solvent, s is the standard substance, and x is the sam-ple to be tested.
To investigate the effect of pH value of the solu-tion on the fluorescence intensity of the green fluores-cent CDs, experiments were carried out in PBS with di-luted HCl or NaOH to adjust the pH values from 1 to 10. The solutions for testing were prepared by mixing the CDs original solution and the above PBS solution with a designated pH value by a volume ratio of 1:49, and then trace amounts of 1 mol·L-1 HCl or 1 mol·L-1 NaOH was used to fine - tune the pH value of the as - prepared mixture. The changes in fluorescence intensi-ty of CDs were measured using 420 nm as the excita-tion wavelength.
To investigate whether the green fluorescence of the as-prepared CDs can be quenched by Fe3+ ions, the CDs original solution was diluted by ultrapure water with a volume ratio of 1:49 and then 1 mol·L-1 Fe3+ was dropped into the diluted CDs solution to form a solu-tion with a Fe3+ concentration of 20 mmol·L-1. The fluo-rescence intensities of diluted CDs solution before and after adding Fe3+ were first estimated by visual inspec-tion and precisely tested with Shimadzu RF-5301 fluo-rescence spectrometer.
And then, the selectivity and specificity of the as-prepared CDs in Fe3+ ions detection was evaluated as follows: 1 mol·L-1 of Mn+ solution (Mn+=Fe3+, Ba2+, Ag+, Cd2+, Cr3+, Hg2+, Mg2+, Ni2+, Pb2+, Sn2+, Zn2+) was added into the diluted CDs solution (1:50 dilution of CDs original solution by ultrapure water) to form a solution with a Mn+ concentration of 20 mmol·L-1. The fluores-cence intensities of the above solutions were measured under the same test conditions.
To examine the sensitivity of the as-prepared CDs in Fe3+ ions detection, 100 μL of different concentra-tions of Fe3+ solutions was added into 4.9 mL of CDs di-luted solution (dilution ratio being 1:50) to prepare so-lutions with Fe3+ concentration of 0~20 mmol·L-1, their emission fluorescence spectra were measured under the same test parameter.
Fig. 2a is the X - ray diffraction (XRD) pattern of the as - prepared CDs. The broad diffraction peak cen-tered at 2θ=26° can be attributed to amorphous carbon. And the d value (0.34 nm) is similar to the graphite lat-tice space, indicating a graphite structure being in the CDs[21-23].
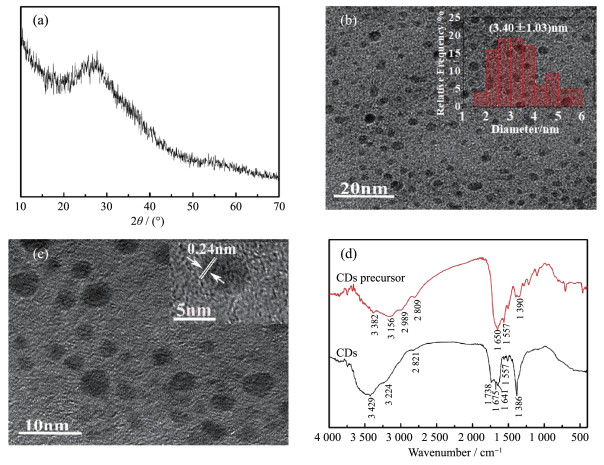
It can be observed from the TEM and HRTEM images of the CDs sample (Fig. 2b and c) that the CDs particles were well dispersed quasi-spherical nanopar-ticles. The particle diameter was 1.64~5.91 nm, and the average particle diameter was (3.40±1.03) nm. The measured lattice spacing was about 0.24 nm, which was close to the lattice spacing of graphene (1120) [24]. In addition, as shown in Fig. 2c, most particles were amorphous particles without any obvious lattice fring-es, which is consistent with the XRD pattern results.
Fig. 2d is the comparison of infrared spectra of CDs precursors and CDs samples. There were broad absorption peaks at 3 000~3 500 cm-1 and weak absorption peaks at 2 809, 2 989 and 2 820 cm-1 in both spectra of CDs and CDs precursors which can be assigned to O - H[25] and N - H[26] stretching vibration peaks and the stretching vibration of C-H[27], respective-ly. And the peaks at 1 650 and 1 675 cm-1 can be at-tributed to the stretching vibration of C=O[28], the ab-sorption peak at 1 557 cm-1 corresponds to the defor-mation vibration of N- H[29], which demonstrate that the amide bonds exist in both CDs and CDs precursors. However, unlike the IR spectra of CDs precursors, there was a strong absorption peak at 1 389 cm-1, suggesting the -NO2 groups on the CDs surface. Anoth-er strong absorption peak of CDs at 1 738 cm-1 indi-cates the carbonyl of the carboxyl groups[30] existing in the CDs, and the carboxyl groups may be the product of partial hydrolysis of the amide bonds by treating the CDs precursor with concentrated nitric acid. Obvious-ly, there are rich hydrophilic groups such as carboxyl groups, hydroxyl groups and nitro groups on the CDs surface, leading to a good water-solubility of CDs.
The green fluorescent CDs is essentially colorless under natural light and can emit bright green fluores-cence under UV light (Fig. 3a inset). From its fluores-cence spectra (Fig. 3a), it is obvious that as the excita-tion wavelength ranged from 360 to 460 nm, the CDs kept emitting green fluorescence with maximum peak around 500 nm, revealing an excitation-independent PL behavior. When the excitation wavelength was 420 nm, the fluorescence intensity reached the maximum. By choosing rhodamine 6G as the reference substance, its relative QY was measured as high as 44.2% in water.
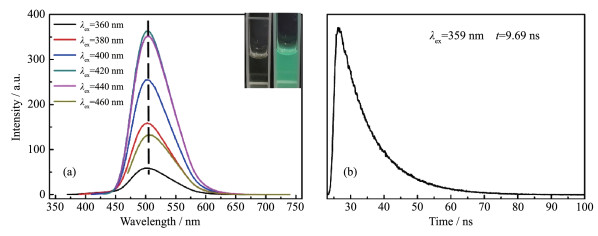
Inset: image of CDs under natural light and UV light
Fig. 3b is the fluorescence lifetime decay profile of the as-prepared CDs. Apparently, the fluorescence life-time of the as - prepared CDs was single exponential decay with only one fluorescence lifetime of 9.69 ns. The result indicates that the green CDs is relatively uniform in structure[11], which might be the reason for its excitation-independent PL behavior mentioned above.
The above results confirm excellent fluorescence characteristics of the as - prepared CDs. When it was used as ink to write words on a piece of paper, the writ-ten words emerged clearly with green fluorescence un-der 365 nm UV light and were invisible in natural light (Fig. 4a). This property highlights its promising applica-tion in fluorescent ink and anti-counterfeiting.
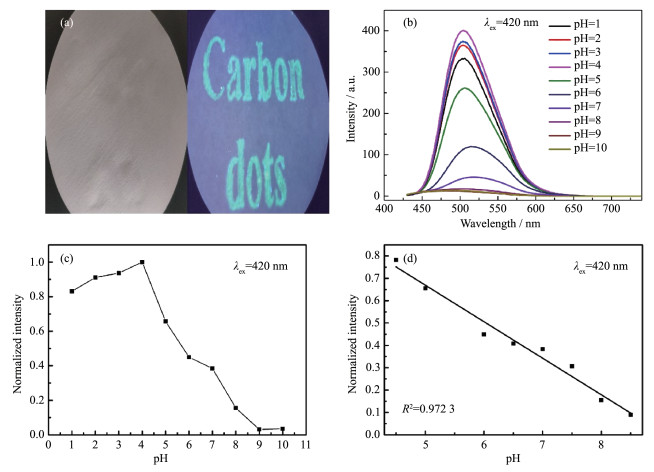
Unlike most of reported carbon dots, the fluores-cence intensity of as-prepared CDs varied with the pH values of the CDs solution. As shown in Fig. 4b and 4c, the fluorescence intensity of CDs got stronger as the pH value varied from 1 to 4, and it reached the maxi-mum when the pH value was 4. The fluorescence inten-sity of CDs solution decreased rapidly as the pH value continued increasing; particularly, the normalized fluo-rescence intensity decreased linearly as the pH increased from 4.5 to 8.5 (Fig. 4d), and the correspond-ing equation was y=1.486 6-0.163 4pH with the linear correlation coefficientR2=0.972 3. In extreme alkaline environment, the fluorescence of CDs almost became hard to be detected. The possible reasons are as fol-lows: with the change of pH value of solution, the pro-tonation and deprotonation[31] of carboxyl functional groups on the surface of CDs may change the Fermi[32] level of CDs, resulting in the pH dependence of CDs. The above results show that the as - prepared CDs may have potential application as fluorescent sensors for pH measurement, especially in the physiological pH range. 2.3.3 CDs for Fe3+ ions detection
As shown in Fig. 5a, a concentration of 20 mmol· L-1 Fe3+ ions might significantly quench the bright green fluorescence of CDs, indicating the as - prepared CDs may be applied in Fe3+ ions detection. Some com-mon metal ions (Mn+=Fe3+, Ba2+, Ag+, Cd2+, Cr3+, Hg2+, Mg2+, Ni2+, Pb2+, Sn2+ and Zn2+) were chosen as research subjects to investigate the selectivity and specificity of CDs in Fe3+ ions detection. The corresponding results are shown in Fig. 5b. Clearly, when the concentrations of the selected metal ions were 20 mmol·L-1, three kinds of ions (Fe3+, Cr3+ and Sn2+) had a considerable effect on the fluorescence of CDs. The fluorescence quenching efficiency of Fe3+, Cr3+ and Sn2+ to CDs was calculated to be 98%, 62% and 70%, respectively. In comparison, the fluorescence of CDs can be almost completely quenched by Fe3+, indicating good selectivi-ty and specificity of CDs in Fe3+ ions detection, espe-cially in an environment without Cr3+ and Sn2+.
In view of this, the sensitivity of CDs in Fe3+ ions detection was further explored. The results are shown in Fig. 5c and d. Obviously, the fluorescence intensity of CDs decreased rapidly when the concentration of Fe3+ increased from 0 to 1 mmol·L-1, and a slowly fluo-rescence decrease behavior appeared as the concentra-tion of Fe3+ continued to rise from 1 to 20 mmol·L-1. When the concentration of Fe3+ ions reached 8 mmol· L-1, the fluorescence intensity of CDs was substantially quenched. Further investigation reveals that there is a good linear relationship between the quenching effi-ciency of green fluorescence CDs (I0/I) and the concen-tration of Fe3+ within a range of 0~1 000 μmol·L-1 (Fig. 5e), which is consistent with the Stern - Volmer[13] equation.
|
$ {I_0}/I = 1 + {K_{{\rm{sv}}}}{c_{\rm{Q}}} $ |
(2) |
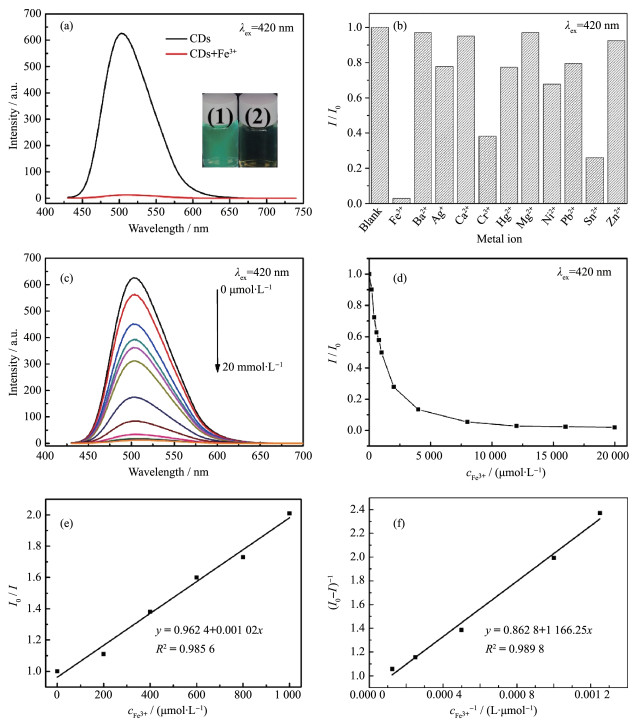
Inset: fluorescence photographs of CDs in the absence (1) and presence (2) of Fe3+ upon excitation under a UV lamp
where I0 is the fluorescence intensity of CDs without Fe3+; I is the fluorescence intensity of CDs after adding Fe3+; KSV is the Stern -Volmer quenching constant; cQ is the concentration of Fe3+ (μmol·L-1). Taking the Fe3+ concentration as the abscissa and I0/I as the ordinate, the equation of Stern-Volmer was obtained as follows: y =0.962 4+0.001 02x, and the linear correlation coeffi-cient R2 was 0.985 6. The detection limit was 9.8 μmol·L-1 based on 3σ/k (σ is the standard deviation of the blank measurements of the CDs and k is the slope of the fitting line). The above results indicate potential application of the CDs in low concentration Fe3+ detection.
From the above results, it can be found that the CDs applied for ion detection is based on the fluores-cence quenching of CDs by Fe3+. Generally, fluores-cence quenching can be divided into dynamic quench-ing and static quenching[33]. The Stern-Volmer equation (2) and the Lineweaver-Burk equation (3)[34] are usually employed to describe the dynamic and static quench-ing behavior, respectively.
|
$ {\left( {{I_0} - I} \right)^{ - 1}} = {\left( {{I_0}} \right)^{ - 1}} + K_{{\rm{LB}}}^{ - 1}{\left( {{I_0}} \right)^{ - 1}}c_{\rm{Q}}^{ - 1} $ |
(3) |
where KLB is the binding constant of Fe3+ and CDs during static fluorescence quenching. As mentioned above, the fluorescence quenching efficiency of CDs by the Fe3+ at a concentration range of 0~1 000 μmol·L-1 is consistent with the Stern - Volmer equation, indicat-ing a dynamic quenching behavior involved. Yet, when the concentrations of Fe3+ increased from 800 μmol·L-1 to 8 mmol·L-1, the plot of I0/I versus Fe3+ ion concentra-tion can be fitted with a conventional linear Lineweaver-Burk equation (Fig. 5f), suggesting a static quenching processes occurred. Hence, the fluorescence quench-ing effect of Fe3+ to CDs involves both dynamic and static quenching in the entire test concentration range.
The possible fluorescence quenching mechanism by Fe3+ is analyzed. The IR spectra of CDs reveal that there are a large number of hydroxyl, carboxyl groups and nitro groups on the CDs surface. The Fe3+ ions may be quickly absorbed on the surface of CDs and coordi-nate with carboxyl groups and hydroxyl groups due to their stronger binding force and faster chelation kinet-ics with carboxyl and hydroxyl groups than other metal ions[35]. These behaviors result in the severe aggrega-tion of CDs with each other[35]. Meanwhile, the Fe3+ ions possess half - filled 3d orbits (3d5) and they are very strong electron acceptors. The electrons in the excited state of CDs may transfer to the unfilled orbital of Fe3+ because of the above coordination interaction and result in non - radiative electron/hole recombination[27], which causing significant fluorescence quenching of CDs. Additionally, by analyzing the solubility product constant (Ksp) data of M(OH)n, we find that there is a certain correlation between the quenching efficiency and the value of Ksp. Compared with other metal ions, three kinds of ions (Cr3+, Sn2+, and Fe3+) with greater fluorescence quenching effect on CDs are all possess-ing smaller Ksp (Ksp, Cr(OH)3=6×10-31, Ksp, Sn(OH)2=1.4×10⁻²⁸, Ksp, Fe(OH)3=4×10-38). It seems the higher the quenching efficiency is, the smaller the Ksp is. Yet, it is not an ab-solute positive correlation. In a word, the fluorescence quenching of CDs by Fe3+ is a complicated process and may cause by cumulative impact of the above men-tioned factors, which needs to be further improved.
In summary, we successfully synthesized a water-soluble green fluorescence CDs with good fluorescence properties by using citric acid, formamide and concen-trated nitric acid as raw materials. The as - synthesized CDs shows an excitation-independent PL behavior and a high quantum yield (44.2%), which can be applied in anti- counterfeiting technique. The fluorescence intensi-ty of CDs is pH sensitive, making it a potential candi-date for pH measurement, especially in the physiologi-cal pH range. In addition, the green fluorescent CDs exhibits excellent selective response and a relative low detection limit (9.8 μmol·L-1) as well as a good linear relationship with Fe3+ in a concentration range of 0~1 000 μmol·L-1, which endows its potential applica-tions in Fe3+ detection.
Li N, Liang X F, Wang L L, et al. J. Nanopart. Res., 2012, 14(10):1-9
Zhang B, Maimaiti H, Zhang D D, et al. J. Photochem. Photo-biol. A, 2017, 345:54-62 doi: 10.1016/j.jphotochem.2017.05.031
Chen J, Liu W, Mao L H, et al. J. Mater. Sci., 2014, 49(21):7391-7398 doi: 10.1007/s10853-014-8413-y
Chen P C, Chen Y N, Hsu P C, et al. Chem. Commun., 2013, 49(16):1639-1641 doi: 10.1039/c3cc38486a
Xiong Y, Schneider J L, Reckmeier C J, et al. Nanoscale, 2017, 9(32):11730-11738 doi: 10.1039/C7NR03648E
Jun Y W, Kim H R, Reo Y J, et al. Chem. Sci., 2017, 8(11):7696-7704 doi: 10.1039/C7SC03362A
Yu C, Peng R Y. Mil. Med. Res., 2018, 4(1):24
Gao D, Liu X L, Jiang D L, et al. Sens. Actuator B, 2018, 277:373-380 doi: 10.1016/j.snb.2018.09.031
Ding H, Yu S B, Wei J S, et al. ACS Nano, 2016, 10(1):484-491 doi: 10.1021/acsnano.5b05406
卢思宇, 杨柏.高分子学报, 2017(7):1200-1206LU Si-Yu, YANG Bai. Acta Polym. Sin., 2017(7):1200-1206
Xu Q, Zhang M R, Liu Y, et al. New J. Chem., 2018, 42(12):10400-10405 doi: 10.1039/C8NJ01639A
Miao X, Qu D, Yang D X, et al. Adv. Mater., 2017, 30(1):1704740
Mu X Y, Li Q, Dong P, et al. Biosens. Bioelectron., 2013, 49:249-255 doi: 10.1016/j.bios.2013.05.019
Senol M A, Onganer Y, Meral K. Sens. Actuator B, 2017, 239:343-351 doi: 10.1016/j.snb.2016.08.025
Bazmandegan-Shamili A, Haji Shabani A M, Dadfarnia S, et al. J. Iran. Chem. Soc., 2017, 4(4):843-851
Su C K, Chen Y T, Sun Y C. Microchem. J., 2019, 146:835-841 doi: 10.1016/j.microc.2019.02.015
Wang R, Wang W, Ren H, et al. Biosens. Bioelectron., 2014, 57:179-185 doi: 10.1016/j.bios.2014.01.056
Węgiel K, Robak J, Baś B. RSC Adv., 2017, 7(36):22027-22033 doi: 10.1039/C7RA03019C
Zhao X W, Zhang J L, Shi L H, et al. RSC Adv., 2017, 7(67):42159-42167 doi: 10.1039/C7RA07002K
Zan M H, Rao L, Huang H M, et al. Sens. Actuator B, 2018, 262:555-561 doi: 10.1016/j.snb.2017.12.177
Qu S N, Wang X Y, Lu Q P, et al. Angew. Chem. Int. Ed., 2012, 51(49):12215-12218 doi: 10.1002/anie.201206791
Wu M B, Wang Y, Wu W T, et al. Carbon, 2014, 78:480-489 doi: 10.1016/j.carbon.2014.07.029
张筱喆, 张文君, 张祖星, 等.无机化学学报, 2015, 31(1):1-6ZHANG Xiao-Zhe, ZHANG Wen-Jun, ZHANG Zu-Xing, et al. Chinese J. Inorg. Chem., 2015, 31(1):1-6
Miao X, Yan X L, Qu D, et al. ACS Appl. Mater. Interfaces, 2017, 9(22):18549-18556 doi: 10.1021/acsami.7b04514
Wang H, Sun C, Chen X R, et al. Nanoscale, 2017, 9(5):1909-1915 doi: 10.1039/C6NR09200D
Shang J Z, Ma L, Li J W, et al. Sci. Rep., 2012, 2(6108):792
Liu W, Diao H P, Chang H H, et al. Sens. Actuator B, 2017, 241:190-198 doi: 10.1016/j.snb.2016.10.068
Zhu S J, Meng Q N, Wang L et al. Angew. Chem., 2013, 125(14):4045-4049 doi: 10.1002/ange.201300519
Das P, Bose M, Ganguly S, et al. Nanotechnology, 2017, 28(19):195501 doi: 10.1088/1361-6528/aa6714
Zhai X Y, Zhang P, Liu C J, et al. Chem. Commun., 2012, 48(64):7955-7957 doi: 10.1039/c2cc33869f
Chen J L, Yan X P. Chem. Commun., 2011, 47(11):3135-3137 doi: 10.1039/c0cc03999c
Jia X F, Li J, Wang E. Nanoscale, 2012, 4(18):5572-5575 doi: 10.1039/c2nr31319g
Geethanjali H S, Nagaraja D, Melavanki R M, et al. J. Lumin., 2015, 167:216-221 doi: 10.1016/j.jlumin.2015.06.040
Liu Q, Huang A, Wang N, et al. J. Lumin., 2015, 161:374-381 doi: 10.1016/j.jlumin.2015.01.045
Yang R, Guo X F, Jia L H, et al. Appl. Surf. Sci., 2017, 423:426-432 doi: 10.1016/j.apsusc.2017.05.252

Figure 2 (a) XRD pattern of CDs; (b) TEM image of CDs (Inset: diameter distribution of CDs); (c) HRTEM images of CDs; (d) FT-IR spectra of CDs precursor and CDs

Figure 3 (a) Fluorescence spectra of CDs; (b) Fluorescence lifetime decay profile of CDs
Inset: image of CDs under natural light and UV light

Figure 4 (a) Photos of text written with CDs solution under natural light (left) and UV light (right); (b) Emission spectra of as-prepared CDs solutions at different pH values; (c) Normalized fluorescence intensity of as-prepared CDs solutions at different pH values; (d) Linear relationship between normalized fluorescence intensity of as-prepared CDs solutions and pH value in a range of 4.5~8.5

Figure 5 (a) Emission spectra of CDs solution before and after adding Fe3+ (20 mmol·L-1); (b) Fluorescence responses of CDs in the presence of different metal ions (I and I0 correspond to the fluorescence intensity with and without metal ions, respectively; the metal ion concentration is 20 mmol·L-1); (c) Emission spectra of CDs in the presence of Fe3+ with different concentrations; (d) Plot of fluorescence intensity ratio (I/I0) of CDs versus concentration of Fe3+; (e)Stern-Volmer plot of CDs in the presence of Fe3+ with different concentrations (0~1 000 μmol·L-1); (f) Lineweaver-Burk double-reciprocal plot of CDs in the presence of Fe3+ with different concentrations (800 μmol·L-1~8 mmol·L-1)
Inset: fluorescence photographs of CDs in the absence (1) and presence (2) of Fe3+ upon excitation under a UV lamp

 扫一扫看文章

扫一扫关注我们
 下载:
下载:

 下载:
下载: