Figure 1.
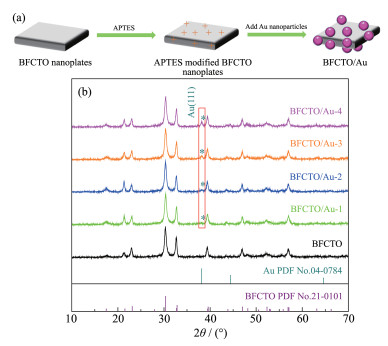
(a) Schematic diagram of synthesis procedure used to obtain BFCTO/Au nanocomposites; (b) XRD patterns of the samples

Semiconductor photocatalysis is considered to be one of the most promising green and environmentally - friendly approaches for solving the issues of environ-mental pollution and increasing energy demand[1-5]. In recent years, bismuth-based oxides with Aurivillius-layered structure such as BiOX, Bi2WO6, Bi2MoO6, BiVO4, BiFeO3 and Bi2O 2CO 3 have been considered to be highly promising visible - light - activated photocata-lysts due to their unique crystal and electronic structure[6-14]. In particular, bismuth-based complex oxides Bin+1Fen-3Ti3O3n+3 formed by perovskite-type (Bin-1Fen-3Ti3O3n+1)2- blocks sandwiched between fluorite -type (Bi2O2)2+ slabs have received increasing attention due to their photocatalytic activity in the degradation of organic pollutants. By adjusting the layer number (n=3, 4, 5, 6, etc.) or doping ions (Co3+, La3+, Ni2+, Mn2+, etc.), the Bin+1Fen-3Ti3O3n+3 displayed prominent visible -light-driven photocatalytic and other unique proper-ties. In 2008, Sun et al. prepared an excellent visible -light driven photocatalyst Bi5FeTi3O15 with 4 layer by a facile hydrothermal method[15]. In 2013, Hou et al. syn-thesized the Bi4Ti3O12 (n=3) nanofibers with enhanced visible-light photocatalytic activity[16]. In 2014, Li et al. prepared the visible light responsive Bi 7Fe3Ti3O21 (n=6) nanoshelf photocatalysts[17]. In 2015, by Co ions doping, Ge et al. synthesized the Bi6Fe1.9Co0.1Ti3O18 (n=5) nano-crystal with different morphologys exhibiting visi-ble-light photocatalytic activity[18]. However, the perfor-mance of the pristine Bin+1Fen-3Ti3O3n+3 materials is lim-ited by their low photocatalytic activity. Therefore, the decoration of noble metals on semiconductor photocata-lysts is a promising approach for enhancing their photo-catalytic activity.
The high activity of the decorated semiconductor photocatalysts is related to the generation and migra-tion of the photogenerated hot electrons arising due to the Schottky barrier formed between the metal and the semiconductor. Moreover, noble metals nanoparticles can improve visible light absorption due to the surface plasmon resonance (SPR) effect[19-22]. In 2017, Liu et al. synthesized the Au nanoparticles loaded on Fe-doped Bi4Ti3O12 nanosheets with exposed {001} facets. The Au-2%Fe/Bi4Ti3O12 sample exhibited the highest photo-catalytic activity compared with other samples[23]. In 2018, Li et al. prepared a high efficiency photocatalyst Bi4Ti3O12/Au, in which Au nanorods selectively an-chored on the active (001) facets of Bi4Ti3O12 nanosheets[24]. In 2019, Zhao et al. synthesized the Au-Ag@Bi4Ti3O12 composite with the aim of synergisti-cally enhancing the photocatalytic performance[25]. Gu et al. prepared the Au@Bi6Fe2Ti3O18 nanofibers by elec-trospinning method with improved the photocatalysis performance[26].
Therefore, in this work, we synthesized visible -light-driven BFCTO/Au nanocomposite photocatalysts by a facile assembly method. The photocatalytic activi-ty of the obtained nanocomposites was enhanced rela-tive to that of pristine BFCTO by introducing Au nanoparticles with different sizes into the BFCTO nano-plates. The BFCTO/Au-1 sample exhibited the stron-gest photocatalytic activity under visible light irradia-tion.
All the chemicals, namely Ti(OC4H9)4 (≥99.7%), Bi(NO3)3·5H2O (≥99%), Fe(NO3)3·9H2O (≥98.5%), Co(NO3)2·6H2O (≥98.5%), HNO3 (65.0~68.0%), NaOH (≥96.0%), ethanol (99.7%), 3-aminopropyltriethoxysi-lane (APTES, > 98%), hydrogen tetrachloroaurate (47.8%), trisodium citrate dehydrate (≥99.0%), were purchased from Sinopharm Chemical Reagent Co., Ltd. without further purification.
The BFCTO nanoparticles were synthesized by the hydrothermal method according to our previous re-port[18]. The concentration of NaOH added to the above solutions was adjusted to 0.75 mol·L-1.
Au nanoparticles were prepared using the method introduced by Frens[27]. Au nanoparticles with various diameters of ~23 nm, ~36 nm, ~55 nm and ~80 nm were prepared by rapidly injecting a 38.8 mmol·L-1 sodium citrate solution with different volumes of 2.0, 1.5, 1.0 and 0.5 mL into a boiling HAuCl4 aqueous so-lution under vigorous stirring, respectively.
The prepared 0.2 g BFCTO nanoparticles were added into the APTES solution, and stirred for 6 h at room temperature. Then the prepared Au nanoparticles solution was added. The obtained nanoparticles were collected by centrifugation and washed for several times with deionized water, and dried at 60 ℃ in vacu-um for 12 h. In this work, Au nanoparticles with vari-ous diameters (~23 nm, ~36 nm, ~55 nm and ~80 nm) were loaded on the surface of BFCTO nanoplates. The obtained products were denoted as BFCTO/Au-1, BFC-TO/Au-2, BFCTO/Au-3 and BFCTO/Au-4, respectively.
Powder X-ray diffraction (XRD) patterns were characterized by Philips X'pert diffractometer operat-ing at 40 kV and 30 mA with a scan step width of 0.02° in a 2θ range of from 10° to 70° employing Cu Kα radi-ation (λ=0.154 05 nm). Sizes and morphologies of the samples were observed by scanning electron microsco-py (SEM, JEOL, JSM-6700F, 10 kV) and transmission electron microscopy (TEM, Tecnai G2 TF30, 200 kV). The X -ray photoelectron spectroscopy (XPS) measure-ments were carried out on an ESCALAB 250 system with a monochromatic Al Kα X-ray source (Thermo-VG Scientific). Ultraviolet-visible- near infrared (UV-Visible - NIR) diffuse reflectance spectra were recorded with a Shimadzu SolidSpec-3700 equipped with an integrating sphere, and BaSO4 was used as the refer-ence. The specific surface area was measured by BET (Brunauer-Emmett-Teller) method using the N2 adsorp-tion isotherm (Quantachrome QuadraWin). The photo-luminescence (PL) spectra (lex=325 nm) were recorded by a fluorescence spectrophotometer (FLS 980).
The photocatalytic performances of the as -prepared samples were evaluated by the decomposition of rhoda-mine B (RhB)/methyl orange (MO) aqueous solution under visible-light irradiation. The light source was a 20 W fluorescent lamp with wavelength of 400~720 nm. The irradiation distance between the light source and the liqud level of RhB aqueous solution was 15 cm. Prior to irradiation, the RhB solution (50 mL, 5 mg·L-1) with 50 mg photocatalyst was stirred for 30 min in the dark to ensure the establishment of an adsorption-desorption equilibrium. At a certain time interval, 3 mL of the reaction solution was taken and centrifuged. The absorbances of filtrates were mea-sured on a UV-Visible spectrometer at a maximum absorption wavelength of 554 or 463 nm.
The synthetic route used to obtain the BFCTO/Au samples is illustrated in Fig. 1a. The BFCTO nano-plates' surfaces were positively charged after their modification with APTES. This enabled the uniform assembly of the negatively charged Au nanoparticles on the BFCTO nanoplate surfaces[28]. As show in Fig. 1b, the XRD patterns of the BFCTO nanoplates can be indexed by a single-phase orthorhombic lattice (B2cb space group, PDF No. 21- 0101) with no detect-able secondary phases[14]. All of the BFCTO/Au sam-ples showed XRD patterns similar to that of BFCTO, suggesting that the decoration with Au nanoparticles has no obvious influence on the BFCTO crystal struc-ture. Additionally, a weak diffraction peak appeared at 38.2° corresponding to the (111) reflection plane of Au (PDF No.04-0784). The intensity of this peak increased with increasing Au nanoparticle size[29].
According to Fig. 2a and 2g, the BFCTO displayed well-defined shape of nanoplate. The edge length ranged from 80 to 350 nm with an average thickness of 25 nm. Moreover, the elemental mapping images of Bi, Fe, Co, Ti and O are shown in Fig. 2b~2f from SEM im-age in Fig. 2a. The results indicate that all the elements have quite uniform distribution over the whole imaging area. As seen from the HRTEM image in Fig. 2h, the lattice fringes with spacings of 0.273, 0.273 and 0.382 nm can be attributed to (200), (020) and (110) facets of BFCTO orthorhombic phase, respectively[12, 14]. Besides, the HRTEM image of laterally-viewed of nanosheet in Fig. 2i displayed five pseudo-perovskite layers between two bismuth oxide layers. And the inserted FFT patterns confirm the formation of well-developed single-crystalline of BFCTO.
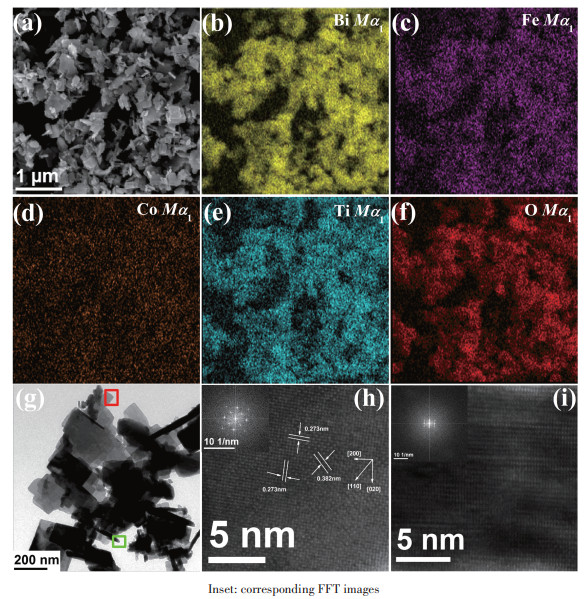
Inset: corresponding FFT images
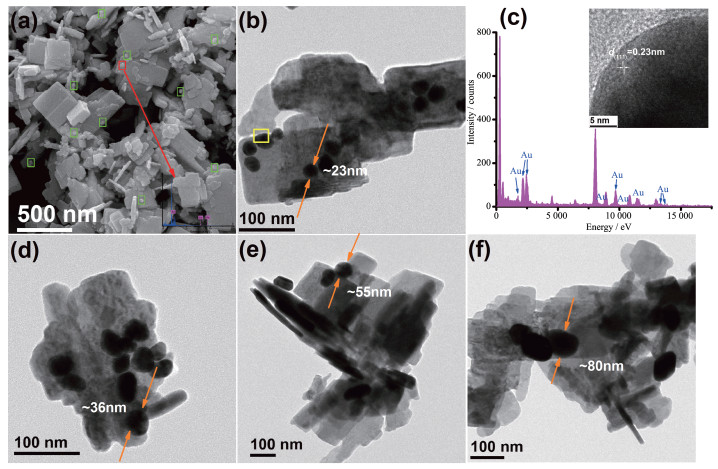
As showed in Fig. 3, the morphology of all BFCTO/ Au samples was investigated by SEM, TEM and HR-TEM characterizations. Fig. 3a and 3b display the Au nanoparticles with the size of~23 nm assembled on the BFCTO nanoplate surface. In Fig. 3a, the Au nanoparti-cles are marked by green rectangles, and the corre-sponding EDS spectrum that detected the Au element content is shown in the inset of Fig. 3a. An examination of the TEM image presented in Fig. 3b further proved that the Au nanoparticles with the size of ~23 nm were deposited on the BFCTO nanoplates. The EDS spec-trum presented in Fig. 3c provided the information about the elemental compositions of the BFCTO/Au (~23 nm) nanocomposites marked by the yellow rectan-gle in Fig. 3b, demonstrating the presence of Au in the nanocomposites. The HRTEM image presented in the inset in Fig. 3c shows the lattice spacings of 0.23 nm for the (111) plane of Au nanoparticles[30-31]. Additional-ly, the obtained TEM images (Fig. 3d~3f) revealed the morphology of other Au nanoparticles with various sizes (~36 nm, ~55 nm and ~80 nm) deposited on the BFCTO nanoplates. The SEM, TEM and HRTEM results presented in Fig. 3 confirm that Au nanoparti-cles with various sizes were deposited on the surfaces of the BFCTO nanoplates.
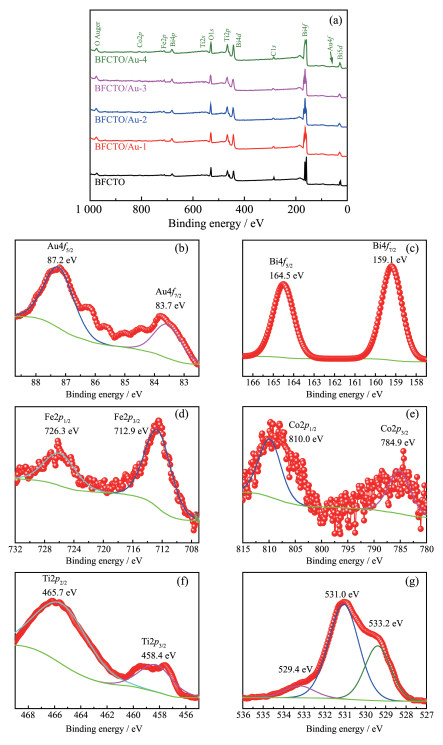
To determine the chemical state of elements and the surface defects, XPS analysis was carried out on all samples and the results are shown in Fig. 4. The obtained binding energies in XPS analysis were cor-rected by specimen charging which was executed by referencing the C1s line to 284.5 eV. Comparison of the XPS spectra presented in Fig. 4a to the full survey spectrum of BFCTO shows that Au, Bi, Fe, Co, Ti and O are present in the BFCTO/Au samples. For the Au XPS spectrum presented in Fig. 4b, two significant binding energy peaks at 83.7 and 87.2eV were observed corresponding to the Au4f7/2 and Au4f5/2 electronic states, respectively, indicating that the Au NPs exist in the metallic state[32]. Additionally, it was observed in XPS spectrum of O (Fig. 4g) that the O1s peak can be divided into three different peaks at about 533.2, 531.0 and 529.4 eV, indicating the co-existence of three dif-ferent chemical states of the oxygen atoms on this sur-face. The main peak at 531.0 eV is attributed to the Ti-O bonds, the small peak at 529.4 eV is assigned to the Bi -O bonds, and the peak at 533.2 eV may be due to the oxygen adsorbed on the surface[33-35]. Besides, as shown in (Fig. 4c~4f), the peaks of Bi4f5/2 and Bi4f7/2, Fe2p1/2 and Fe2p3/2, Co2p1/2, and Co2p3/2 and Ti2p1/2 and Ti2p3/2 suggest that Bi, Fe, Co and Ti are +3, +3, +3 and +4 valence states, respectively[36-39].
The optical properties of all samples were investi-gated using UV-Vis-NIR absorption spectra. As shown in Fig. 5a, the BFCTO sample absorbed light in the visi-ble range due to the Fe and Co dopant ions. Additional-ly, the color photos of all samples were shown in the inset in Fig. 5a. The BFCTO sample was yellow. As the Au nanoparticle size decreased, the color of BFCTO/ Au samples gradually became darker. More important-ly, compared to BFCTO, all of the BFCTO/Au samples showed an enhanced, red-shifted and broadened ab-sorption in the visible light region that generally can be ascribed to the following reasons: as the Au nanoparticles size is increased, the SPR peak has a red-shift[40-42]; the strong plasmon coupling effect among the neighboring Au nanoparticles can result in broaden SPR peak[43-45]; the strong interaction between BFCTO and Au nanoparticels may alter the SPR fea-ture due to the change in the dielectric property of the surrounding microenvironment[46]. Meanwhile, after the decoration with Au nanoparticles, the band gap (Eg) energies of all BFCTO/Au samples decreased com-pared with BFCTO nanoparticles (Eg=2.410 eV). Inter-estingly, with increase of Au nanoparticles size, the Eg values gradually increased. The obtained Eg were 2.316, 2.333, 2.357 and 2.369 eV for BFCTO/Au-1, BFCTO/Au-2, BFCTO/Au-3 and BFCTO/Au-4, respec-tively (Fig. 5b).
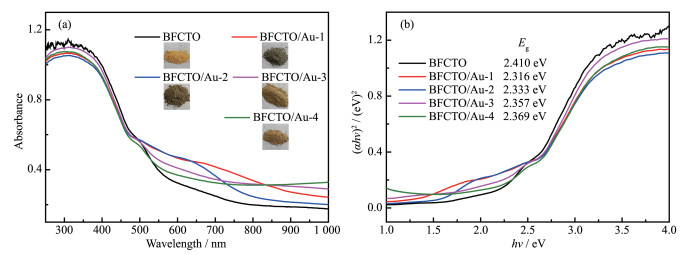
Inset: optical photos of the samples
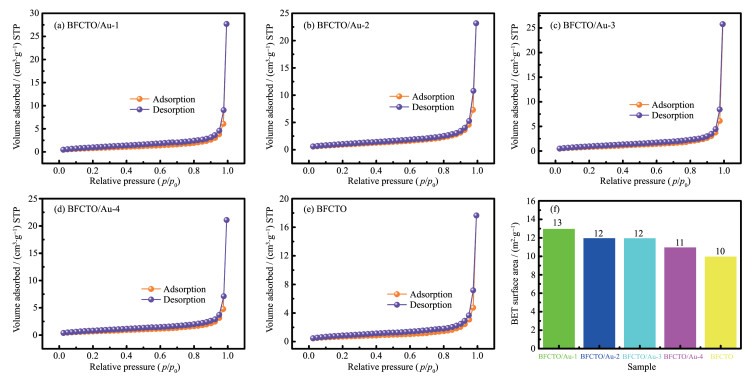
The N2 adsorption-desorption isotherms and BET specific surface areas (SBET) of different samples are showed in Fig. 6. The isotherms of samples showed that the samples had stronger interaction with N2 at the low-er pressure region. And the hysteresis loops were pre-sented at higher pressure region for all catalysts. Fur-thermore, the calculated SBET were 13, 12, 12, 11 and 10 m2·g-1 for BFCTO/Au-1, BFCTO/Au-2, BFCTO/ Au-3, BFCTO/Au-4 and BFCTO samples, respectively (Fig. 6f). Apparently, after combining the Au nanoparti-cles with BFCTO, the SBET of BFCTO/Au system increased. However, with increase of Au nanoparticles size, the SBET of BFCTO/Au samples decreased gradual-ly, which was related to its morphological characters as depicted in TEM image (Fig. 3).
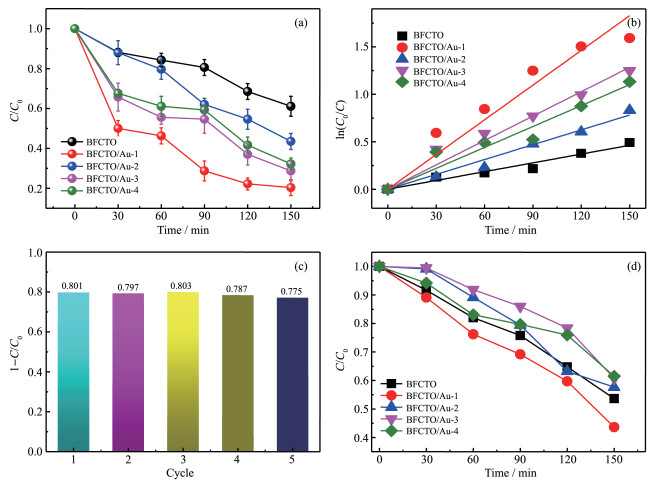
The photocatalytic activities of BFCTO and all BFCTO/Au samples were investigated by the photodeg-radation of RhB under visible light, which was a typi-cal organic azo-dye pollutant in the textile industry. Fig. 7a shows the RhB degradation efficiency curves as a function of the irradiation time for all samples. It is clear that the photocatalytic activity increases with the increasing amount of the Au nanoparticles introduced into the BFCTO nanoplates; thus, for all samples, the photocatalytic activity was enhanced relative to pris-tine BFCTO. The BFCTO/Au-1 sample exhibited the strongest photocatalytic activity under visible light irra-diation for 150 min, and the photocatalytic activities of all of the samples followed the order of BFCTO/Au-1 (80.1%) > BFCTO/Au-3(71.3%) > BFCTO/Au-4 (67.8%) > BFCTO/Au-2 (56.5%) > BFCTO (38.9%). Meanwhile, the calculated values of the apparent rate constants (kapp) for all of the samples are displayed in Fig. 7b. The order of the calculated kapp values for all samples was: BFCTO/Au-1 (0.012 18 min-1) > BFCTO/ Au-3 (0.008 55 min-1) > BFCTO/Au-4 (0.007 34 min-1) > BFCTO/Au-2 (0.005 21 min-1) > BFCTO (0.003 09 min-1). It is clear that the BFCTO/Au -1 nanocomposite shows the highest photodegradation rate. This phenomenon may be attributed to the following reasons. Firstly, as shown in Fig. 6, the BFCTO/Au-1 sample has the larg-est specific surface area. This provides sufficient inter-facial area for the adsorption of RhB molecules. More-over, the large specific surface area increases the num-ber of active sites and promotes the separation efficien-cy of the electron-hole pairs in photocatalytic reac-tions. Secondly, the SPR effect of Au nanoparticles enhances visible light absorption, improving the photo-catalytic performance. Thirdly, the decorated Au nanoparticles promote the generation and migration of the photogenerated hot electrons due to the formation of a Schottky barrier between the Au nanoparticles and BFCTO[2, 5, 23, 47-50]. As depicted in Fig. 7c, no obvious de-cay for photocatalytic decomposition of RhB after five cycles can be found, indicating the good durability and stability of BFCTO/Au-1. Besides, as shown in Fig. 7d, the photocatalytic activities of all samples were also tested by the photodegradation of MO under visible light. Obviously, the photodegradation efficiency of MO was not as good as RhB.
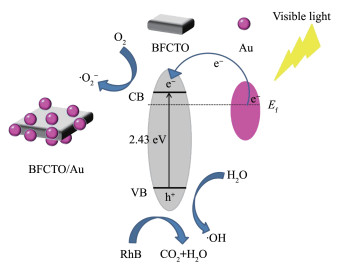
Based on the above characterization and analysis results, a possible mechanism was proposed for the enhancement in photocatalytic activity of BFCTO/Au (Fig. 8). Because of SPR effect, the visible light absorp-tion of BFCTO/Au samples enhanced. Therefore, under visible light illumination, both of BFCTO and Au nanoparticles can be photoexcited to generate photoin-duced carriers[19-22]. Besides, the PL spectrum showed in Fig. S1 (Supporting information) reveals the separa-tion and recombination of photo-generated elec-tron-hole pairs of photocatalysts. Clearly, when Au nanoparticles are on the surface of the BFCTO, the PL intensity decreases significantly, indicating lower recombination rate of photo-electrons and holes pairs[23-24]. By overcoming Schottky barrier, plasmonic excited hot electron of Au nanoparticle is injected to the conduction band (CB) of BFCTO. Thus, the more electrons in the CB of BFCTO can react with O 2 to pro-duce ·O2-. Simultaneously, the photogenerated holes in the valence band (VB) of BFCTO can directly oxidize H2O to yield ·OH. As a result, the photocatalytic per-formance can be effectively enhanced by loading Au nanoparticles on BFCTO[51-52].
In summary, we have successfully fabricated visible-light-absorbing BFCTO/Au nanocomposites for the first time. The introduction of Au nanoparticles with different sizes into BFCTO nanoplates enhances the photocatalytic activity with the BFCTO/Au-1 sam-ple exhibiting the highest photocatalytic activity.
Acknowledgements: This research was funded by the Na-tional Natural Science Foundation of China (Grants No.21701140, 51262032), the Guiding Program of Scientific Re-search Fund of Yunnan Education Department (Grant No. 2017ZDX049), the Program for Innovative Research Team (in Science and Technology) in University of Yunnan Province and the Doctor Start-up Foundation of Yunnan Normal Universi-ty (No.2016zb001).
Supporting information is available at http://www.wjhxxb.cn
Zhang P, Lou X W. Adv. Mater., 2019, 31(29):1900281 doi: 10.1002/adma.201900281
Li A, Zhu W J, Li C C, et al. Chem. Soc. Rev., 2019, 48(7):1874-1907 doi: 10.1039/C8CS00711J
Gao S, Gu B, Jiao X, et al. J. Am. Chem. Soc., 2017, 139(9):3438-3445 doi: 10.1021/jacs.6b11263
Wang J Y, Cui Y, Wang D. Adv. Mater., 2019, 31(38):1801993 doi: 10.1002/adma.201801993
Zhang P, Wang T, Gong J L. Adv. Mater., 2015, 27(36):5328-5342 doi: 10.1002/adma.201500888
Li W, He S A, Ma Q, et al. Appl. Surf. Sci., 2019, 491:395-404 doi: 10.1016/j.apsusc.2019.06.161
Zhang R, Han Q, Li Y, et al. J. Mater. Sci., 2019, 54(22):14157-14170 doi: 10.1007/s10853-019-03883-0
Zhao H P, Li G F, Tian F, et al. Chem. Eng. J., 2019, 366:468-479 doi: 10.1016/j.cej.2019.02.088
Li H Y, Sun Y J, Cai B, et al. Appl. Catal. B, 2015, 170:206-214
Liu D, Yao W Q, Wang J, et al. Appl. Catal. B, 2015, 172:100-107
Li H P, Hou W G, Tao X T, et al. Appl. Catal. B, 2015, 172:27-36
Naresh G, Mandal T K. ACS Appl. Mater. Interfaces, 2014, 6(23):21000-21010 doi: 10.1021/am505767c
Zuo X Z, Yang J, Yuan B, et al. RSC Adv., 2014, 4(87):46704-46709 doi: 10.1039/C4RA06843B
Yuan B, Yang J, Chen J, et al. Appl. Phys. Lett., 2014, 104(6):062413 doi: 10.1063/1.4865422
Sun S M, Wang W Z, Xu H L, et al. J. Phys. Chem. C, 2008, 112(46):17835-17843 doi: 10.1021/jp807379c
Hou D, Luo W, Huang Y, et al. Nanoscale, 2013, 5(5):2028-2035 doi: 10.1039/c2nr33750a
Li X N, Ju Z, Li F, et al. J. Mater. Chem. A, 2014, 2(33):13366-13372 doi: 10.1039/C4TA01799D
Ge W, Fu Z P, Li X N, et al. RSC Adv., 2015, 5(67):54165-54170 doi: 10.1039/C5RA07435E
Zhu W, Liu P J, Xiao S N, et al. Appl. Catal. B, 2015, 172:46-51
Jiao J Q, Wei Y C, Zhao Z, et al. Catal. Today, 2015, 258:319-326 doi: 10.1016/j.cattod.2015.01.030
Zhu G Q, Que W X, Zhang J. J. Alloys Compd., 2011, 509(39):9479-9486 doi: 10.1016/j.jallcom.2011.07.046
Zeng H B, Cai W P, Liu P S, et al. ACS Nano, 2008, 2(8):1661-1670 doi: 10.1021/nn800353q
Liu Y, Zhu G, Gao J, et al. Appl. Catal. B, 2017, 200:72-82 doi: 10.1016/j.apcatb.2016.06.069
Li N, Wu J J, Fang H B, et al. Appl. Surf. Sci., 2018, 448:41-49 doi: 10.1016/j.apsusc.2018.04.066
Zhao X X, Yang H, Cui Z M, et al. J. Mater. Sci.-Mater. Elec-tron., 2019, 30(14):13785-13796 doi: 10.1007/s10854-019-01762-7
Gu W, Zhang W, Zhu L Y, et al. Mater. Lett., 2019, 241:115-118 doi: 10.1016/j.matlet.2019.01.059
Frens G. Nature, 1973, 241:20-22
Xua J, Yang W M, Huang S J, et al. Nano Energy, 2018, 49:363-371 doi: 10.1016/j.nanoen.2018.04.048
Zou A L, Qiu Y, Yu J J, et al. Sens. Actuators B, 2016, 227:65-72 doi: 10.1016/j.snb.2015.12.023
Nikoobakht B, El-Sayed M A. Chem. Mater., 2003, 15(10):1957-1962 doi: 10.1021/cm020732l
Zheng Z, Tachikawa T, Majima T. J. Am. Chem. Soc., 2014, 136(19):6870-6873 doi: 10.1021/ja502704n
Tian C, Mao B, Wang E, et al. J. Phys. Chem. C, 2007, 111(9):3651-3657 doi: 10.1021/jp067077f
Li Y, Dang L, Han L, et al. J. Mol. Catal. A:Chem., 2013, 379:146-151 doi: 10.1016/j.molcata.2013.08.001
Wang B X, An W J, Liu L, et al. RSC Adv., 2015, 5(5):3224-3231 doi: 10.1039/C4RA12172D
Yu H G, Cao G Q, Chen F, et al. Appl. Catal. B, 2014, 160:658-665
Huang Y C, Li H B, Balogun M S, et al. ACS Appl. Mater. Interfaces, 2014, 6(24):22920-22927 doi: 10.1021/am507641k
Carver J C, Schweitzer G K, Carlson T A. J. Chem. Phys., 1972, 57:973-982 doi: 10.1063/1.1678348
Chen T, Li Z A, Chen J F, et al. CrystEngComm, 2016, 18(39):7449-7456 doi: 10.1039/C6CE00436A
Ren W, Ai Z, Jia F, et al. Appl. Catal. B, 2007, 69:138-144 doi: 10.1016/j.apcatb.2006.06.015
Eustis S, El-Sayed M A. Chem. Soc. Rev., 2006, 35(3):209-217 doi: 10.1039/B514191E
Hu M, Chen J Y, Li Z Y, et al. Chem. Soc. Rev., 2006, 35(11):1084-1094 doi: 10.1039/b517615h
Rycenga M, Cobley C M, Zeng J, et al. Chem. Rev., 2011, 111(6):3669-3712 doi: 10.1021/cr100275d
Kinnan M K, Chumanov G. J. Phys. Chem. C, 2010, 114(16):7496-7501 doi: 10.1021/jp911411x
Ghosh S K, Pal T. Chem. Rev., 2007, 107(11):4797-4862 doi: 10.1021/cr0680282
Wiley B, Sun Y G, Xia Y N. Acc. Chem. Res., 2007, 40(10):1067-1076 doi: 10.1021/ar7000974
Manna G, Bose R, Pradhan N. Angew. Chem. Int. Ed., 2014, 53(26):6743-6746 doi: 10.1002/anie.201402709
Kelly K L, Coronado E, Zhao L L, et al. J. Phys. Chem. B, 2003, 107(3):668-677 doi: 10.1021/jp026731y
Cheng X F, Gondal M A, Al-Saadi A A, et al. J. Colloid Interface Sci., 2012, 377:291-298 doi: 10.1016/j.jcis.2012.03.021
Lv H L, Ji G B, Yang Z H, et al. J. Colloid Interface Sci., 2015, 450:381-387 doi: 10.1016/j.jcis.2015.03.038
Quan B, Liu W, Liu Y S, et al. J. Colloid Interface Sci., 2016, 481:13-19 doi: 10.1016/j.jcis.2016.07.037
Subramanian V, Wolf E E, Kamat P V. J. Am. Chem. Soc., 2004, 126(15):4943-4950 doi: 10.1021/ja0315199
Kale M J, Avanesian T, Christopher P. ACS Catal., 2014, 4(1):116-128 doi: 10.1021/cs400993w

Figure 1 (a) Schematic diagram of synthesis procedure used to obtain BFCTO/Au nanocomposites; (b) XRD patterns of the samples

Figure 2 (a) SEM image for BFCTO; (b~f) EDS mapping images of Bi, Fe, Co, Ti, O elements, respectively; (g) TEM image for BFCTO and (h, i) HRTEM images taken from (g) indicated by red and green rectangle, respectively
Inset: corresponding FFT images

Figure 3 (a) SEM and (b) TEM images of BFCTO/Au-1 nanocomposites; (c) EDS spectra of Au nanoparticle marked by the yellow rectangle in (b) and corresponding HRTEM image of Au nanoparticle (Inset); (d) TEM images of BFCTO/Au-2 (e) BFCTO/Au-3 and (f) BFCTO/Au-4 nanocomposites

Figure 4 (a) Full scan XPS spectra of all samples; (b) Au4f, (c) Bi4f, (d) Fe2p, (e) Co2p, (f) Ti2p and (g) O1s XPS spectra of BFCTO/Au-4 nanocomposite

Figure 5 (a) UV-Vis diffuse reflectance spectra of the samples; (b) Relationships between (αhν)2 and photon energy (hν) for the samples
Inset: optical photos of the samples

Figure 6 (a~e) N2 adsorption-desorption isotherms of various samples; (f) BET specific surface areas for various samples

Figure 7 (a) Photocatalytic RhB degradation curves in the presence of BFCTO and all of the BFCTO/Au samples under visible light irradiation; (b) Corresponding kinetic linear simulation curves of RhB under visible irradiation for the samples; (c) Cyclic photocatalytic degradation experiments of RhB by BFCTO/Au-1 under the visible light irradiation; (d) Photocatalytic methyl orange (MO) degradation curves for the samples

 扫一扫看文章

扫一扫关注我们
 下载:
下载:
 下载:
下载:
