Figure 1.
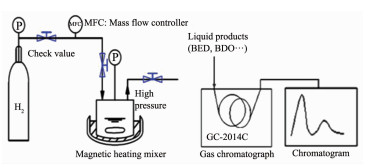
Scheme profile of the evaluation device for BED hydrogenation

Selective hydrogenation of C=C to C-C is of importance to produce valuable or fine chemicals. 1, 4-butanediol (BDO) is one of the widely used chemical raw materials, which is used to produce polybutylene terephthalate (PBT), tetrahydrofuran (THF), γ-butylla-ctone (GBL), polyurethane thermoplastic elastomer and fiber[1-3]. Demanding of BDO would continue to grow because of the widely used of it and its deriva-tives. High pressure hydrogenation process, which is easy to cause safety problems, has long been adopted to produce BDO in industry. While it has become the focus of researchers to explore the hydrogenation process under low pressure by improving catalyst component and structure[4]. Hydrogenation process of 1, 4-butenediol (BED) is commonly accompanied with side reactions, including double bond migration, hydrogenolysis, isomerization, to form 4-hydroxybutanal (HALD), THF, 1-ene-3-octanol (C8H16O, EO), 2-hydro-xytetrahydrofuran (HTHF) and 2-(4-hydroxybutoxy)-tetrahydrofuran (HBOTHF). Therefore, well tuneable hydrogenation performance of BED to BDO is crucial for industrial application. And the common used catalyst for BDO production from BED is Raney-Ni.
Raney-Ni catalyst has long been widely used since 1925. Compared with precious metal catalysts, Raney-Ni was thought as a relatively inexpensive and cost-effective catalyst[5]. It has been developed into a class of widely used catalysts in the production of sorbitol, methyl-ethanone, aliphatic amine, hydrogen peroxide, spices, hexylenediamine and other products[6-8]. In addition, Raney-Ni catalyst has the advantages of simple preparation, well heat conduction, high activity and strong stability[9].
Lei et al.[10] found that the activity of Raney-Ni catalyst prepared by fast setting technology was 5 times higher than the catalyst by traditional methods. DuPont reported that alkali leaching of 35%~66%(w/w)Ni/40%~65%(w/w) alloy was used to obtain skeleton Raney-Ni catalyst with a certain ratio of Ni to Al, which showed excellent hydrogenation performance. US patent[11] showed that 3%~25%(w/w) Cu was introduced into Raney-Ni catalyst to prepare Cu-modified Raney-Ni catalyst. The catalyst was applied to the hydro-genation of BED. The activity and selectivity of the catalyst were determined under the temperature of 20~140 ℃ and hydrogen pressure of 0~2 MPa. In addition, Raney-Ni-Mo catalyst were developed, which were evaluated by hydrogenation of 1, 4-butynediol (BYD) to produce BDO[12]. Therefore, the modified Raney-Ni catalyst could improve the distribution of active components, crystal structure, pore structure, surface morphology and surface acidity of the catalyst.
Generally, catalyst hydrogenation performance is related to its mechanical strength, carbon deposition resistance[13], nickel content[14], promoter type and amount[15-16], preparation method[17] and so on. Raney-Ni presented well performance in hydrogenation, dehydrogenation, dehalogenation and other chemical conversions due to its well heat conduction, high catalytic activity and strong stability. In the traditional BED hydrogenation process, noble mental (Ru, Pt, Pd, etc.) catalysts exhibited high catalytic activity. However, noble metals are scarce and expensive, which limit the large-scale application in industry. In order to meet the industrial demand, it is necessary to develop economical catalyst, such as Raney-Ni. It is reported that skeleton structure catalysts (catalyst prepared from an alloy) can display well catalytic properties (e.g. activity, selectivity and stability) during the hydrogenation process, which are superior to nickel-based catalysts. Xu et al.[18] investigated the effect of Raney-Ni-X (Fe, Mo, Cr) catalyst on the hydrogenation performance of glucose. Results showed that the Raney-Ni catalysts modified by Fe, Mo and Cr exhibited excellent performance. And Raney-Ni-Mo performed better stability and activity than others. On the one hand, the promoter of Mo could increase the specific surface area of Raney-Ni catalyst from 77 to 83 m2·g-1. On the other hand, the addition of Mo could prevent Ni from being oxidized. Wang et al.[19-20] investigated the effect of different additive on the hydrodeoxygenation performance of Ni-based catalysts. Results showed that Fe could significantly increase the dispersion of active component Ni and improve the activity. Effect of Mo on the hydrogenation performance of Ni-based catalyst was also observed. The results proposed that the metal-Mo not only improved the dispersion of Ni, but also enhanced the interaction force between Mo and the carrier. In summary, the additive could change catalyst structure and affect its performance[21-23]. In addition, the application of Mg, Cu and Co modified catalysts was beneficial to hydrogenation.
In this paper, the modified Ni-Al alloy powder by metal promoter was prepared by impregnation method, and leached by NaOH solution (10%(w/w)) to remove Al to obtain Raney-Ni catalyst. And the catalysts were characterized by energy dispersive X-ray (EDX), X-ray diffraction (XRD), N2 adsorption-desorption, trans-mission electron microscope (TEM), NH3 temperature programmed desorption (NH3-TPD) and X-ray photo-electron spectroscopy (XPS) methods. Effect of Mg, Cu and Co on the structure of Ni-Al alloy and the corresponding Raney-Ni catalyst and its hydrogenation performance of BED were investigated.
The modified Ni-Al alloy powder was prepared by impregnation method. Commercial Ni-Al powder (100~120 mesh) was added to nitrate solution of different metal. The above mixture was put in ultrasonic machine for 0.5 h, stirred for 0.5 h, impregnated for 24 h, dried at 110 ℃ for 4 h and calcinated at 450 ℃ for 3 h in a muffle furnace, and the modified Ni-Al alloy powder could be obtained. The prepared alloys were labeled as RNMg, RNCu and RNCo according to the added promoter. The commercial Ni-Al alloy powder was marked as RN. Prepared Ni-Al alloys were leached by 10%(w/w) NaOH solution at 80 ℃ for 90 min, and the mixture was washed with anhydrous ethanol for several times, then Raney-Ni catalysts were obtained. The synthesized catalysts were correspondingly labeled as CRN, CRNMg, CRNCu and CRNCo.
X-ray diffraction (XRD) analysis was carried out on an X-ray diffraction (Rigaku D/Max-2500, Japan) using nickel filtered Cu Kα (λ=0.154 06 nm) radiation. The scan rate, diffraction range, tube voltage and tube current were 8°·min-1, from 5° to 85°, 40 kV and 100 mA, respectively. N2 adsorption-desorption profiles at -196 ℃ were obtained by a Quantachrome Automated Gas Sorption apparatus (Micromeritics ASAP 2020). Energy dispersive X-ray (EDX) analysis was carried out on LEO 1530VP spectrometer from Germany with accelerating voltage of 20 kV, working distance of 15 mm and acquisition time of 120 s. Transmission electron microscopy (TEM) micrograph was obtained using a JEOL JEM-2100 election microscope operating at 200 kV. Acidic properties of the catalysts were measured via a temperature-programmed desorption of ammonia (NH3-TPD) using a Quantachrome Chemisorb instrument. The chemical states of the catalysts were analyzed by X-ray photoelectron spectroscopy (XPS) using a Thermo Scientific instrument and Kα surface analysis.
BED hydrogenation was conducted in a 50 mL high-pressure reactor (Dalian Tongda reactor factory, CJF-605, China), and the liquid products were analyzed using a gas chromatography (GC-2014C, Shimadzu instrument Co. Ltd., Japan). Fig. 1 shows the schematic setup of hydrogenation and product analysis system. BED hydrogenation was carried out at 120 ℃ under 5.0 MPa for 3 h, with stirring rate of 400 r·min-1 and catalyst addition of 0.4 g. The feedstock was 30 mL aqueous solution containing 35%(w/w) BED.
BDO, BED, butyric anhydride (BA) and THF were the main substances in the catalytic hydrogenation product of BED, which were detected by SH-Rtx-Wax capillary column. The performance of hydrogenation catalyst was evaluated by BED conversion (X), BDO selectivity (S) and yield (Y), which can be calculated by equation (1), (2) and (3), respectively.
Performance of the catalyst:
|
$ X=1-C_{3} /\left(C_{1}+C_{2}+C_{3}+C_{4}\right) \times 100 \% $ |
(1) |
|
$ S=C_{2} /\left(C_{1}+C_{2}+C_{4}\right) \times 100 \% $ |
(2) |
|
$ Y=X \times S \times 100 \% $ |
(3) |
where Ci represent the molar percentage of the corresponding substance; i=1, 2, 3 and 4 representing components BED, BDO, BA and THF, respectively.
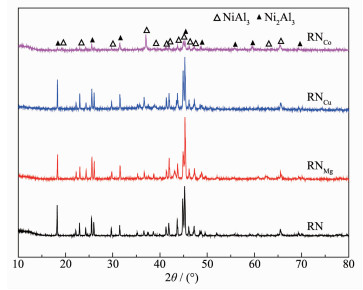
Fig. 2 shows the XRD patterns of alloy powders modified with different additives. All the samples were composed of two crystals (Ni2Al3 and NiAl3). The diffraction peak positions of Ni2Al3 was located at 2θ=18.0°, 25.5°, 31.4°, 45.2°, 48.8°, 55.9°, 59.4° and 69.5°. The peak positions of NiAl3 was detected at 2θ=19.2°, 23.0°, 29.7°, 37.1°, 38.8°, 41.4°, 41.9°, 43.7°, 44.9°, 46.4°, 47.3°, 62.7° and 65.5°. The diffraction peak positions of NiAl3 and Ni2Al3 were the same for each modified alloy, while the intensity and the half-peak width were quite different. The intensity of NiAl3 and Ni2Al3 was significantly weakened with the addition of Co, and the peak shape was more dispersed, resulting in the increase of half-peak width.
The diffraction peaks of Cu, Mg and Co were not detected by XRD characterization in the modified Ni-Al alloys, indicating that the promoter of Cu, Mg and Co might be highly dispersed on the Ni-Al surface without the formation of promoter crystal.
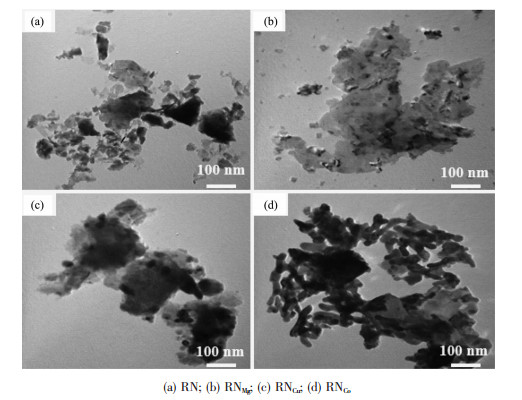
Fig. 3 gives the TEM photograph of the Ni-Al alloy. The surface morphology of all the samples was in the form of sheet-like particle. It could be clearly observed that there was many pieces for the RNMg sample, and the pieces was more concentrated and uniform than the other catalysts. Therefore, the introduction of metal could significantly make the morphology of the Ni-Al alloy powder more regular.
EDX analysis was carried out for the prepared catalysts, and the results are given in Table 1. The elements of Ni, Al, Mg, Cu and Co in all samples were found by EDX test. It could be seen from Table 1 that the CRN and CRNCu presented a high Ni/Al molar ratio (nNi/nAl), and the nNi/nAl for the two samples were 3.93, indicating that the Ni content of the sample was high with more active sites. The CRN sample showed a high Ni content of 89.53%(w/w), which was 187% higher than that of RN (48%(w/w)), demonstrating that a large amount of Al was washed away by NaOH solution during the leaching process (① Al3++4OH-→[Al(OH)4]-, ② [Al(OH)4]-→ Al(OH)3+OH-, the Al element would be transformed into hydrated alumina and precipitated in the form of aluminum hydroxide). And there is a part of Al element retained in the catalyst. The skeleton structure of the catalyst would be severely collapsed once the Al was completely leached, which might cause particle agglomeration and reduce the activity of the catalyst. Therefore, the residual amount of Al element had a significant effect on maintaining the activity of the catalyst[24-25].
 下载:
导出CSV
下载:
导出CSV
| Sample | wNi/% | wAl/% | wMg/% | wCu/% | wCo/% | nNi/nAl | DNi*/nm | |
| CRN | 89.53 | 10.47 | — | — | — | 3.93 | 0.232 | |
| CRNMg | 79.34 | 19.32 | 1.35 | — | — | 1.89 | 0.254 | |
| CRNCu | 87.97 | 10.29 | — | 1.74 | — | 3.93 | 0.280 | |
| CRNCo | 79.56 | 18.69 | — | — | 1.75 | 1.96 | 0.297 | |
| *Calculated by Scherrer formula at 2θ angles of Ni (111) | ||||||||
The relative content of the three promoters was between 1.35% and 1.75%, while the corresponding MyOx content of each catalyst was calculated to be about 2.3%(w/w). More active component-Ni was detected in the sample CRNCu, about 90%(w/w), higher than CRNMg and CRNCo (about 80%(w/w)), indicating that there were more active sites on the surface of the CRNCu catalyst. According to the principle of EDX method, the content of Ni element on the surface of the catalyst can only be measured at nanometer thickness. With the addition of Co, Cu and Mg, the distribution of the active component Ni on the catalyst was changed, resulting in a great difference in the content of Ni measured.
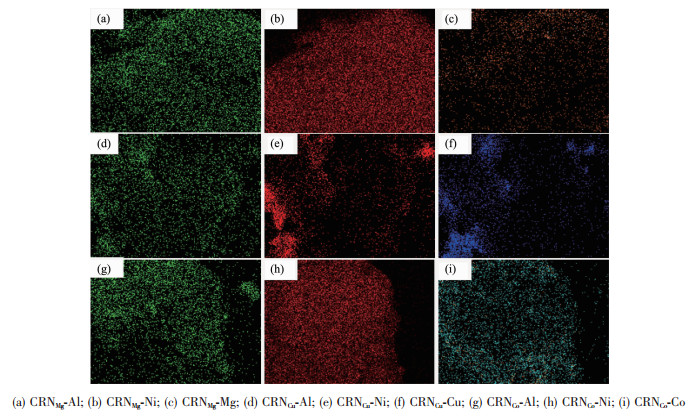
DNi calculated by Scherrer formula at 2θ angles of Ni(111) was the Ni grain size, as shown in Table 1. To observe the dispersion of each element in the catalyst, the EDX-mapping test was performed to verify the distribution of each element on the Raney-Ni catalyst surface. Fig. 4 shows the EDX-mapping diagrams of all the catalysts. It could be seen from the mapping diagrams that the Mg, Cu and Co elements were distributed on the surface of each catalyst, indicating that the Mg, Cu and Co elements in the prepared catalyst could be uniformly distributed by impregnation method. The Al element distribution on the surface of the CRNCu sample was relatively sparse, which was consistent with the small Al content of 10.29%(w/w).
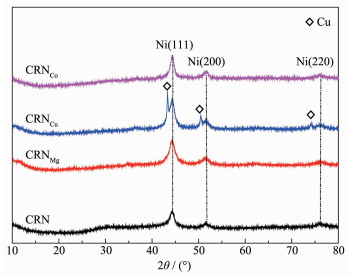
Fig. 5 gives the XRD patterns of Raney-Ni catalysts. The characteristic diffraction peaks of Ni were detected in each sample at 2θ=43.9°, 51.5° and 77.1°, corresponding to Ni(111), Ni(200) and Ni(220), respectively[26]. The diffraction peaks of the promoters of Mg and Co were not detected in Fig. 5. The reason might be that the two promoters could not form crystal or were dispersed in amorphous state on the inner and outer surfaces of the catalyst[27]. While the CRNCu catalyst presented the characteristic peaks of Cu at 2θ=43.3°, 50.4° and 74.1°. This might be derived from the reason that a large amount of H2 were produced during the leaching process of Ni-Al alloy powder, and the H2 was to act as a reducing agent to reduce CuO to Cu metal[28]. And the small Cu crystal was beneficial for improving Ni dispersion without serious sintering by the "confinement effect"[29-30]. In addition, the intensity of the diffraction peaks of Ni increased with the introduction of Mg, Cu and Co metal, indicating that the crystal size of Ni increased (Table 1).
The N2 adsorption-desorption results of the prepared catalysts are shown in Fig. 7. According to the International Union of Pure and Applied Chemistry (IUPAC) classification, it could be advised that there was H3 hysteresis loops for all the catalysts, and the isothermal adsorption lines were ascribed to type Ⅲ, indicating that the adsorption heat is smaller than the liquefaction heat[31].
Fig. 6(a) shows the N2 adsorption-desorption isotherms of Raney-Ni catalysts. CRNMg presented a large hysteresis loop, while the loop of CRNCo was small. The area of the loop of CRNMg catalyst was larger than that of CRN catalyst, while the loops area of CRNMg and CRNCu catalysts decreased.
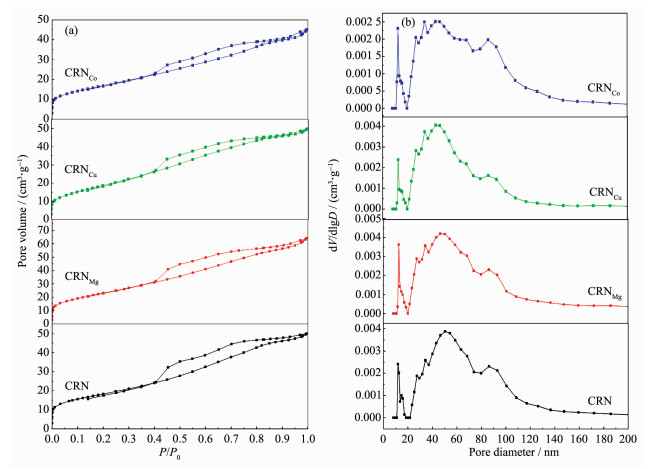
Fig. 6(b) gives the BJH (Barrett-Joyner-Halenda) pore size distributions of the catalysts. All the samples presented the pore size of 10~100 nm, and the most probable pore diameter of each sample was distributed at 12 and 50 nm, demonstrating that the four samples were ascribed to mesoporous-mesoporous multi-level material. The peak shape of each sample was nearly the same, indicating that the addition of promoter didnt obviously change the pore structure of the CRN sample.
According to N2 adsorption-desorption isotherms, the specific surface area of each sample was calculated by BET (Brunauer-Emmett-Teller) equation, and the pore volume and average pore diameter were calculated by BJH equation, as shown in Table 2. The specific surface area of all the samples was between 60 and 85 m2·g-1, pore volume of 0.05~0.1 cm3·g-1, average pore diameter of 3~5 nm. And the CRNCu catalyst presented small average pore diameter of 3.87 nm, specific surface area of 71 m2·g-1 and pore volume of 0.072 cm3·g-1.
下载:
导出CSV
| Samples | Specific surface areaa/(m2·g-1) | Pore volumeb/(cm3·g-1) | Average pore diameterc/nm |
| CRN | 66 | 0.071 | 4.29 |
| CRNMg | 85 | 0.092 | 4.32 |
| CRNCu | 71 | 0.072 | 3.87 |
| CRNCo | 61 | 0.065 | 4.44 |
| aCalculated by BET equation; bBJH desorption average pore diameter; cBJH desorption pore volume | |||
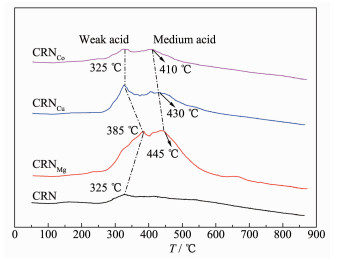
Fig. 7 gives the NH3-TPD diagram of the catalysts. Only one NH3 desorption peak was detected in CRN, and two distinct NH3 desorption peaks appeared in other catalysts. The CRN, CRNCo and CRNMg samples showed the first peak at around 325 ℃, while the peak of the CRNCu catalyst was around 385 ℃. The CRNMg catalyst showed the second NH3 desorption peak at around 445 ℃, CRNCu around 430 ℃, and CRNCo dropped to about 410 ℃, indicating that there are mainly two kinds of acid center on the surface of Raney-Ni catalyst. The former was located in the temperature of 320~390 ℃, corresponding to the weak acid center[32]. The latter was located in the temperature of 390~450 ℃, corresponding to the medium acid center[33]. The temperature of the medium acid peaks presented the following order: T > T > T. The peak temperature of the weak and medium acids were large (385 and 445 ℃) for the CRNMg catalyst. In addition, with the addition of Co, Cu and Mg promoters, the corresponding peaks area showed an increasing tendency, indicating that the number of acid centers increased.
The peak area of weak acid and medium acid was further fitted by Peakfit software, and the peak area percentage was estimated, as shown in Table 3. The percentage of peak area of the modified samples was larger than CRN, with the medium acid peak area of CRNMg catalyst of 52%. In addition, The addition of alkaline additive-Mg promoted the absorption of NH3 on the surface of Raney-Ni catalyst, resulting in strong acidity of the catalyst.
下载:
导出CSV
| Sample | Peak area proportion of the weak acid/% | Peak area proportion of the medium acid/% |
| CRN | 100 | 0 |
| CRNMg | 48 | 52 |
| CRNCu | 54 | 46 |
| CRNCo | 50 | 50 |
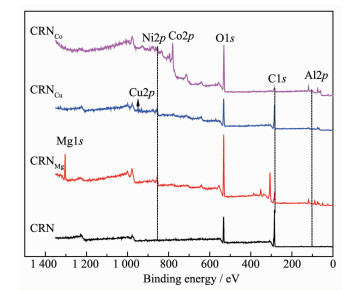
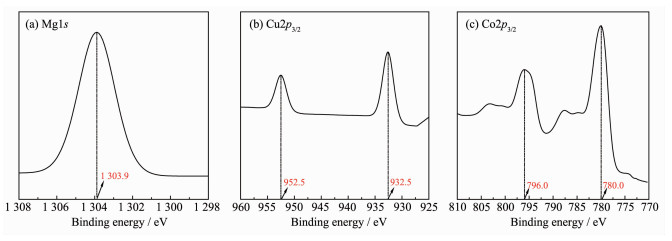
To investigate the valence state of the catalysts, all the samples were characterized by XPS test, as shown in Fig. 8. It could be found that the intensity of Ni2p peak at 856.7 eV was different for each catalyst, which might be derived from the dispersion effect caused by the addition of different promoter (Mg, Cu, Co). In addition, the peaks of promoters were detected at 1 305.2, 951.5 and 780.5 eV, respectively, which could be ascribed to Mg2p, Cu2p, and Co2p (Fig. 8). Literature showed that the peaks at 932.5 and 952.5 eV were assigned to the Cu0 / Cu+ peak and the Cu2+ peak, respectively[34].
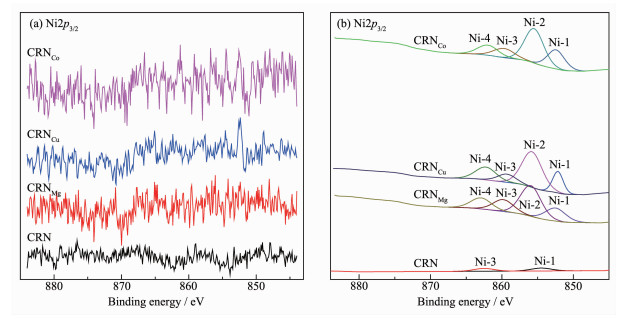
The XPS spectra of the Ni2p3/2 were shown in Fig. 9 and Table 4. Fig. 9(a) showed that the binding energy at the range of 840~890 eV were attributed to Ni2p3/2. Two Ni2p3/2 peaks (Ni2p3/2-1 and Ni2p3/2-3) in Fig. 9(b) were detected in the CRN sample, one at 854.4 eV and another at 862.2 eV, and the corres-ponding binding energy was higher than the modified catalyst, indicating that the Ni2+ in the CRN catalyst was more stable. With the addition of promoter, the binding energy of Ni2p3/2-1 and Ni2p3/2-3 peaks was decreased, which might be attributed to the calcination process at high temperature (450 ℃). The peaks of CRNCu at 852.1, 856.0, 859.3 and 862.4 eV were attributed to the Ni0 peak, Ni2+ and the corresponding satellite peaks[27], respectively. Compared with the samples without additive, the peaks of Ni0 and Ni2+ accompanied by satellite peak in each sample might be derived from the addition of the additives, causing the outer electrons of Ni to the excited state, resulting in that the photoelectrons could lose kinetic energy and show higher binding energy in the spectrum. The fitted XPS spectra of the catalysts shown in Fig. 10 showed that the CRNMg, with the addition of Mg, has only one peak, while two peaks were detected in CRNMg and CRNCo.
下载:
导出CSV
| Sample | Binding energy/eV (±0.3 eV) | |||
| Ni2p3/2-1 | Ni2p3/2-2 | Ni2p3/2-3 | Ni2p3/2-4 | |
| CRN | 854.4 | — | 862.2 | — |
| CRNMg | 852.4 | 856.1 | 859.8 | 862.9 |
| CRNCu | 852.1 | 856.0 | 859.3 | 862.4 |
| CRNCo | 852.6 | 855.6 | 859.6 | 861.8 |
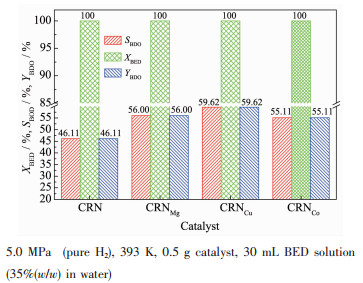
Fig. 11 shows the evaluation results of the prepared Raney-Ni catalysts for hydrogenation performance of BED. The BED conversion of each catalyst was as high as 100%. The CRNCu catalyst exhibited excellent hydrogenation selectivity, with both BDO selectivity and yield of 59.62%. According to catalyst chara-cterizations, the reason for the better performance of the CRNCu sample might be related to the following factors, such as the high nNi/nAl, the small average pore diameter (3.87 nm), the moderate number of acid sites and the small Cu crystal for improving Ni dispersion without serious sintering by the "confine-ment effect". Combined with the XRD analysis, it was mainly attributed to the interaction between Ni and Cu particles, which could effectively stabilize the small Ni particle, improving the hydrogenation activity of the catalyst. In this work, the surface acidity, the nNi/nAl and the average pore diameter are the most important factors.
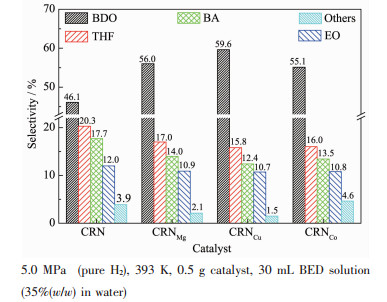
Fig. 12 shows the selectivity distribution of hydrogenation products. The selectivity of BDO, HALD, THF, EO and others species, such as HTHF, HBOTHF, were compared. Each sample had a well selectivity for BDO. It could also be seen from Fig. 12 that the selectivity of THF was high of 20% next to BDO. And the selectivity of BDO, THF, BA and EO were followed the order of BDO > THF > BA > EO.
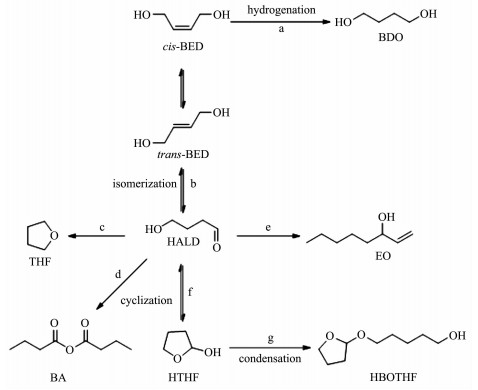
Based on previous reports[35-37] and current experi-mental results, a possible reaction pathway was proposed (Fig. 13). The raw material was a mixture of cis-BED and trans-BED, of which part was hydro-genated to obtain the target product BDO. The other part was isomerized to produce 4-hydroxybutyral-dehyde. In addition, THF, EO and BA were obtained by a series of chemical reactions. There were also a very small amount of HALD to produce 1-hydroxyl cyclobutyl ether by cyclization, and to form HBOTHF by condensation reaction.
Three promoters (MgO, CuO, Co2O3) were introduced individually into the commercial Ni-Al alloy powder by impregnation method, and the modified alloys were leached by 10%(w/w) NaOH solution to prepare Raney-Ni catalysts. The effect of different promoter on the structure of Raney-Ni catalyst and its hydrogenation performance of BED were investigated. It was found that the surface morphology, crystal structure, nNi/nAl and surface acidity of the Ni-Al alloy and the corresponding prepared catalyst was different. Evaluation results showed that the CRNCu catalyst presented well catalytic performance, with BED conversion of 100%, BDO selectivity of 59.62%, which might be related to the high nNi/nAl, the moderate amount of acid sites, the small average pore diameter (3.87 nm) and the small Cu crystal for improving Ni dispersion without serious sintering by "confinement effect".
Zhang Q, Zhang Y, Li H T. Chin. J. Catal., 2013, 34:1159-1166 doi: 10.1016/S1872-2067(12)60525-7
Ildikó M, Bodor Z, Réka S, et al. J. Biomol. Struct. Dyn., 2016, 35:1-16
Minh D P, Michèle B, Pinel C, et al. Top. Catal., 2010, 53:1270-1273 doi: 10.1007/s11244-010-9580-y
Tanielyan S, Schmidt S, Marin N, et al. Top. Catal., 2010, 53:1145-1149 doi: 10.1007/s11244-010-9550-4
Kou Z N, Zhi Z N, Xu G H, et al. Appl. Catal. A, 2013, 467:196-201 doi: 10.1016/j.apcata.2013.07.025
Amarasekara A S, Lawrence Y M, Fernandez A D, et al. Biofuels, 2018, 47:1-5
Bendova D H, Weidlich D T. Sep. Sci. Technol., 2017, 53:1-5
Luo G H, Wang Y L, Sun D M, et al. China Petroleum Processing & Petrochemical Technology, 2017, 19:14-20
Lei H, Song Z, Tan D L, et al. Appl. Catal. A, 2001, 214:69-76 doi: 10.1016/S0926-860X(01)00481-1
LEI Hao(雷浩). Dalian Institute of Chemical Physics(中国科学院大连化学物理研究所博士论文), 2003.
Hort E V, Graham D E. US Patent, 2967893. 1961-01-10.
Codignola F, Vergini G, Gronchi P, et al. US Patent, 4288641. 1981-09-18.
Michalska K, Kowalik P, Konkol M, et al. Appl. Catal. A, 2016, 523:54-60 doi: 10.1016/j.apcata.2016.05.016
Peyrovi M H, Toosi M R. React. Kinet. Catal. Lett., 2008, 94:115-119 doi: 10.1007/s11144-008-5277-7
Louloudi A, Papayannakos N. Appl. Catal. A, 2000, 204:167-176 doi: 10.1016/S0926-860X(00)00516-0
Zielinski M. Appl. Catal. A, 2012, 449:15-22 doi: 10.1016/j.apcata.2012.09.033
Savva P G, Goundani K, Vakros M, et al. Appl. Catal. B, 2008, 79:199-207 doi: 10.1016/j.apcatb.2007.10.023
徐雷金, 孔令鸟, 刘维, 等.化工生产与技术, 2013, 20:36-41 doi: 10.3969/j.issn.1006-6829.2013.06.010XU Lei-Jin, KONG Ling-Niao, LIU Wei, et al. Chemical Production and Technology, 2013, 20:36-41 doi: 10.3969/j.issn.1006-6829.2013.06.010
Wang X F, Wang F, Chen M Y, et al. J. Fuel Chem. Technol., 2005, 33:612-616
Huo L F, Wang X F, Hou X Y, et al. J. Fuel Chem. Technol., 2007, 35:595-598
Han X, Zhou R, Lai G H, et al. Catal. Today, 2004, 93:433-437
Li Y, Zhou R X, Lai G H. React. Kinet. Catal. Lett., 2006, 88:105-110 doi: 10.1007/s11144-006-0116-1
Xue J, Cui F, Huang Z W, et al. Chin. J. Catal., 2012, 33:1642-1649 doi: 10.1016/S1872-2067(11)60434-8
Tümer H V, Feuge R O, Cousins E R. J. Am. Oil Chem. Soc., 1964, 41:212-214 doi: 10.1007/BF03024651
Knies S, Berweiler M, Panster P, et al. Stud. Surf. Sci. Catal., 2000, 130:2249-2254 doi: 10.1016/S0167-2991(00)80803-4
Chai M Q, Liu X Y, Li L, et al. Chin. J. Catal., 2017, 38:1338-1346 doi: 10.1016/S1872-2067(17)62869-9
Cai B, Zhou X C, Miao Y C, et al. ACS Sustainable Chem. Eng., 2017, 5:1322-1331 doi: 10.1021/acssuschemeng.6b01677
Baijot V, Mehdi D R, Rossi C, et al. Combust. Flame, 2017, 180:10-19 doi: 10.1016/j.combustflame.2017.02.031
Bian Z, Kawi S. ChemCatChem, 2017, 10:320-328
Jiang B, Zhang C, Wang K Q, et al. Appl. Therm. Eng., 2016, 109:99-108 doi: 10.1016/j.applthermaleng.2016.08.041
方洁, 李娜, 成浪, 等.燃料化学学报, 2019, 47:725-736 doi: 10.3969/j.issn.0253-2409.2019.06.010FANG Jie, LI Na, CHENG Lang, et al. Journal of Fuel Chemistry and Technology, 2019, 47:725-736 doi: 10.3969/j.issn.0253-2409.2019.06.010
Annette T, Bernd H. Top. Catal., 2002, 19:215-223 doi: 10.1023/A:1015324425793
Stanciulescu M, Bulsink P, Caravaggio G, et al. Appl. Surf. Sci., 2014, 300:201-207 doi: 10.1016/j.apsusc.2014.01.175
Wang D, Zhang Y, Li H T. J. Catal., 2012, 33:1229-1235
Tanielyan S K, Santosh R M, Augustine R L, et al. Org. Process Res. Dev., 2017, 21:327-335 doi: 10.1021/acs.oprd.6b00375
Chaudhari R V, Jaganathan R, Kolhe D S, et al. Appl. Catal. A, 1987, 29:141-159 doi: 10.1016/S0166-9834(00)82613-5
Telkar M M, Rode C V, Rane V H, et al. Appl. Catal. A, 2001, 216:13-22 doi: 10.1016/S0926-860X(01)00547-6

Figure 6 N2 adsorption-desorption isotherms (a) and pore size distribution curves (b) of the catalysts
Table 1. Element content, Ni crystal size of the catalysts
| Sample | wNi/% | wAl/% | wMg/% | wCu/% | wCo/% | nNi/nAl | DNi*/nm | |
| CRN | 89.53 | 10.47 | — | — | — | 3.93 | 0.232 | |
| CRNMg | 79.34 | 19.32 | 1.35 | — | — | 1.89 | 0.254 | |
| CRNCu | 87.97 | 10.29 | — | 1.74 | — | 3.93 | 0.280 | |
| CRNCo | 79.56 | 18.69 | — | — | 1.75 | 1.96 | 0.297 | |
| *Calculated by Scherrer formula at 2θ angles of Ni (111) | ||||||||
 下载: 导出CSV
Table 2. Specific surface area, pore volume, average pore diameter of the catalysts
| Samples | Specific surface areaa/(m2·g-1) | Pore volumeb/(cm3·g-1) | Average pore diameterc/nm |
| CRN | 66 | 0.071 | 4.29 |
| CRNMg | 85 | 0.092 | 4.32 |
| CRNCu | 71 | 0.072 | 3.87 |
| CRNCo | 61 | 0.065 | 4.44 |
| aCalculated by BET equation; bBJH desorption average pore diameter; cBJH desorption pore volume | |||
下载: 导出CSV
Table 3. Peak area proportion of weak acid and medium acid
| Sample | Peak area proportion of the weak acid/% | Peak area proportion of the medium acid/% |
| CRN | 100 | 0 |
| CRNMg | 48 | 52 |
| CRNCu | 54 | 46 |
| CRNCo | 50 | 50 |
下载: 导出CSV
Table 4. Binding energy of Ni2p3/2 of the catalysts
| Sample | Binding energy/eV (±0.3 eV) | |||
| Ni2p3/2-1 | Ni2p3/2-2 | Ni2p3/2-3 | Ni2p3/2-4 | |
| CRN | 854.4 | — | 862.2 | — |
| CRNMg | 852.4 | 856.1 | 859.8 | 862.9 |
| CRNCu | 852.1 | 856.0 | 859.3 | 862.4 |
| CRNCo | 852.6 | 855.6 | 859.6 | 861.8 |
下载: 导出CSV

 扫一扫看文章

扫一扫关注我们