Table 1.
Composition of salt lake brine mg·L-1
Citation:
FU Yu-Yao, YANG Xi-Yun, HUANG Hai-Qiang, WANG Yuan-Yuan, LI Ji-Shen. Role of Process Parameters on Phase Purity of o-LiMnO2 and Synthesis of Li1.6Mn1.6O4 as Lithium Ion-Sieve[J]. Chinese Journal of Inorganic Chemistry,
2020, 36(3): 536-546.
doi:
10.11862/CJIC.2020.038

工艺参数对o-LiMnO2相纯度及Li1.6Mn1.6O4合成的影响及作用
摘要:
以MnSO4,KMnO4及LiOH为原料,经水热处理后得到LiMnO2,再由固相焙烧得到尖晶石相Li1.6Mn1.6O4,酸洗处理后得到锂离子筛。研究了水热温度,氧气和MnO4-/Mn2+的物质的量之比(nMnO4-:nMn2+)对所得LiMnO2的组成及相应前驱体Li1.6Mn1.6O4酸处理中Mn溶损率的影响。开路电势测量及化学分析表明,氧气会参与反应。若按照理论氧化剂用量nMnO4-:nMn2+=1:4进行水热反应会导致杂质Li2MnO3和LiMn2O4的生成。若控制水热温度为160℃,nMnO4-:nMn2+=1:6时可得到纯相正交LiMnO2(o-LiMnO2)。所得离子筛在高镁锂比盐湖卤水中Li+吸附容量可达42.87 mg·g-1,且对Li+具有优异的选择吸附性并遵循化学吸附过程。经过5个循环后吸附容量保持在37.21 mg·g-1,锰溶损率降至0.34%。
-
关键词:
- 水热合成
- / 尖晶石相
- / 离子筛
- / Li1.6Mn1.6O4
- / 锂吸附
English
Role of Process Parameters on Phase Purity of o-LiMnO2 and Synthesis of Li1.6Mn1.6O4 as Lithium Ion-Sieve
Abstract:
Spinel Li1.6Mn1.6O4 was synthesized by hydrothermal oxidation of MnSO4 with KMnO4 to form LiMnO2 following solid-phase roasting. Acid pickling transforms Li1.6Mn1.6O4 to lithium ion-sieve. The effects of hydrothermal temperature, oxygen and molar ratio of MnO4- to Mn2+ (nMnO4-:nMn2+) on LiMnO2 composition and the dissolution percentage of manganese from Li1.6Mn1.6O4 during acid pickling were investigated. Open circuit potential measurement and chemical analysis indicate that oxygen in the air has involved in the hydrothermal reaction to produce LiMnO2 accompanied by formation of Li2MnO3 and LiMn2O4 impurities at a theoretical nMnO4-:nMn2+ of 1:4. Pure orthogonal LiMnO2 (o-LiMnO2) was obtained with a molar ratio of MnO4-to Mn2+ of 1:6 at 160℃. The Li+ adsorption capacity in salt lake brine was 42.87 mg·g-1. The lithium ion-sieve showed excellent adsorption selectivity toward Li+ in salt lake brine and followed a chemical adsorption process. The adsorption capacity remained at 37.21 mg·g-1 and the dissolution percentage of manganese decreased to 0.34% after 5 cycles.
-
Key words:
- hydrothermal synthesis
- / spinel phase
- / ion-sieve
- / Li1.6Mn1.6O4
- / Li adsorption
-
Lithium is known as a new energy metal and drives the world forward[1]. The rapid development of new energy vehicles leads to the increasing demand for lithium[2-3]. Lithium are distributed in seawater, salt lake brines and minerals such as spodumene and lepidolite. China has abundant salt lake brines with high mass ratios of Mg to Li.
Lithium ion-sieve adsorption is the most promising method of recovering lithium from salt lake brines due to its low cost, no pollution and high selectivity. Manganese oxide-based ion sieve H1.6Mn1.6O4 has the highest theoretical adsorption capacity (68 mg·g-1) and attracts most attention. The most common synthesis process of lithium ion-sieve is hydrothermal formation of LiMnO2 followed by roasting and acid pickling. Two types of Mn3+ resource were adopted during the hydrothermal synthesis of LiMnO2: One is Mn2O3 obtained by roasting electrolytic MnO2; The other depends on the in-situ formation of MnOOH using oxidant and Mn2+-containing solutions[4-10]. The latter is more convenient compared to the former and widely applied for the synthesis of lithium ion-sieve. However, the actual lithium adsorption capacity in salt lake brine was generally lower than 30 mg·g-1 and the dissolution percentage of manganese from Li1.6Mn1.6O4 during the acid treatment greater than 3%[11-14], which limits the industrial application. Many scholars focused on the effect of synthesis parameters on the adsorption capacity and stability of lithium ion-sieve. In fact, Mn2+ is easy to oxidize by oxygen in the process of in-situ formation of MnOOH, which makes the synthesis process carry out in an inert atmosphere[15]. However, keeping an inert atmosphere is inconvenient and high cost. It is seldom reported the effect of oxygen as oxidant on the composition in the process of hydrothermal synthesis of LiMnO2.
In this paper, lithium ion-sieve was synthesized by hydrothermal oxidation of MnSO4 with KMnO4 to form LiMnO2 following solid-phase roasting and acid pickling. The effects of hydrothermal temperature, the molar ratio of MnO4- to Mn2+ and oxygen in the air on the composition of LiMnO2 were investigated in detail. The adsorption kinetics and separation performance of lithium ion sieve in salt lake brine have been discussed.
1. Experimental
1.1 Materials and reagents
LiOH·H2O, KMnO4 and MnSO4 produced by Sinopharm Chemical Reagent Co., Ltd. were used as raw materials, and all reagents were of analytical grade. Salt lake brine was from the Lop Nor salt lake and its main composition was listed in Table 1.
Table 1

 下载:
导出CSV
下载:
导出CSV
Mg Na K Li Ca S B Si 106 100 5 020 2 480 220.2 27.24 6 831 519.0 28.05 P Mo Fe As Co Ga Cu V 5.26 4.50 0.87 0.63 0.53 0.45 0.42 0.32 Mn Sn Cr Al Ni Pb Y Cd 0.28 0.23 0.20 0.13 0.12 0.04 0.04 0.03 1.2 Pretreatment process
MnSO4 solution and KMnO4 solution were simultaneously added into a LiOH solution through a flowmeter. The mixed solution volume was kept around 500 mL and molar ratio of Li to Mn fixed as 4.5. After mechanically stirring for 2 h, the mixture was transferred into a 1.0 L autoclave.
1.3 Preparation of LiMnO2 and precursor Li1.6Mn1.6O4
LiMnO2 precipitate was obtained by hydrothermal treating the above mixture for 18 h at a certain temperature. After filtration and washing several times with deionized water, the resulting LiMnO2 was calcined in a muffle furnace at 350~500 ℃ for 4 h to form the precursor of lithium ion-sieve Li1.6Mn1.6O4.
1.4 Preparation of lithium ion-sieve
The precursor (0.6 g) was added to 100 mL of 0.5 mol·L-1 HCl at 30 ℃ and stirred for 3 hours, centrifuged, washed, and dried to obtain lithium ion sieve. The percentage of dissolved manganese and extraction percentage of Li+ from each precursor during acid treatment were calculated by the following equation:
$ {R_i} = \frac{{{c_i}{v_1}}}{{{m_{\rm{s}}}{w_i}}} $
(1) where Ri is the rate of dissolved metal ions, %; ci is the concentration of metal ions in the supernatant (mg·L-1); v1 is the volume of the solution (L); ms is the mass of the precursor (mg); wi is the mass fraction of metal in the precursor (%).
1.5 Adsorption properties of lithium ion-sieve
The lithium ion-sieve (0.30 g) was immersed in 100 mL salt lake brine and stirred at 30 ℃ for 20 h. Then the suspension was filtered and the concentra-tions of all the metal ions in the supernatant were determined. The adsorption capacity or the amount of metal ion adsorbed per gram of ion sieve at equili-brium (Qe), distribution coefficient (Kd), and separation factor (αMeLi) were calculated using equations (2~4):
$ {Q_t} = \frac{{{v_2}\left( {{c_0} - {c_t}} \right)}}{{{m_0}}} $
(2) $ {K_{\rm{d}}} = \frac{{{c_0} - {c_t}}}{{{m_0}{c_t}}} $
(3) $ \alpha _{{\rm{Me}}}^{{\rm{Li}}} = \frac{{{k_{\rm{d}}}({\rm{Li}})}}{{{k_{\rm{d}}}({\rm{Me}})}} $
(4) where Qt represents the adsorption capacity of Li+ (mg·g-1), c0 is the concentration of Li+ in the salt lake brine (mg·L-1), ct is the concentration of Li+ in the filtrate after adsorption (mg·L-1), v2 is the volume of salt lake brine (L), m0 is the mass of lithium ion-sieve (g); Kd represents the distribution coefficient of metal ion Men+ in brine, and αMeLi is a separation coefficient between lithium and Me (Na+, K+, Mg2+) in the adsorp-tion process.
1.6 Adsorption kinetics
The lithium ion-sieve (0.30 g) was added to 100 mL of salt lake brine and stirred at 25 ℃, samples were taken at 1, 2, 6, 12, 20 and 30 h respectively to determine the concentration of Li+ in the supernatant to calculate the adsorption capacity of lithium ion sieve. The adsorption process of lithium ion sieve was simulated by pseudo-second-order kinetic model and pseudo-first-order kinetic model, respectively.
1.7 Circulating property of lithium ion sieve
The desorption and adsorption of Li+ have been repeated 5 times to test the recycling performance of the lithium ion sieve. In each desorption process, the precursor Li1.6Mn1.6O4 were immersed into 0.5 mol·L-1 HCl solution. The ratio of solid to liquid was controlled at 1/100 (w/V, g·mL-1). After acid pickling at 30 ℃ for 4 h, the lithium ion-sieve was filtered, washed and dried. Then the ion sieve was added into the salt lake brine to adsorb lithium. The above operations were termed as one cycle. The concentra-tions of manganese and lithium in the effluents were analyzed to calculate the dissolution percentage of manganese and adsorption capacity of lithium of each cycle. The percentage of dissolved manganese and the capacity of lithium adsorption of each cycle were calculated by the equation (1) and the equation (2), respectively.
1.8 Characterization and chemical analysis
The crystalline phases were characterized by XRD using a Rigaku Rint-2000 X-ray diffractometer equipped with monochromatized Cu Kα radiation (λ=0.154 056 nm), operating at 40 kV and 100 mA, and a scanning rate of 10°·min-1 in a 2θ range of 10°~80°. The morphology of the particles was characterized by field emission scanning electron microscopy (MIRA3 TESCAN). The concentrations of manganese and lithium were determined using an atomic absorption spectrophotometer (TAS-999F, Beijing). The manganese valence was characterized after oxidation-reduction titration analyses by using the standard oxalic acid method[16].
DTA-TG curve was performed on a MAC science thermal analyzer (system 001 200 TG-DTA) at a heating rate of 5 ℃·min-1 under an air atmosphere. Open circuit measurement was carried out using a Reference 600+ electrochemical workstation. The working electrode was Pt wire (0.5 mm diameter, 0.5 cm long). The counter electrode was a platinum foil (about 2 cm2). All potentials were measured and reported relative to a saturated Hg/HgO electrode.
When the MnSO4 and KMnO4 solution were added into the LiOH solution, the change of open circuit potential with time was recorded.
2. Results and discussion
2.1 Effect of hydrothermal temperature
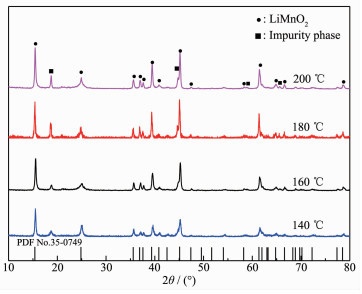
The XRD patterns of LiMnO2 obtained at different hydrothermal temperatures are shown in Fig. 1. Table 2 shows the extraction percentage of Li+ and the percentage of dissolved manganese of the precursor as well as the adsorption capacity of Li+ of the corresponding lithium ion sieve.
Figure 1
 Figure 1. XRD patterns of precipitates obtained at different hydrothermal temperatures
Table 2
Table 2. Performance of precursor and ion-sieve synthesized at different hydrothermal temperatures下载:
导出CSV
Temperature/℃ Dissolution percentage of manganese/% Extraction percentage of Li+/% Adsorption capacity of Li+/(mg·g-1) 140 2.44 84.88 28.35 160 2.62 86.32 30.29 180 2.74 84.62 26.56 200 2.93 85.03 26.46 It is found from Fig. 1 that all the XRD patterns are indexed to orthogonal LiMnO2 (PDF No.35-0749). A characteristic impurity peak near 18.7° was observed. A lot of scholars have different opinions about the peak source. Wang et al ascribed the peak to MnO2 due to Mn(OH)2 oxidation[17]. Ji et al. and Liu et al. attributed it to Li2MnO3 owing to the oxidation of Mn3+ to Mn4+ by oxygen from the autoclave[18-19]. Increasing hydrothermal temperature lead to an increase of peak intensity at 18.7°. Supposing that oxygen participates in the reaction to some extent during the pretreatment process and hydrothermal reaction. The impurity peak at 18.7° was attributed to Li2MnO3 and LiMn2O4. The exact origin of the peak was discussed in the following section.
To check the effect of hydrothermal temperature on the composition of precursor Li1.6Mn1.6O4, LiMnO2 was roasted at 450 ℃ for 4 h. Table 2 shows the properties of precursor and adsorption capacity of its ion-sieve H1.6Mn1.6O4. It is observed that the percentage of dissolved manganese increased with increasing hydrothermal temperature. Both the extraction percentage of Li+ and adsorption capacity increase slightly with the increasing temperature, reaching a maximum at 160 ℃, and then decreased. The increase in the percentage of dissolved manganese is due to an increase in LiMn2O4 content. The extraction percentage of Li+ is related to the crystal structure of LiMnO2. When the hydrothermal temperature reached 140 ℃, the reaction rate became slow and LiMnO2 growth was imperfect, resulting in a low extraction percentage of Li+ and adsorption capacity. When the temperature increased to 160 ℃, LiMnO2 crystal develops comp-letely, which is beneficial to the extraction and adsorp-tion of Li+ ions. Further increasing the temperature leads to the formation of Li2MnO3, which in turn reduced Li+ extraction and adsorption performance[20].
2.2 Effect of molar ratio of MnO4-/Mn2+
The formation of orthogonal LiMnO2 can be expressed by equation (5). The theoretical molar ratio of MnO4- to Mn2+ was 1:4. However, the presence of either Li2MnO3 or LiMn2O4 as shown in Fig. 1 indicates that the oxidant was excessive in the hydrothermal reaction. It is assumed that the excessive oxidant originates from oxygen in the air and autoclave.
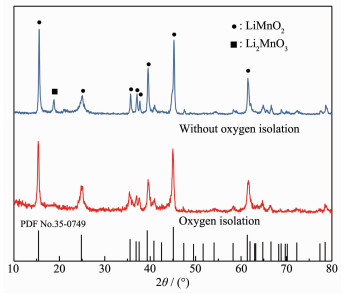
To support the assumption, the pretreatment process was carried out in a glove box to completely isolate the oxygen and the molar ratio of MnO4-/Mn2+ was kept at 1:4. After the pretreatment was completed, the suspension was transferred into the autoclave and N2 was blown for 30 min. The XRD patterns of the resulting hydrothermal products with and without oxygen isolation are shown in Fig. 2.
Figure 2
 Figure 2. XRD patterns of hydrothermal product obtained after complete oxygen isolation
$ {\rm{MnO}}_4^ - + 4{\rm{M}}{{\rm{n}}^{2 + }} + 12{\rm{O}}{{\rm{H}}^ - } + 5{\rm{L}}{{\rm{i}}^ + } \to 5{\rm{LiMn}}{{\rm{O}}_2} + 6{{\rm{H}}_2}{\rm{O}} $
(5) It can be seen from Fig. 2 that the hydrothermal product is pure LiMnO2 (PDF No.35-0749) after oxygen was completely isolated. The manganese content was 58.42%, nearly identical to the theoretical content (58.52%) of LiMnO2, and manganese valence was 3.08. This result indicates that oxygen in the air dissolves into the suspension in the pretreatment process and participates in the oxidation reaction.
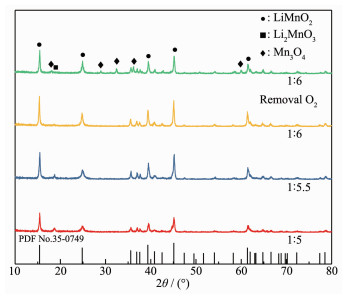
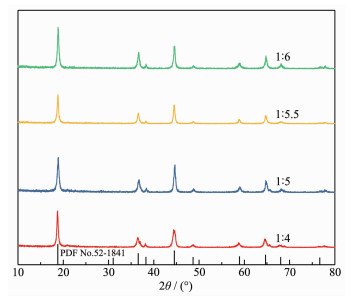
In order to avoid the inconvenience of oxygen removal, an attempt to reduce the amount of oxidant KMnO4 was made by changing the nMnO4-:nMn2+ from 1:4 to 1:5, 1:5.5 even 1:6, the XRD patterns of the resulting precipitates are shown in Fig. 3.
Figure 3
 Figure 3. XRD patterns of hydrothermal products obtained under different molar ratios of nMnO4-Mn2+:n
As shown in Fig. 3, the impurity peak at 18.7° was significantly reduced and even disappeared at a the nMnO4-:nMn2+ of 1:6. The results again confirm the fact that oxygen either from air or autoclave participates in the oxidation reaction.
To further support the fact, the molar ratio of MnO4- to Mn2+ was kept at 1:6, and N2 continuously blown into the autoclave for 30 min in order to remove the oxygen in the autoclave and suspension. The XRD patterns of the hydrothermal products are also shown in Fig. 3. Both LiMnO2 and Mn3O4 diffraction peaks were observed. The appearance of Mn3O4 indicates that the oxidation reaction was incomplete in the absence of oxygen when the molar ratio of MnO4- to Mn2+ was 1:6.
The valence of Mn (ZMn) and mass fraction of manganese (wMn) in the LiMnO2 sample obtained at different molar ratios of MnO4- to Mn2+ were measured. The results are shown in Table 3.
Table 3
Table 3. Mn valence in LoMnO2 at different molar ratios of MnO4- to Mn2+下载:
导出CSV
nMnO4-Mn2+:n 1:4 1:5 1:5.5 1:6 1:6 (O2 removal) wMn/% 55.69 56.62 57.61 58.54 58.70 ZMn 3.32 3.23 3.15 3.02 3.00 When the molar ratio of MnO4- to Mn2+ decreased from 1:4 to 1:6, the Mn valence decreased from 3.32 to 3.02 and the mass fraction of manganese increased from 55.69% to 58.54%. The valence of Mn higher than 3.0 means that the sample contains other compounds besides LiMnO2. The theoretical mass fraction of manganese in Li2MnO3, LiMnO2, LiMn2O4 and Mn3O4 is 47.03%, 58.52%, 60.77% and 72.03%, respectively. The sample obtained at a molar ratio of MnO4- to Mn2+ of 1:6 had a mass fraction of manganese close to LiMnO2. When the oxygen in the autoclave was removed, a small amount of Mn3O4 was formed due to insufficient oxidation, resulting in a higher mass percentage of manganese.
It is deduced from the mass fraction of manganese and valence in Table 3 that the sample is composed of LiMnO2, Li2MnO3 and LiMn2O4. Assuming that the total mass of Mn was 1 mol, LiMnO2, Li2MnO3 and LiMn2O4 account for x, y and (1-x-y) mol, respectively. The mass fraction of LiMnO2 (w), Li2MnO3 (w) and LiMn2O4 (w) in the sample can be calculated by the following equation (6~10). The results are shown in Table 4.
Table 4
Table 4. Hydrothermal product components obtained at different molar ratios of MnO4- to Mn2+下载:
导出CSV
nMnO4-Mn2+:n wLiMnO2/% wLiMnO3/% wLiMn2O4/% 1:4 56.54 27.72 15.74 1:5 67.62 19.13 13.25 1:5.5 77.23 10.35 12.42 1:6 98.16 0.16 1.68 $ 3x + 4y + 3.5(1 - x - y) = {Z_{{\rm{Mn}}}} $
(6) $ \frac{x}{{58.52\% }} + \frac{y}{{47.03\% }} + \frac{{1 - x - y}}{{60.77\% }} = \frac{1}{{{w_{{\rm{Mn}}}}}} $
(7) $ {\omega _{{\rm{LiMn}}{{\rm{O}}_2}}} = \frac{{x{w_{{\rm{Mn}}}}{M_{{\rm{LiMn}}{{\rm{O}}_2}}}}}{{{M_{{\rm{Mn}}}}}} \times 100\% $
(8) $ {\omega _{{\rm{L}}{{\rm{i}}_2}{\rm{Mn}}{{\rm{O}}_3}}} = \frac{{y{w_{{\rm{Mn}}}}{M_{{\rm{L}}{{\rm{i}}_2}{\rm{Mn}}{{\rm{O}}_3}}}}}{{{M_{{\rm{Mn}}}}}} \times 100\% $
(9) $ {\omega _{{\rm{LiM}}{{\rm{n}}_2}{{\rm{O}}_4}}} = \left[ {1 - \left( {{w_{{\rm{LiMn}}{{\rm{O}}_2}}} + {w_{{\rm{L}}{{\rm{i}}_2}{\rm{Mn}}{{\rm{O}}_3}}}} \right)} \right] \times 100\% $
(10) Where M, M and MMn represent the molecular weight of LiMnO2, Li2MnO3 and the relative atomic weight of manganese, respectively.
It can be seen from Table 4 that LiMnO2 content increased from 56.54% to 98.16% while Li2MnO3 decreased from 27.72% to 0.16% when the molar ratio of MnO4- to Mn2+ changed from 1:4 to 1:6. When the MnO4-/Mn2+ ratio decreased to 1:6, the product was nearly pure LiMnO2 with a very small amount of Li2MnO3 and LiMn2O4. It is deduced that pure LiMnO2 can be obtained when the amount of oxidant was reduced to a certain extent.
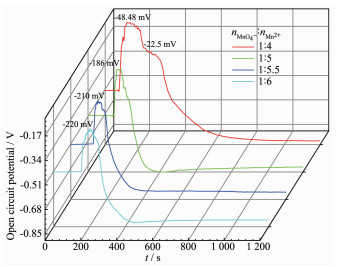
In order to find the effect of oxygen on the pretreatment process, the change of open circuit potential with pretreatment time was recorded and is shown in Fig. 4. Before the MnO4- and Mn2+ solutions were added into the LiOH solution, the open circuit potential maintained constant with time. When MnO4- and Mn2+ were added dropwise into the LiOH solution, redox reaction occurs and forms MnOOH through equation (11) and (12).
Figure 4
$ 5{{\rm{H}}^ + } + {\rm{MnO}}_4^ - + 4{\rm{e}} \to {\rm{MnOOH}} + 2{{\rm{H}}_2}{\rm{O}} $
(11) $ 120{{\rm{H}}^ - } + 4{\rm{M}}{{\rm{n}}^{2 + }} - 4{\rm{e}} \to 4{\rm{MnOOH}} + 4{{\rm{H}}_2}{\rm{O}} $
(12) According to the Nernst equation, the open circuit potential depends on the concentration ratio of MnO4- to Mn2+ in the solution, increasing with increasing concentration of MnO4-, and decreasing with increasing concentration of Mn2+. Upon MnO4- and Mn2+ solutions were added into the LiOH solution, the MnSO4 solution immediately formed Mn(OH)2 precipitate instead of oxidation to form MnOOH, resulting in the increase of open circuit potential. After a period of time, MnO4- and Mn2+ ions form MnOOH and the concentration of MnO4- decreased, resulting in a sharp drop in the open circuit potential. When the addition rate was equal to the oxidation reaction rate, the concentrations of MnO4- and Mn2+ remained unchanged and the open circuit potential kept stable.
When the molar ratio of MnO4- to Mn2+ changed from 1:4 to 1:6, the maximum open circuit potential decreases from -48.4 to -220 mV due to the decreasing of MnO4- concentration. However, the stable open circuit potentials were very close. The results again support the fact that oxygen from the air acts as an oxidant and participates in the oxidation. When the molar ratio of MnO4- to Mn2+ was high, such as 1:4 or 1:5, excessive oxidant resulted in the oxidation of MnOOH to Mn4+ and subsequent formation of Li2MnO3 and LiMn2O4. When the molar ratio of MnO4- to Mn2+ was relatively low, MnO4- combined with oxygen oxidizes all Mn2+ ions to produce pure MnOOH followed by conversion to LiMnO2. As a result, all MnO4- and Mn2+ ions were transformed to precipitate and made no great difference to the open circuit potential.
It is deduced that the LiMnO2 formation reaction proceeds according to equation (13).
$ \begin{array}{l} {\rm{MnO}}_4^ - + 6{\rm{M}}{{\rm{n}}^{2 + }} + 18{\rm{O}}{{\rm{H}}^ - } + 7{\rm{L}}{{\rm{i}}^ + } + 0.5{{\rm{O}}_2} \to \\ \;\;\;\;\;\;\;\;\;\;\;\;\;\;\;\;\;\;\;\;\;\;\;\;\;\;\;\;\;\;\;\;\;\;\;\;\;\;\;\;\;\;7{\rm{LiMn}}{{\rm{O}}_2} + 9{{\rm{H}}_2}{\rm{O}} \end{array} $
(13) It is calculated that the oxygen from the autoclave only accounts for 23.44% of the theoretical oxygen amount, the other 76.56% is from the dissolved oxygen during the pretreatment process.
Fig. 5 shows the XRD patterns of Li1.6Mn1.6O4 obtained under different molar ratios of nMnO4-:nMn2+. It is shown that all the XRD patterns are indexed to Li1.6Mn1.6O4 (PDF No.52-1841). A small impurity peak near 20.96° was observed in the range of 1:4, 1:5 and 1:5.5. When the molar radio of MnO4- to Mn2+ was 1:6, the impurity peak disappeared. In addition, the peak intensity ratio of (400) to(311) plane gradually increased from 1.64 to 2.27 when the molar ratio of MnO4- to Mn2+ increased from 1:6 to 1:4. Increasing the lithium content in the spinel may lead to growth rate of (400)-plane in the lattice being faster than (311) plane. The structure tend to be regular octahedron[21]. When molar ratio of MnO4- to Mn2+ was 1:6, the peak intensity ratio of (400) to(311) was 1.64, close to the theoretical ratio (1.61) denoted by the PDF No.52-1841. This result indicates that reducing KMnO4 amount can obtain the desirable phase and structure.
Figure 5
 Figure 5. XRD patterns of Li1.6Mn1.6O4 obtained under different molar ratios of nMnO4-:nMn2+
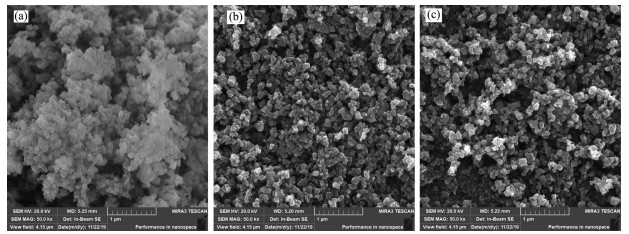
Fig. 6 shows the SEM images of Li1.6Mn1.6O4, lithium-extracted and lithium-reinserted sample. The morphology did not change significantly, the sizes of most particles were in a range of 0.1~0.2 μm, which was small enough and beneficial for ionic diffusion. However, the aggregate phenomenon was reduced after pickling. The looser surface reduces the mass transfer resistance and completes the ion exchange process quickly.
Figure 6
 Figure 6. SEM images of Li1.6Mn1.6O4 (a), lithium-extracted (b) and lithium-reinserted sample (c) obtained under molar radio of MnO4- to Mn2+ of 1:6
Table 5 shows the properties of Li1.6Mn1.6O4 obtained under different molar ratios of nMnO4-:nMn2+ and the adsorption capacity of the corresponding lithium ion-sieve.
Table 5
Table 5. Performance of precursor and ion-sieve obtained under different molar ratios of MnO4-/Mn2+下载:
导出CSV
nMnO4-Mn2+:n wLiMnO2/% Extraction percentage of Li+/% Dissolution percentage of manganese /% Adsorption capacity of Li+/(mg·g-1) 1:4 55.85 86.32 2.62 30.29 1:5 66.70 93.77 2.51 37.80 1:5.5 77.23 95.48 2.42 39.43 1:6 98.16 97.82 2.18 42.87 As can be seen from Table 5, a lower molar ratio lead to a higher adsorption capacity due to smaller amounts of impurities as shown in Table 4. The percentage of dissolved manganese showed a small decrease due to the decrease of LiMn2O4 content. It is found that the adsorption capacity of Li+ and the extraction percentage of Li+ increased with an increase of mass fraction of LiMnO2.
2.3 Effect of roasting temperature
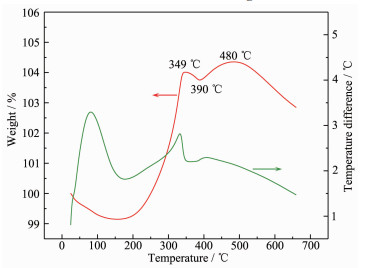
DTA-TG (differential thermal-gravimetric analysis) curve was measured to find the optimum roasting temperature of o-LiMnO2 obtained at a nMnO4-:nMn2+ of 1:6. As shown in Fig. 7, the evaporation of adsorbed water caused nearly 1% weight loss below 200 ℃. When the temperature was in a range from 200 to 480 ℃, LiMnO2 oxidation occurd through equation 14 and lead to 5.2% weight gain. A weight loss about 0.26% was observed for the temperature between 349 and 390 ℃, which may result from the transformation of Li2MnO3 and LiMn2O4 to LiMnO2 accompanied by oxygen release according to reaction (15)[22].
Figure 7
$ 8{\rm{LiMn}}{{\rm{O}}_2} + 2{{\rm{O}}_2} \to 5{\rm{L}}{{\rm{i}}_{1.6}}{\rm{M}}{{\rm{n}}_{1.6}}{{\rm{O}}_4} $
(14) $ {\rm{L}}{{\rm{i}}_2}{\rm{Mn}}{{\rm{O}}_3} + {\rm{LiM}}{{\rm{n}}_2}{{\rm{O}}_4} \to 3{\rm{LiMn}}{{\rm{O}}_2} + 0.5{{\rm{O}}_2} $
(15) The continuous decrease in weight above 480 ℃ was due to the decomposition of Li1.6Mn1.6O4 and the volatilization of Li+ [23].
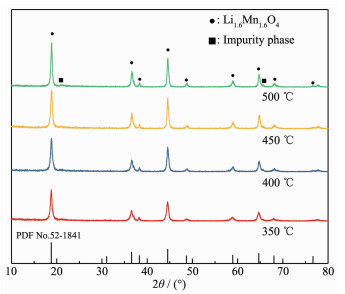
The XRD patterns of Li1.6Mn1.6O4 obtained at different roasting temperatures are shown in Fig. 8.
Figure 8
It can be seen from Fig. 8 that pure Li1.6Mn1.6O4 was obtained by roasting LiMnO2 at 350~450 ℃ for 4 h. The higher the roasting temperature, the better the crystallinity was. When the temperature reaches 500 ℃, some peaks appear at 20.6° and 65.6° and are more likely to be characteristic peaks of Li2MnO3 and LiMn2O4[13].
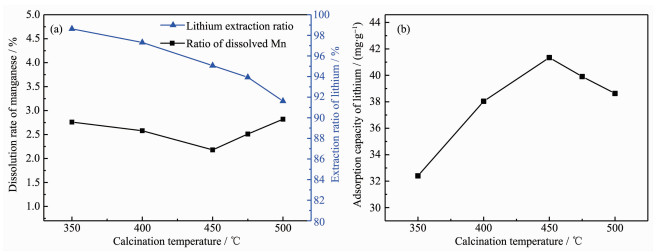
Fig. 9 shows the extraction percentage of Li+ and the percentage of dissolved manganese of the precursor as well as the adsorption capacity of Li+ of the corresponding lithium ion sieve at different roasting temperatures. It is observed that the extraction percentage of Li+ gradually decreased with an increase of roasting temperature. The percentage of dissolved manganese showed a similar trend but appeared a minimum at 450 ℃. The response can be interpreted from two sides. On the one hand, the extraction rate of Li+ was ion exchange between Li+ and H+ ions. As the roasting temperature increased, the Li1.6Mn1.6O4 crystallinity was well developed and lithium ions were more difficult to escape from the crystal lattice[24]. On the other hand, Li2MnO3 content increased with increasing temperature, while Li2MnO3 did not have Li+ extraction property in dilute hydrochloric acid. The increase in temperature lead to a more complete oxidation reaction, which in turn decreased the dissolution percentage of manganese. When the temperature exceeded 450 ℃, the sample began to decompose and form Mn3+, resulting in an increase in the dissolution rate of manganese.
Figure 9
 Figure 9. Extraction percentage of Li+ and dissolution percentage of manganese (a) and corresponding adsorption capacity of Li+ (b) at different roasting temperatures
The adsorption capacity of Li+ increased with increasing temperature, reaching a maximum of 41.34 mg·g-1 at 450 ℃. After that, it began to decrease. The crystal structure was not well developed at a low temperature. Correspondingly, the adsorption capacity of Li+ was low. When the temperature exceeded 450 ℃, as shown in Fig. 6, the decomposition occured accompanied by Li+ volatilization[22], resulting in the decrease of adsorption capacity of Li+.
2.4 Adsorption kinetics, selective adsorption and cycling performance
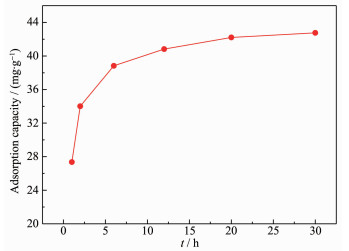
Fig. 10 shows the relationship between the adsorption capacity and time. It is obvious that the adsorption capacity initially increased and then tended to reach equilibrium around 42.76 mg·g-1 at 20 h.
Figure 10
The pseudo-first-order kinetic model (equation (16)) and the pseudo-second-order kinetic model (equation (17)) are used to analyze the adsorption process and determine the rate constant of the adsorption process[24].
$ \lg \left( {{Q_{\rm{e}}} - {Q_t}} \right) = \lg {Q_{\rm{e}}} - \frac{{t{k_1}}}{{2.303}} $
(16) $ \frac{t}{{{Q_t}}} = \frac{1}{{{k_2}Q_{\rm{e}}^2}} + \frac{t}{{{Q_{\rm{e}}}}} $
(17) where Qt is adsorption capacity of Li+ on ion sieve at adsorption time t, mg·g-1; Qe is equilibrium adsorption capacity of Li+ on ion sieve, mg·g-1; k1 is adsorption rate constant of pseudo-first-order kinetic model, h-1; k2 is adsorption rate constant of pseudo-second-order kinetic model, g·mg-1·h-1; t is adsorption time, h.
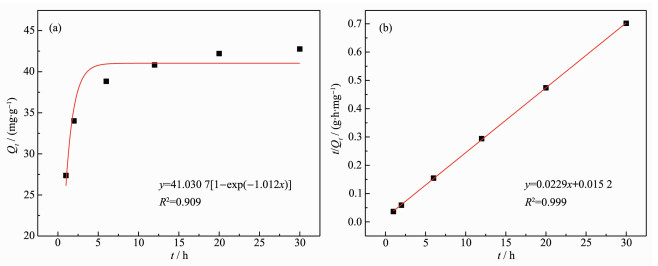
The pseudo-first-order kinetic model can be transformed into equation (18) and then fitted expo-nentially. The kinetic fitting results are shown in Fig. 11. Table 6 lists the fitted parameters.
Figure 11
 Figure 11. Pseudo-first-order kinetic (a) and pseudo-second-order kinetic curves (b) fitting of ion sieve adsorption
Table 6
Table 6. Fitting parameters of two kinetic equations下载:
导出CSV
k1/h k2/(g·mg-1·h-1) R2 Qe/(mg·g-1) Pseudo-first-order 1.01 — 0.909 41.03 Pseudo-second-order — 0.035 0.999 43.60 The correlation coefficient (R2) of the pseudo-second-order kinetic model for the adsorption process was 0.999, while that of pseudo-first-order kinetic model was 0.909. The result suggests that the adsorption process conformed to the pseudo-second-order kinetic model and was controlled by chemical adsorption process[25-27].
The equilibrium adsorption capacity (Qe) obtained by fitting pseudo-second-order kinetic model was 43.60 mg·g-1, which was consistent with the maximum adsorption capacity in Fig. 10.
Table 7 shows the concentration changes of the main metal ions in the salt lake brine before and after adsorption. Only K+ ions are adsorbed slightly in salt lake brine, and αKLi was 33.38, much larger than that for Li+. Indicating that the lithium ion-sieve towards Li+ ions had good separation and selectivity performance.
Table 7
Table 7. Selective adsorption of the ion sieve in salt lake brine下载:
导出CSV
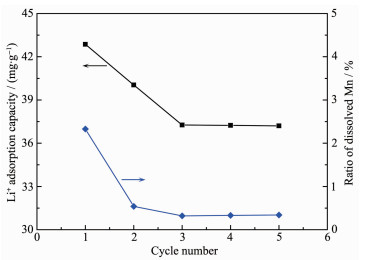
Metal ion c0/(mg·L-1) ct/ (mg:Lmg·L-1) Kd αMeLi Li+ 290 161 0.267 1.0 Na+ 3 020 3 016 0 - K+ 1 690 1 647 0.008 33.38 Mg2+ 109 820 109 815 0 - The cycle performance of lithium ion-sieve is shown in Fig. 12. The initial adsorption capacity of Li+ was 42.87 mg·g-1 and reduced to 37.21 mg·g-1 after five cycles. The dissolution percentage of manganese decreased from 2.33% to 0.34% and remained stable after 3 cycles.
Figure 12
The manganese valence increased from 3.94 to 3.97 after one-cycle acid pickling, indicating that a small amount of Mn3+ was present in the precursor and disproportionation occured to form Mn4+ and Mn2+. Mn2+ entering into the acid solution lead to manganese dissolution. After 2 cycles, the percentage of dissolved manganese tended to be stable, indicating that Mn3+ ions had nearly depleted and subsequent manganese dissolution was due to the reduction of MnO2·0.5H2O by chloride ions according to equation (19).
$ {Q_t} = {Q_{\rm{e}}}\left( {1 - {{\rm{e}}^{ - {k_1}t}}} \right) $
(18) The relatively high Li+ ion adsorption capacity and selectivity prove that the synthesized lithium ion-sieve is an excellent candidate for Li+ recovery from salt lake brines.
3. Conclusions
Li1.6Mn1.6O4 was synthesized through a hydro-thermal reaction to form LiMnO2 followed by roasting. Acid pickling transforms Li1.6Mn1.6O4 to lithium ion-sieve. The results show that hydrothermal temperature, molar ratio of MnO4-/Mn2+ have a great influence on LiMnO2 purity and adsorption performance of the lithium ion sieve. The LiMnO2 contained a small amount of Li2MnO3 and LiMn2O4. With the presence of oxygen in pretreatment process or hydrothermal reaction, pure orthogonal LiMnO2 was obtained at a molar ratio of MnO4- to Mn2+ of 1:6, deviated from the theoretical ratio of 1:4. Open circuit potential measure-ment confirms that oxygen participates in the oxidation reaction to form LiMnO2.
Pure Li1.6Mn1.6O4 can be obtained by roasting pure LiMnO2 at 450 ℃ for 4 h. The percentage of dissolved manganese was only 2.18% and the extraction percentage of Li+ was 97.82%. The adsorption capacity of corresponding lithium ion-sieve in Lop Nor salt lake brine was 42.87 mg·g-1. Distribution coefficients of metal ions are in the order: Li+≫K+ > Na+ > Mg2+. After 5 cycles, the Li+ ion adsorption capacity was 37.21 mg·g-1 and the percentage of dissolved manganese decreased to 0.34%. The adsorption process for the ion-sieve in salt lake brine fits well with a quasi-second-order kinetic model and is controlled by chemical adsorption.
-
-
[1]
封国富, 张骁.稀有金属, 2003, 27(1):57-61 doi: 10.3969/j.issn.0258-7076.2003.01.011FENG Guo-Fu, ZHANG Xiao. Chinese Journal of Rare Metals, 2003, 27(1):57-61 doi: 10.3969/j.issn.0258-7076.2003.01.011
-
[2]
Ebensperger A, Maxwell P, Moscoso C. Resour. Policy, 2005, 30(3):218-231 doi: 10.1016/j.resourpol.2005.09.001
-
[3]
Scrosati B, Garche J. J. Power Sources, 2010, 195(9):2419-2430 doi: 10.1016/j.jpowsour.2009.11.048
-
[4]
Banov B, Momchilov A, Trifonova A, et al. J. Power Sources, 1999, 81/82:562-565 doi: 10.1016/S0378-7753(99)00218-9
-
[5]
Xu H, Sun J, Gao L. Ionics, 2013, 19(1):63-69 doi: 10.1007/s11581-012-0704-1
-
[6]
Li K Y, Shua F F, Zhang J W, et al. Ceram. Int., 2015, 41(5):6729-6733 doi: 10.1016/j.ceramint.2015.01.116
-
[7]
Li X H, Su Z, Wang Y B. J. Alloys Compd., 2018, 735:2182-2189 doi: 10.1016/j.jallcom.2017.11.384
-
[8]
Zhang Q H, Li S P, Sun S Y, et al. Chem. Eng. Sci., 2010, 65(1):169-173 doi: 10.1016/j.ces.2009.06.045
-
[9]
Xie J L, Huang X, Zhu Z B, et al. Ceram. Int., 2011, 37(1):419-421 doi: 10.1016/j.ceramint.2010.08.045
-
[10]
Zhao H Y, Chen B, Cheng C, et al. Ceram. Int., 2015, 41(10):15266-15271 doi: 10.1016/j.ceramint.2015.07.213
-
[11]
Chitrakar R, Kanoh H, Miyai Y, et al. Chem. Mater., 2000, 12(10):3151-3157 doi: 10.1021/cm0000191
-
[12]
Chitrakar R, Kanoh H, Miyai Y, et al. Ind. Eng. Chem. Res., 2001, 40(9):2054-2058 doi: 10.1021/ie000911h
-
[13]
Xiao J L, Sun S Y, Wang J, et al. Ind. Eng. Chem. Res., 2013, 52(34):11967-11973 doi: 10.1021/ie400691d
-
[14]
Shi X C, Zhou D F, Zhang Z B, et al. Hydrometallurgy, 2011, 110(1/2/3/4):99-106 doi: 10.1016/j.hydromet.2011.09.004
-
[15]
Sun S Y, Xiao J L, Wang J, et al. Ind. Eng. Chem. Res., 2014, 53(40):15517-15521 doi: 10.1021/ie5004625
-
[16]
Gao A L, Sun Z H, Li S P, et al. Dalton Trans., 2018, 47(11):3864-3871 doi: 10.1039/C8DT00033F
-
[17]
王禄, 马伟, 韩梅, 等.化学学报, 2007, 65(12):1135-1139 doi: 10.3321/j.issn:0567-7351.2007.12.007WANG Lu, MA Wei, HAN Mei, et al. Acta Chim. Sin., 2007, 65(12):1135-1139 doi: 10.3321/j.issn:0567-7351.2007.12.007
-
[18]
Ji H M, Yang G, Miao X W, et al. Electrochim. Acta, 2010, 55(9):3392-3397 doi: 10.1016/j.electacta.2010.01.010
-
[19]
Liu Q, Li Y X, Hu Z L, et al. Electrochim. Acta, 2008, 53(24):7298-7302 doi: 10.1016/j.electacta.2008.04.008
-
[20]
Wang L, Ma W, Liu R, et al. Solid State Ionics, 2006, 177(17/18):1421-1428 doi: 10.1016/j.ssi.2006.07.019
-
[21]
Chitrakar R, Kanoh H, Kim Y S, et al. J. Solid State Chem., 2001, 160(1):69-76 doi: 10.1006/jssc.2000.9193
-
[22]
Chitrakar R, Sakane K, Umeno A, et al. J. Solid State Chem., 2002, 169(1):66-74 doi: 10.1016/S0022-4596(02)00018-X
-
[23]
Seo H, Na S, Lee B, et al. J. Ind. Eng. Chem., 2018, 64:311-317 doi: 10.1016/j.jiec.2018.03.029
-
[24]
马立文, 陈白珍, 石西昌, 等.无机化学学报, 2011, 27(4):697-703 http://www.wjhxxb.cn/wjhxxbcn/ch/reader/view_abstract.aspx?file_no=20110417&flag=1MA Li-Wen, CHEN Bai-Zhen, SHI Xi-Chang, et al. Chinese J. Inorg. Chem., 2011, 27(4):697-703 http://www.wjhxxb.cn/wjhxxbcn/ch/reader/view_abstract.aspx?file_no=20110417&flag=1
-
[25]
Langmuir I. J. Am. Chem. Soc., 1918, 40(9):1361-1403 doi: 10.1021/ja02242a004
-
[26]
Wang L, Meng C G, Han M, et al. J. Colloid Interface Sci., 2008, 325(1):31-40 doi: 10.1016/j.jcis.2008.05.005
-
[27]
Naiya T K, Bhattacharya A K, Das S K. J. Colloid Interface Sci., 2008, 325(1):48-56 doi: 10.1016/j.jcis.2008.06.003
-
[1]
-
Figure 2 XRD patterns of hydrothermal product obtained after complete oxygen isolation
Figure 3 XRD patterns of hydrothermal products obtained under different molar ratios of nMnO4-Mn2+:n
Figure 5 XRD patterns of Li1.6Mn1.6O4 obtained under different molar ratios of nMnO4-:nMn2+
Figure 6 SEM images of Li1.6Mn1.6O4 (a), lithium-extracted (b) and lithium-reinserted sample (c) obtained under molar radio of MnO4- to Mn2+ of 1:6
Figure 9 Extraction percentage of Li+ and dissolution percentage of manganese (a) and corresponding adsorption capacity of Li+ (b) at different roasting temperatures
Figure 11 Pseudo-first-order kinetic (a) and pseudo-second-order kinetic curves (b) fitting of ion sieve adsorption
Table 1. Composition of salt lake brine
mg·L-1 Mg Na K Li Ca S B Si 106 100 5 020 2 480 220.2 27.24 6 831 519.0 28.05 P Mo Fe As Co Ga Cu V 5.26 4.50 0.87 0.63 0.53 0.45 0.42 0.32 Mn Sn Cr Al Ni Pb Y Cd 0.28 0.23 0.20 0.13 0.12 0.04 0.04 0.03  下载: 导出CSV
Table 2. Performance of precursor and ion-sieve synthesized at different hydrothermal temperatures
Temperature/℃ Dissolution percentage of manganese/% Extraction percentage of Li+/% Adsorption capacity of Li+/(mg·g-1) 140 2.44 84.88 28.35 160 2.62 86.32 30.29 180 2.74 84.62 26.56 200 2.93 85.03 26.46
下载: 导出CSV
Table 3. Mn valence in LoMnO2 at different molar ratios of MnO4- to Mn2+
nMnO4-Mn2+:n 1:4 1:5 1:5.5 1:6 1:6 (O2 removal) wMn/% 55.69 56.62 57.61 58.54 58.70 ZMn 3.32 3.23 3.15 3.02 3.00
下载: 导出CSV
Table 4. Hydrothermal product components obtained at different molar ratios of MnO4- to Mn2+
nMnO4-Mn2+:n wLiMnO2/% wLiMnO3/% wLiMn2O4/% 1:4 56.54 27.72 15.74 1:5 67.62 19.13 13.25 1:5.5 77.23 10.35 12.42 1:6 98.16 0.16 1.68
下载: 导出CSV
Table 5. Performance of precursor and ion-sieve obtained under different molar ratios of MnO4-/Mn2+
nMnO4-Mn2+:n wLiMnO2/% Extraction percentage of Li+/% Dissolution percentage of manganese /% Adsorption capacity of Li+/(mg·g-1) 1:4 55.85 86.32 2.62 30.29 1:5 66.70 93.77 2.51 37.80 1:5.5 77.23 95.48 2.42 39.43 1:6 98.16 97.82 2.18 42.87
下载: 导出CSV
Table 6. Fitting parameters of two kinetic equations
k1/h k2/(g·mg-1·h-1) R2 Qe/(mg·g-1) Pseudo-first-order 1.01 — 0.909 41.03 Pseudo-second-order — 0.035 0.999 43.60
下载: 导出CSV
Table 7. Selective adsorption of the ion sieve in salt lake brine
Metal ion c0/(mg·L-1) ct/ (mg:Lmg·L-1) Kd αMeLi Li+ 290 161 0.267 1.0 Na+ 3 020 3 016 0 - K+ 1 690 1 647 0.008 33.38 Mg2+ 109 820 109 815 0 -
下载: 导出CSV
-


 扫一扫看文章
计量
- PDF下载量: 10
- 文章访问数: 1337
- HTML全文浏览量: 177
