Figure 1.
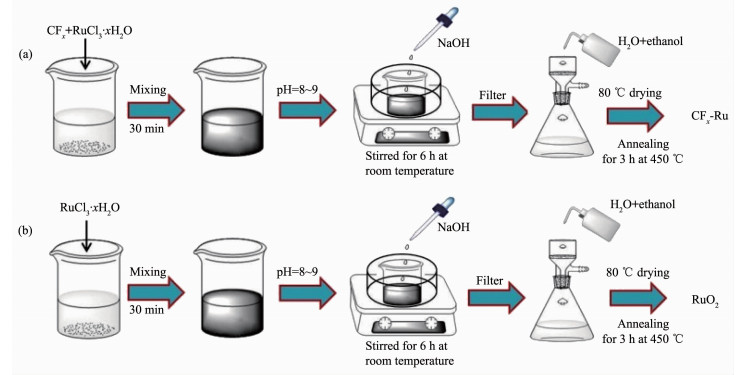
Schematic illustration for preparation of CFx-Ru (a) and RuO2 (b) samples

In recent years, secondary batteries have attracted much attention due to the application of electric vehicles and portable electronic device[1-4]. However, with the development of military weapons, implantable medical devices, defence tools and aerospace devices, primary batteries with high energy density and high power density are indispensable[5-8]. Among various primary batteries, Li/CFx batteries are one of the promising owing to their high theoretical specific energy (2 180 Wh·kg-1), high theoretical specific capacity (865 mAh·g-1), wide operating temperature range (-40~170 ℃), high open circuit voltage (3.0~3.2 V), long storage life and good safety performance[9-13]. Unfortunately, Li/CFx battery has a strong polarization, low voltage platform and poor high rate performance in the process of discharge, which is mainly from the poor electronic conductivity of CFx materials[14-17]. These unfavourable factors have limited the application and development of Li/CFx batteries in nowadays society.
In order to solve these problems, many resear-chers have been carrying out different methods to improve the electronic conductivity of CFx. The usual ways are covering with the conductive carbon layer or conductive polymer to enhance the electrochemical performance of CFx materials. Zhang et al.[18] obtained the carbon-coated CFx by a heat treatment of a mixture of CFx and polyvinyl difluoride (PVDF). The specific discharge capacity of carbon-coated CFx was 370 mAh·g-1 at 2C, while that of uncoated CFx was 260 mAh·g-1 at the same rate. The coating carbon improved the connectivity of particles and facilitated the construction of electronic channels, thus accelera-ting the diffusion of lithium ions and electron trans-port. Li et al.[19] prepared the polyaniline-coated CFx (x=1) (CFx@PANI) with different thicknesses by using an in situ chemical oxidative polymerization method at 0 ℃. The CFx@PANI had a discharge specific capacity of 843 mAh·g-1 at 0.1C. In particular, the discharge rate of CFx@PANI could reach up to 8C, which was much higher than that of pristine CFx. The improved electrochemical performance of the coated CFx materials came from the better conductivity of the polyaniline layer. Adding electrode materials with excellent conductivity such as MnO2[20], Ag2V4O11[21], LiV3O8[22] and MoO3[23] to CFx is a very effective method to improve the conductivity of cathode materials. For example, CFx∥MnO2 exhibited the energy density of 1 814 Wh·kg-1 and the power density of 6 599 W·kg-1 at 5C[20], respectively. Another way to improve the electrochemical performance of CFx materials is to prepare sub-fluorinated graphite. Sun et al. synthesized a fluorographene (FG) material by solvothermal exfoli-ation of F-graphite with acetonitrile and chloroform. The exfoliated FG showed a high power density of 4 038 W·kg-1 at 3C, which was much higher than that of F-graphite[24]. Other methods such as acid treatment, alkali treatment or ball milling also achieved better performance[25-27].
In this work, we prepared CFx-Ru materials for the first time by a simple in-situ chemical modification. The introduction of Ru via the interaction between RuO2 and CF2 improved the conductivity of the material. Meanwhile, the reduction of inactive CF2 on the surface of CFx is beneficial to the diffusion of lithium ions. Compared with the pristine CFx, CFx-Ru has a great improvement in specific capacity, energy density and discharge potential. This simple method provides a new way to solve the low rate performance of carbon fluoride materials.
CFx-Ru composites were prepared by a simple method of in situ modification. The preparation process was shown in Fig. 1a. Firstly, 0.3 g CFx (x=0.71, Products fluorinated carbon, FLUOROCHEMICAL CO., LTD) was dispersed in mixture of water/ethanol (1:1, V:V, 30 mL) and stirred at room temperature for 30 min. 0.019 g RuCl3·xH2O was added into the CFx suspens-ion. Then, 0.1 mol·L-1 NaOH was dropped into the solution to keep the pH value at 8~9 and stirred at room temperature for 6 h. After the precipitation process, the mixture was filtered through a microporous membrane and washed thoroughly with deionized water and ethanol. Afterward, the mixture was dried overnight at 80 ℃. Finally, the mixture was treated at 450 ℃ under N2 flow for 3 h to obtain the CFx-Ru composites (Fig. 1a). For comparison, samples were also prepared through the same steps as above except in the addition of pristine CFx, which was illustrated by Fig. 1b (The latter XRD results confirmed that it was RuO2).
The phases were characterized by X-ray diffrac-tion analysis (XRD, Bruker D8 Advance Diffractometer with Cu Kα radiation, λ=0.154 nm, target voltage was 40 kV, target current was 40 mA, scan speed was 0.5°·min-1, step size was 0.02°, and intensity data were collected within 2θ range of 10°~80°). The morphology and composition of the samples were characterized by scanning electron microscope (SEM) and energy dispersive X-ray spectroscopic (EDX) analysis on a Hitachi S-3400N. The chemical structure and element valence of pristine CFx and CFx-Ru were measured by X-ray photoelectron spectroscopy (XPS, Kratos Analy-tical Ltd, Axis Ultra). Thermo gravimetric analysis (TGA) was performed using a TG/DTA6300 thermal analyzer between 25 and 500 ℃ with a heating rate of 5 ℃·min-1 under N2 flow. The specific surface area of samples was measured on a Brunauer-Emmett-Teller (BET, ASIQ COR 100-3).
Electrochemical properties of the samples were measured with CR2032 coin cells, which were assembled inside a NEWARE glove box (volume fraction of H2O < 5×10⁻⁷, volume fraction of O2 < 5×10⁻⁷). For discharge performance testing, metal lithium as the anode, whatman glass fibre filter as separator and LiPF6 in EC-DMC (1:1, w/w) was used as electrolyte. The cathode electrode was synthesized through the following steps. The active material (80%(w/w)), the acetylene black (10%(w/w)) and the polyvinyl difluoride (PVDF, 10%(w/w)) were mixed and stirred in the N-methyl-2-pyrrolidone to form a uniform black slurry. The slurry was spread evenly on an Al foil and then dried at 80 ℃ for 12 h. The coated Al foil was cut into discs with a diameter of 14 mm and the discs were dried in vacuum at 120 ℃ for 24 h. Finally, the electrode was subjected to a constant current discharge test at a room temperature with a cut-off voltage of 1.5 V and different rates. The electrochemical impedance spectroscopy (EIS) data was obtained on an electrochemical working station (VMP3, Bio-Logic SA) at a frequency range of 100 kHz~10 MHz with 5 mV amplitude.
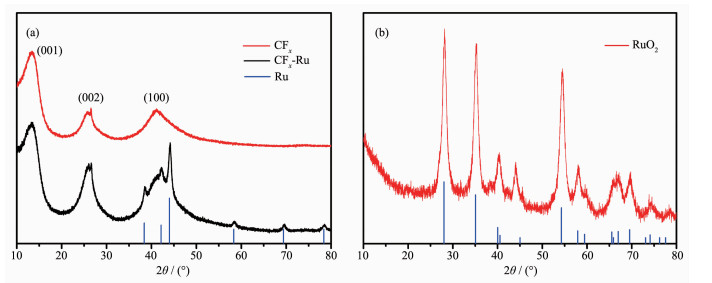
Fig. 2a showed the XRD patterns of pristine CFx and CFx-Ru, respectively. It was evident that the three typical wide peaks corresponding to the CFx phases at around 13.4°, 25.7° and 41.2°. The peak at around 25.7° could be assigned to the (002) reflection of graphite phases, which indicated a kind of layered type structure of pristine CFx[28-30]. The peak at about 2θ value of 13.4° could be indexed in a hexagonal system to the (001) reflection particularly for comp-ounds with higher fluorine content[28, 31-32]. The peak at 41.2° could be assigned to the (100) reflection, which was related to the plane length of the C-C bond in the reticular system[33-35]. The similar diffraction peaks at 2θ values of 13.4°, 25.7° and 41.2° had also appeared for CFx-Ru and thus indicated that the incorporation of Ru didnt change the structure of the pristine CFx. In addition, the diffraction peak of Ru could be clearly observed in the XRD pattern of CFx-Ru. As shown in Fig. 2b, in the case where all other experi-mental conditions are the same except adding CFx we got RuO2 phase instead of elemental Ru. From this we inferred that CFx reacted with the modified materials to form metallic Ru and the reaction mechanism will be further studied.
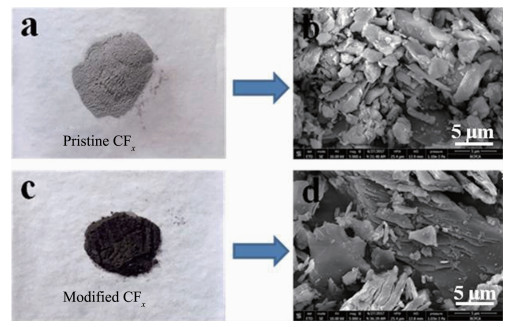
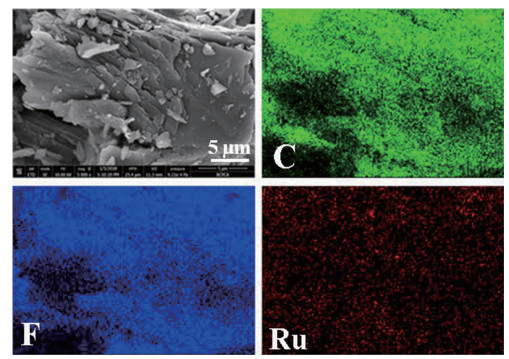
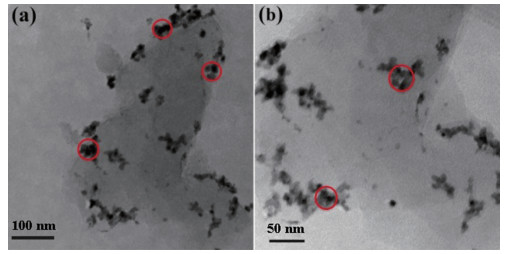
Fig. 3 showed the morphology images of the pristine CFx and CFx-Ru samples. As shown in Fig. 3a, the colour of the pristine CFx was light gray, which indicated that the precursor has been highly fluorinated. After calcination with Ru-containning precursor the CFx-Ru samples turned into bright black (Fig. 3c), which might relate with the decrease of F content in the materials. Fig. 3b showed the typical layered structure of pristine CFx with particle sizes in the range of 1~10 μm. Compared to the pristine CFx, the modified CFx material (Fig. 3d) was still a layered stacked structure and showed a clearer image. In addition, the morphology of the modified CFx exhibited more cracks like limestone, which would facilitate diffusion of lithium ion. However, Ru particles were not found in Fig. 3d because of the sizes of Ru particles were very tiny. The existence of Ru in the modified material was also confirmed by energy dispersive X-ray spectroscopy (EDS) mapping (Fig. 4) besides XRD results aforementioned. The C, F and Ru elements could be observed from the EDS elemental distribution map, further indicating that we had successfully prepared CFx-Ru materials. TEM images shown in Fig. 5 gave a more intuitive distribution of Ru particles. It could be seen that the fine Ru nanoparticles were dispersed on the CFx support. However, the red areas in the Fig. 5 showed that the Ru particles behaved with a slight agglomeration on the surface and edges of the CFx material.
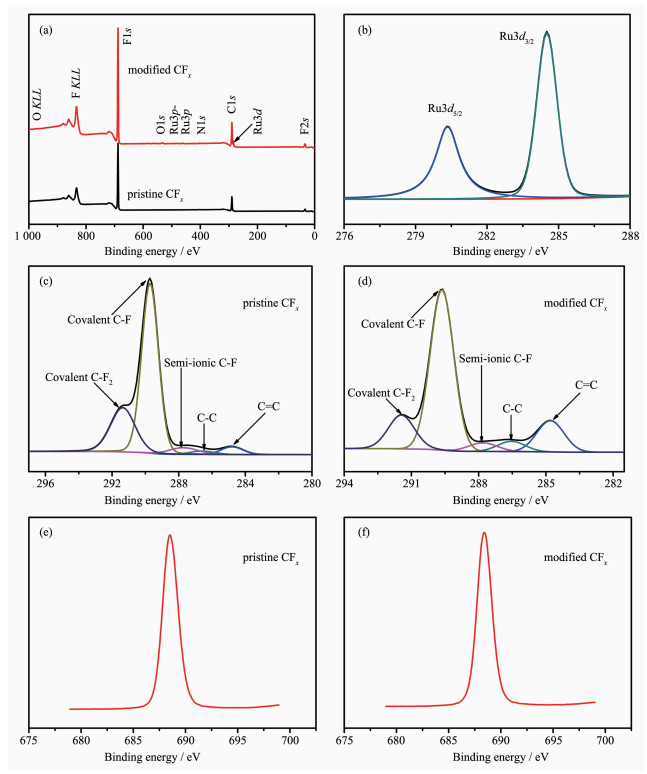
X-ray photoelectron spectroscopy (XPS), known as electron spectroscopy for chemical analysis (ESCA), was used for a semi-quantitative analysis technique of surface chemical properties of materials. From the above results we concluded that certain functional groups on the surface of CFx appear to react with the modified material. In order to explored the reaction mechanism, we performed XPS analysis on the materials before and after modification. Fig. 6a showed the detailed elemental composition information acquired from the XPS survey spectra. Compared with the pristine CFx sample, the modified material showed extra Ru signal besides C and F. From the Ru3d XPS spectrum in Fig. 6b, two peaks at 280.34 and 284.51 eV ascribed to Ru3d5/2 and Ru3d3/2 could be found, which meant that the Ru on the surface of modified material had the same chemical environment as elementary Ru[36] while the binding energy of Ru3d5/2 in RuO2 was 281 eV[37]. Fig. 6c and 6d showed that the F1s peaks were located at 688.53 and 688.41 eV, respectively for pristine CFx and modified CFx. The small shift towards lower binding energy for C-F revealed a change in the chemical environment of the F atoms, which reflected that the parts of the covalent C-F bonds were transformed into a semi-ionic bond after modification of Ru[38]. Fig. 6e and 6f showed the C1s peaks of pristine and modified CFx. The peaks around 286.5 and 284.80 eV were due to sp3 C-C bonds and sp2 C=C bonds[39-40] and peaks around 291.4 and 289.6 eV ascribed to C-F2 bonds and C-F bonds, respectively[39, 41-42]. The peak area ratio of C-F2 to C-F for pristine CFx was estimated at 0.4 while only 0.24 for CFx-Ru, namely 40%(n/n) loss after modification, which meant reduction of C-F2 inactive group. The ratios of F to C were calculated too, and the detailed results were shown in Table 1. It was very clear that the ratio of F to C of the modified CFx was decreased compared with that of pristine CFx (from 1.15 to 1).
 下载:
导出CSV
下载:
导出CSV
| Sample | Peak location of C1s / eV | Atomic fraction of element / % | nF/nC | ||||||
| C=C | C-C | C-F (Semi-ionic) | C-F (Covalent) | C-F2 | C | F | |||
| CFx | 284.80 | 286.59 | 287.72 | 289.72 | 291.36 | 46.20 | 52.99 | 1.15 | |
| CFx-Ru | 284.80 | 286.54 | 287.81 | 289.64 | 291.45 | 49.13 | 49.32 | 1.00 | |
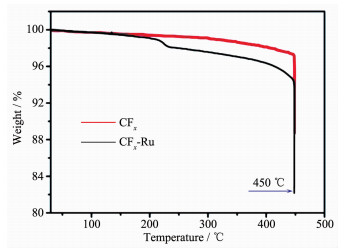
Fig. 7 showed the TGA curves of pristine CFx and CFx-Ru composites, which were performed in N2 atmo-sphere with a heating rate of 5 ℃·min-1. In addition, all samples were heated to 450 ℃ and kept in 450 ℃ for 3 h. As shown in Fig. 7, it can be obviously observed that the pristine CFx exhibited a weight loss of 11.31%(w/w) at around 450 ℃, resulted from the evaporation of fluorocarbons during the thermal decomposition process, such as C2F4[43-44]. Interestingly, the TGA curve of CFx-Ru sample showed a weight loss of 17.84%(w/w) at around 450 ℃, which was higher than that of pristine CFx. According to the literature reports[45-47], Ru complexes, as a kind of effective defluorination reagents, could reduce the activation energy barrier of C-F bond and activate C-F bond. Combined with the XRD and XPS results, we concluded that RuO2 reacted with CF2 distributed on the edges or surfaces of CFx during the calcination. This reaction consumed CF2 and produced elemental germanium, which maked the modified material exhibited a lower fluorocarbon ratio and greater weight loss. This process could be described by Equation (1):
|
$ {\rm{Ru}}{{\rm{O}}_2} + 2{{\rm{H}}_2}{\rm{O}} + 2{\rm{C}}{{\rm{F}}_2} \to {\rm{Ru}} + 2{\rm{C}}{{\rm{O}}_2} + 4{\rm{HF}} $ |
(1) |
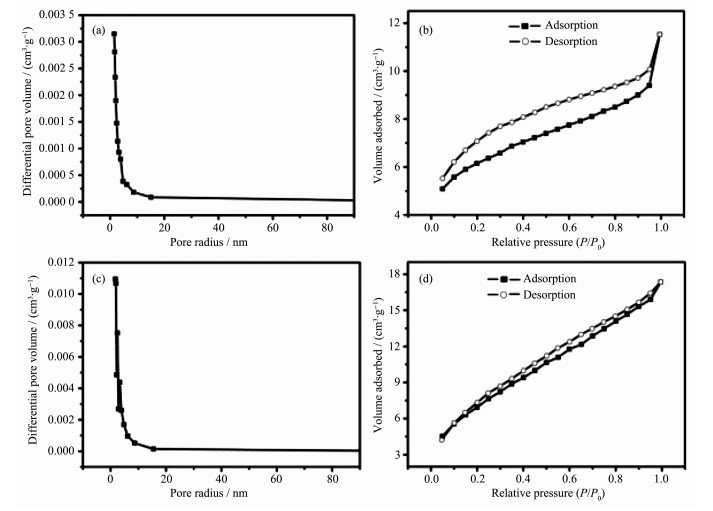
Generally, the surface structure and pore size distribution of materials had an important influence on the physicochemical properties, and the surface area and pore size might change during the modification. Therefore, The BET specific surface area and pore size distribution of all samples were studied by nitrogen adsorption techniques and the results were shown in Fig. 8 and Table 2. Fig. 8 showed the meso-porous characteristics of CFx and CFx-Ru. The pore size of the modified CFx was slightly larger than that of pristine CFx (Fig. 8a and 8c), which might be due to the cracks generated on the surface of the CFx-Ru. This result was consistent with the images of SEM. The corresponding typical Ⅳ isotherms of before and after Ru modification were shown in Fig. 8b and 8d, and the specific surface areas of 257 and 353 m2·g-1, respectively for the CFx and CFx-Ru, calculated from the isotherm were displayed in Table 2. The larger specific surface area could effectively improve the contact area between the electrode material and the electrolyte, which was favourable for the diffusion of lithium ions and increased the lithium storage capacity of the material.
 下载:
导出CSV
下载:
导出CSV
| Sample | BET surface area / (m2·g-1) | Pore diameter / nm |
| CFx | 257 | 1.527 |
| CFx-Ru | 353 | 1.707 |
performance test The electrochemical performances of both pristine CFx and CFx-Ru composites electrodes were evaluated against Li in standard CR2032 type coin cells. Fig. 9a and 9b showed the galvanostatic discharge curves of the pristine CFx and CFx-Ru composites at different current rates from 0.05C to 5C. As shown in Fig. 9a, the specific capacity of pristine CFx was 665 mAh·g-1 at 0.05 C and 611 mAh g-1 at 0.5C. Even at a 1C rate only a marginal attenuation was obviously seen in the discharge capacity and voltage platform. However, a drastic decrease happened at a 5C rate with a capacity of only 217 mAh·g-1. Compared with the pristine material, CFx-Ru composites exhibited higher rate capability and its discharge capacity was 693 mAh·g-1 at 0.05C and 669 mAh·g-1 at 0.5C, respectively. The specific capacity and voltage platform of the CFx-Ru composites had been significantly improved compared to those of pristine CFx. A capacity up to 605 mAh·g-1 at a rate of 5C had been obtained. The excellent electrochemical performance of CFx-Ru composites might benefit from the following aspects. First, the increase of semi-ionic C-F bonds and the deposition of Ru on the surface of pristine CFx improved the conductivity of the cathode material during modification process. Secondly, CF2 on the surface of CFx was considered to be an inactive group which hindered the diffusion of lithium ions[27]. The reduction of the CF2 content was beneficial to solve the transmission disorder of lithium ions, thereby contributed to the improvement of the rate performance and capacity performance of the material. Thirdly, the larger specific surface of the CFx-Ru composites could provide more electrochemically active sites, and thus resulted in better electrochemical performance.
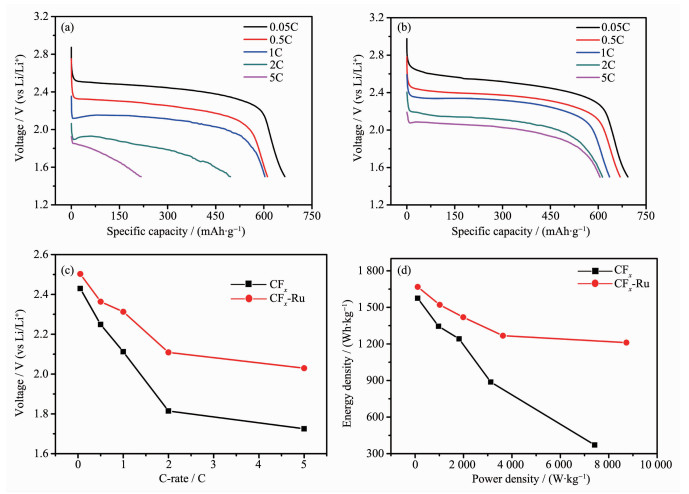
Fig. 9c displayed the change of average discharge potential with C-rate both for the pristine CFx and CFx-Ru composites. It was obvious that the average potential of pristine CFx declined drastically as increasing discharge rate, and its average potential was only 1.7 V at a discharge rate of 5C. Compared with pristine CFx, the CFx-Ru composites revealed a higher average potential of 2.5 V at 0.05C and of up to 2 V even at a rate of 5C. In order to depict the electrochemical performance of the pristine CFx and modifed CFx, the energy and power densities displayed in the Ragone plot (Fig. 9d). It could be observed that the energy density decreased with the increasing of power density. The calculated maximum energy densities were 1 575 and 1 697 Wh·kg-1 for the pristine CFx and modifed CFx at 0.05C, respectively. Compared with the CFx-Ru composites, the energy density decreased seriously with the increase of discharge rate for pristine CFx due to the decline of the discharge capacity and average potential. The pristine CFx showed energy and power densities were 371 Wh·kg-1 and 7 418 W·kg-1 at the rate of 5C, respectively, while the corresponding values of 1 197 Wh·kg-1 and 8727 W·kg-1 could be achieved for CFx-Ru.
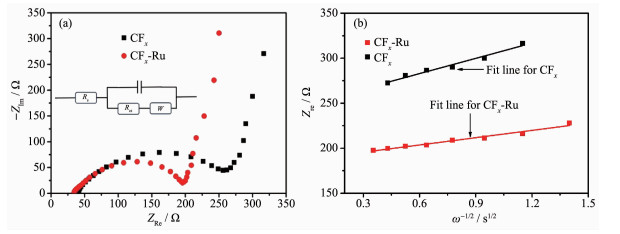
EIS technology was applied to further investigate the effect of Ru modification on the electrochemical performance of CFx materials. Fig. 10a showed the Nyquist plot, and the inset indicated the equivalent circuit used to fit the impedance data. As shown in Fig. 10a, the EIS curve of each sample was composed of a slanted straight line in the low frequency region and a depressed semicircle in the high frequency region. The semicircle represented the charge transfer resistance of lithium ions from the electrolyte to the surface of the cathode material of the battery system, expressed by Rct; the low frequency linear impedance was attributed to the diffusion impedance of lithium ions in the cathode material, expressed by Zw. The linear relationship between Zre (Real impedance) and the square root of frequency (ω-0.5) were shown in Fig. 10b, and the slope of this line was related to Warburg factor (σw). And also the lithium ion diffusion coefficients (DLi) of CFx and CFx-Ru materials were calculated according to the commonly used equation[48]. Detailed data were listed in Table 3. It could be seen from the Table 3 that the charge transfer resistance of CFx-Ru composite (161 Ω) was lower than that of the original CFx material (220 Ω). Meanwhile, the former showed a higher DLi of 2.07×10⁻¹¹ than 4.68×10⁻¹² cm2·s-1 for the latter, which could benefit the kinetic behaviour during discharging. These data could indicate that the metal Ru modification could improve the electron transfer ability and lithium ion diffusion ability of the material, thereby improved the discharge specific capacity of the electrode material and the discharge voltage platform.
 下载:
导出CSV
下载:
导出CSV
| Electrode | Rs / Ω | Rct / Ω | σw / (Ω·cm2·s-0.5) | DLi / (cm2·s-1) |
| CFx | 45.73 | 220 | 56.55 | 4.68×10⁻¹² |
| CFx-Ru | 33.87 | 161 | 26.90 | 2.07×10⁻¹¹ |
In summary, we have successfully synthesized CFx-Ru materials by a simple in-situ composite method. CFx-Ru composites exhibited specific capacity of 605 mAh·g-1, maximum power density of 8 727 W·kg-1 and energy density of 1 197 Wh·kg-1 at a current density of 5C, which are much higher than those of pristine CFx. The reaction mechanism between CFx materials and Ru-containing precursor has been thoroughly investigated by XRD, XPS, and TGA et al. The structure, morphology, specific surface area and pore size distribution of the materials have also been studied in detail to reveal the reasons for their good performance. The excellent electrochemical perfor-mance of CFx-Ru materials may be explained by the reduction of nF/nC and the introduction of metal Ru via the process of modification, which improves the conductivity of the material. In addition, the larger specific surface area and pore size are beneficial to the Li+ diffusion and electron transfer, which signifi-cantly reduces the charge transfer impedance and improves the Li+ diffusion coefficients.
Shen S Y, Hong Y H, Zhu F C, et al. ACS Appl. Mater. Interfaces, 2018, 10:12666-12677 doi: 10.1021/acsami.8b00919
Zhang J, Lu Q W, Fang J H, et al. ACS Appl. Mater. Interfaces, 2014, 6:17965-17973 doi: 10.1021/am504796n
Okada K, Kimura I, Machida K. RSC Adv., 2018, 8:5848-5853 doi: 10.1039/C7RA12740E
Yue B, Wang X L, Wang J X, et al. RSC Adv., 2018, 8:4112-4118 doi: 10.1039/C7RA12705G
Lee J, Urban A, Li X, et al. Science, 2014, 343:519-522 doi: 10.1126/science.1246432
Ritchie A G, Giwa C O, Bowles P G, et al. J. Power Sources, 2001, 96:180-183 doi: 10.1016/S0378-7753(01)00563-8
Liu J, Xia H, Xue D F, et al. J. Am. Chem. Soc., 2009, 131:12086-12087 doi: 10.1021/ja9053256
Zhu L, Li L, Zhou J, et al. Int. J. Electrochem. Sci., 2016, 11:6413-6422
Li Y, Feng Y Y, Feng W. Electrochim. Acta, 2013, 107:343-349 doi: 10.1016/j.electacta.2013.06.086
Damien D, Sudeep P M, Narayanan T N, et al. RSC Adv., 2013, 3:25702-25706 doi: 10.1039/c3ra45377d
Jayasinghe R, Thapa A K, Dharmasena R R, et al. J. Power Sources, 2014, 253:404-411 doi: 10.1016/j.jpowsour.2013.12.076
Yang W J, Dai Y, Cai S D, et al. J. Power Sources, 2014, 255:37-42 doi: 10.1016/j.jpowsour.2013.12.122
Liu W, Li Y, Zhang B X, et al. J. Phys. Chem. C, 2016, 120:25203-25209 doi: 10.1021/acs.jpcc.6b07126
Meduri P, Chen H H, Chen X L, et al. Electrochem. Commun., 2011, 13:1344-1348
Groult H, Julien C M, Bahloul A, et al. Electrochem. Commun., 2011, 13:1074-1076 doi: 10.1016/j.elecom.2011.06.038
Dubois M, Guérin K, Zhang W, et al. Electrochim. Acta, 2012, 59:485-491 doi: 10.1016/j.electacta.2011.11.015
Guerin K, Dubois M, Houdayer A, et al. J. Fluorine Chem., 2012, 134:11-17 doi: 10.1016/j.jfluchem.2011.06.013
Zhang Q, Xiao P, dAstorg S, et al. J. Power Sources, 2010, 195:2914-2917 doi: 10.1016/j.jpowsour.2009.10.096
Li L, Zhu L, Pan Y, et al. Int. J. Electrochem. Sci., 2016, 11:6838-6847
Li Y, Feng W. J. Power Sources, 2015, 274:1292-1299 doi: 10.1016/j.jpowsour.2014.10.150
Sideris P J, Yew R, Nieves I, et al. J. Power Sources, 2014, 254:293-297 doi: 10.1016/j.jpowsour.2013.12.108
Nagata M, Yi J, Tomcsi M, et al. ECS Trans., 2011, 33:223-237
Ebel S J, Smesko S A, Takeuchi E S. Patent, 1997, 5:667-916
Sun C B, Feng Y Y, Li Y, et al. Nanoscale, 2014, 6:2634-2641 doi: 10.1039/C3NR04609E
Zhang S S, Foster D, Read J. J. Power Sources, 2009, 188:601-605 doi: 10.1016/j.jpowsour.2008.12.007
Reddy M A, Breitung B, Fichtner M. ACS Appl. Mater. Interfaces, 2013, 5:11207-11211 doi: 10.1021/am403438m
Dai Y, Cai S D, Wu L J, et al. J. Mater. Chem. A, 2014, 2:20896-20901 doi: 10.1039/C4TA05492J
Wang Z F, Wang J Q, Li Z P, et al. RSC Adv., 2012, 2:11681-11686 doi: 10.1039/c2ra21871b
Nethravathi C, Rajamathi M. Carbon., 2008, 46:1994-1998 doi: 10.1016/j.carbon.2008.08.013
Meduri P, Chen H H, Xiao J, et al. J. Mater. Chem. A, 2013, 1:7866-7869 doi: 10.1039/c3ta11710c
Guérin K, Pinheiro J P, Dubois M, et al. Chem. Mater., 2004, 16:1786-1792 doi: 10.1021/cm034974c
Hamwi A. J. Phys. Chem. Solids, 1996, 57:677-688 doi: 10.1016/0022-3697(95)00332-0
Mouras S, Hamm A, Djurado D, et al. Revue de Chimie Minérale, 1987, 24:572-582
Gong P W, Wang Z F, Wang J Q, et al. J. Mater. Chem., 2012, 22:16950-16956 doi: 10.1039/c2jm32294c
Zhang Q, Takeuchi K J, Takeuchi E S, et al. Phys. Chem. Chem. Phys., 2015, 17:22504-22518 doi: 10.1039/C5CP03217B
Vinokurov K, Bekenstein Y, Gutkin V, et al. CrystEngComm, 2014, 16:9506-9512 doi: 10.1039/C4CE00822G
Wu Z S, Wang D W, Ren W, et al. Adv. Funct. Mater., 2010, 20:3595-3602 doi: 10.1002/adfm.201001054
Liu Y, Vander Wal R L, Khabashesku V N. Chem. Mater., 2007, 19:778-786 doi: 10.1021/cm062177j
Ren M M, Wang X, Dong C S, et al. Phys. Chem. Chem. Phys., 2015, 17:24056-24062 doi: 10.1039/C5CP03473F
Fulvio P F, Brown S S, Adcock J, et al. Chem. Mater., 2011, 23:4420-4427 doi: 10.1021/cm2012395
Gong P W, Wang Z F, Li Z P, et al. RSC Adv., 2013, 3:6327-6330 doi: 10.1039/c3ra22029j
Yan S J, Zhao J Q, Yuan Y C, et al. RSC Adv., 2013, 3:21869-21876 doi: 10.1039/c3ra43578d
Zhu Y L, Zhang L J, Zhao H H, et al. J. Mater. Chem. A, 2017, 5:796-803 doi: 10.1039/C6TA07919A
Nakajima T, Koh M, Gupta V, et al. Electrochim. Acta, 2000, 45:1655-1661 doi: 10.1016/S0013-4686(99)00389-8
Sabater S, Mata J A, Peris E. Nat. Commun., 2013, 4:2553-2559 doi: 10.1038/ncomms3553
Jones W D. Cheminform, 2004, 35:3991-3995
Kiplinger J L, Richmond T G, Osterberg C E. Cheminform, 2010, 25:373-431
Shenouda A Y, Liu H K. J. Power Sources, 2008, 185:1386-1391 doi: 10.1016/j.jpowsour.2008.08.042

Figure 8 BJH pore size distribution of (a) pristine CFx and (c) CFx-Ru; N2 adsorption-desorption isotherms of (b) pristine CFx and (d) CFx-Ru

Figure 9 Galvanostatic discharge curves of (a) CFx and (b) CFx-Ru; (c) Average potential as a function of discharge rate and (d) the Ragone plot of the pristine CFx and CFx-Ru composites

Figure 10 Impedance spectra of the CFx and CFx-Ru composites: (a) Nyquist plots and equivalent circuit; (b) Graph of Zre plotted as a function of ω-1/2 at low frequency
Table 1. Peak locations (eV) and assignments for CFx and CFx-Ru
| Sample | Peak location of C1s / eV | Atomic fraction of element / % | nF/nC | ||||||
| C=C | C-C | C-F (Semi-ionic) | C-F (Covalent) | C-F2 | C | F | |||
| CFx | 284.80 | 286.59 | 287.72 | 289.72 | 291.36 | 46.20 | 52.99 | 1.15 | |
| CFx-Ru | 284.80 | 286.54 | 287.81 | 289.64 | 291.45 | 49.13 | 49.32 | 1.00 | |
 下载: 导出CSV
Table 2. Surface area of CFx and CFx-Ru
| Sample | BET surface area / (m2·g-1) | Pore diameter / nm |
| CFx | 257 | 1.527 |
| CFx-Ru | 353 | 1.707 |
下载: 导出CSV
Table 3. Rs, Rct, σw and DLi values of the two electrodes prepared with CFx and CFx-Ru
| Electrode | Rs / Ω | Rct / Ω | σw / (Ω·cm2·s-0.5) | DLi / (cm2·s-1) |
| CFx | 45.73 | 220 | 56.55 | 4.68×10⁻¹² |
| CFx-Ru | 33.87 | 161 | 26.90 | 2.07×10⁻¹¹ |
下载: 导出CSV

 扫一扫看文章

扫一扫关注我们