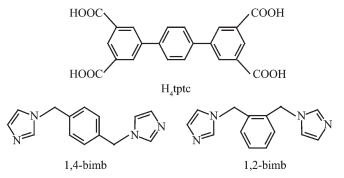
Scheme 1.
Structures of the ligands
Two Coordination Polymers Constructed by Aromatic Tetracarboxylic Acid: Luminescent and Magnetic Properties
Li-Jun ZHAI , Jie ZHANG , Ling-Ling GAO , Ting GAO , Jiao-Jiao JIA , Yu-Lan NIU , Tuo-Ping HU

Coordination polymers (CPs) have caused extensive attention from researchers as a new kind of functional hybrid materials because they have fascinating structures and extensive application in gas storage and separation[1-4], optics properties[5-10], magne-tism[11-12], catalysis[13-14] and drug sustained release[15], etc. At present, there have also been a lot of reports on the research of CPs in luminescence probe. Compared with traditional instrument methods, luminescence sensing is considered as a promising method due to its advantages of quick response, high sensitivity, low cost, simple operation, and so on[16-18].
In the past few years, with the rapid development of economy and the explosive growth of the popula-tion, the problems such as environmental pollution and public health are arousing more and more concerns[19]. Fe3+ is not only necessary for metabolism, but also widely used in industry[20]. However, excessive amounts of Fe3+ in the human body are harmful, and Fe3+ can contaminate the environment by being carelessly discarded[21]. While Cr6+ is widely used in diverse industrial applications, improper disposal of Cr6+ will pollute the living conditions of people[22]. So, it is very urgent to synthesize materials that can selectively and sensitively identify these ions. In recent years, researchers have agreed that CPs are one of the promising alternatives for luminescent probe. One of the biggest challenges is the design and construction of CPs with stable structure and ideal function. In the process of self-assembly, the construc-tion of the desired CPs depends on organic ligands and metal ions[23]. In terms of ligands, studies have shown that aromatic polycarboxylic acids are extensi-vely used to construct CPs due to the following advantages: firstly, their multiple binding nodes; secondly, their carboxylate groups can be partially or completely deprotonated to form multiple structures; furthermore, aromatic conjugated systems can coor-dinate with d10 center ions forming CPs materials with excellent luminescence properties. At the same time, the introduction of the second nitrogen-containing ligand is helpful to construct CPs with novel structures.
So, based on the ligands of p-terphenyl-3, 3″, 5, 5″-tetracarb oxylic acid (H4tptc), 1, 4-bis(imidazol-1-ylmethyl) benzene (1, 4-bimb) or 1, 2-bis(imidazol-1-ylmethyl) benzene (1, 2-bimb) (Scheme 1), two novel CPs, namely {[Zn2(tptc)(1, 4-bimb)2]·H2O}n (1) and {[Ni(tptc)0.5(1, 2-bimb)(H2O)]·H2O}n (2), have been synth-esized under solvothermal method and characterized by luminescence properties (1) and magnetic properties (2).
All chemicals were purchased commercially and used without further purification. IR (KBr pellet) spectra were recorded under a FTIR-8400S spectro-meter in a range of 4 000~400 cm-1. Thermogravi-metric analyses (TGA) were collected on a METTLER TGA analyzer at a heating rate of 10 ℃·min-1 under N2 atmosphere from room temperature to 750 ℃. Elemental analyses (C, H, and N) were performed by using a PerkinElmer 2400C elemental analyzer (EA). Powder X-ray diffraction (PXRD) was performed using a Rigaku D/Max-2500 PC diffractometer (Mo Kα radiation, λ=0.154 06 nm) at 50 kV, 30 mA with the 2θ range of 5°~50°. Luminescence spectra were performed on Hitachi F4600 spectrophotometer. Magnetic properties were measured by Quantum Design MPMS-XL-7 SQUID magnetometer.
Zn(NO3)2·6H2O (0.015 mmol, 4.5 mg), H4tptc (0.005 mmol, 2.1 mg), 1, 4-bimb (0.005 mmol, 1.2 mg), 0.15 mL NaOH aqueous solution (0.5 mol·L-1) and 1 mL H2O/DMF (1:1, V/V) were mixed in a stainless steel vessel (25 mL), kept at 130 ℃ for 72 h and then naturally cooled to ambient temperature to obtain colorless crystals. Yield: 41% (based on Zn). Elemental analysis Calcd. for C50H40N8O9Zn2(%): C, 58.48; H, 3.91; N, 10.85. Found(%): C, 58.54; H, 3.95; N, 10.89. IR (KBr, cm-1): 3 455 (m), 1 630 (s), 1 524 (vs), 1 393 (s), 742 (s), 733 (s), 683 (m), 678 (m) (Supporting information, Fig.S1).
Ni(NO3)2·6H2O (0.03 mmol, 8.8 mg), H4tptc (0.01 mmol, 4.2 mg), 1, 2-bimb (0.02 mmol, 4.8 mg) and 8 mL CH3CN/H2O (1:1, V/V) were placed in a 25 mL autoclave and heated to 130 ℃ for 72 h. After slowly being cooled to ambient temperature, green crystals were gained. Yield: 46% (based on Ni). Elemental Analysis Calcd. for C25H23N4NiO6(%): C, 56.16; H, 4.30; N, 10.48. Found(%): C, 56.24; H, 4.25; N, 10.68. IR (KBr, cm-1): 3 402 (vs), 1 613 (vs), 1 546 (vs), 1 526 (s), 1 402 (vs), 1 371 (s), 986 (m), 977 (m). 870 (s), 782 (s), 773 (s), 685 (m), 653 (m) (Fig.S1).
All crystallographic data were collected on a Bruker APEX Ⅱ CCD diffractionmeter using Mo Kα radiation (λ=0.071 073 nm) at 25 ℃. The structures were determined by direct methods and refined by the full-matrix least-squares method based on F 2 using SHELXL program and OLEX 2[24-25]. All nonhydrogen atoms were refined with anisotropic displacement parameters and hydrogen atoms were placed geometri-cally and refined using a riding model. Crystal structural parameters, some selected bond lengths and angles are listed in Table 1 and Table S1, respectively. The topology of CPs was analyzed by using TOPOs 4.0 program package[26].
 下载:
导出CSV
下载:
导出CSV
| 1 | 2 | |
| Empirical formula | C50H40N8O9Zn2 | C25H21N4NiO5 |
| Formula weight | 1 027.64 | 516.17 |
| Temperature/K | 296.15 | 298(2) |
| Crystal system | Monoclinic | Triclinic |
| Space group | P21 | P1 |
| a/nm | 0.735 9(7) | 0.907 7(3) |
| b/nm | 1.901 7(18) | 1.009 8(4) |
| c/nm | 1.610 0(15) | 1.717 9(6) |
| α/(°) | 94.964(3) | |
| β/(°) | 94.683(11) | 103.998(3) |
| γ/(°) | 108.727(3) | |
| Volume/nm3 | 2.246(4) | 1.423 7(9) |
| Z | 2 | 2 |
| Dc/(g·cm-3) | 1.520 | 1.204 |
| μ/mm-1 | 1.137 | 0.718 |
| F(000) | 1 056.0 | 534.0 |
| 2θ range for data collection/(°) | 5.078~49.998 | 4.944~55.426 |
| Reflection collected | 11 712 | 19 215 |
| Independent reflection | 4 988 | 6 581 |
| Rint | 0.092 8 | 0.053 1 |
| Data, restraint, parameter | 4 988, 1, 623 | 6 581, 0, 336 |
| Goodness-of-fit on F2 | 1.051 | 1.023 |
| R1, wR2 [I≥2σ(I)] | 0.061 9, 0.113 2 | 0.040 7, 0.093 0 |
| R1, wR2 (all data) | 0.110 3, 0.132 8 | 0.058 5, 0.099 4 |
CCDC: 1911100, 1; 1911101, 2.
The absorption spectrum at 3 440~3 460 cm-1 corresponds to the characteristic peak of the stretching vibration of the O-H group in water molecules. The peaks at 1 393 cm-1 (1) or 1 376 cm-1 (2) and 1 630 cm-1 (1) or 1 546 cm-1 (2) are attributed to the symm-etric and asymmetric stretching vibration of the carboxylate group, respectively. For 1~2, the lack of strong peak in a range of 1 690~1 730 cm-1 demon-strates that the H4tptc ligand is completely deprotonated (Fig.S1).
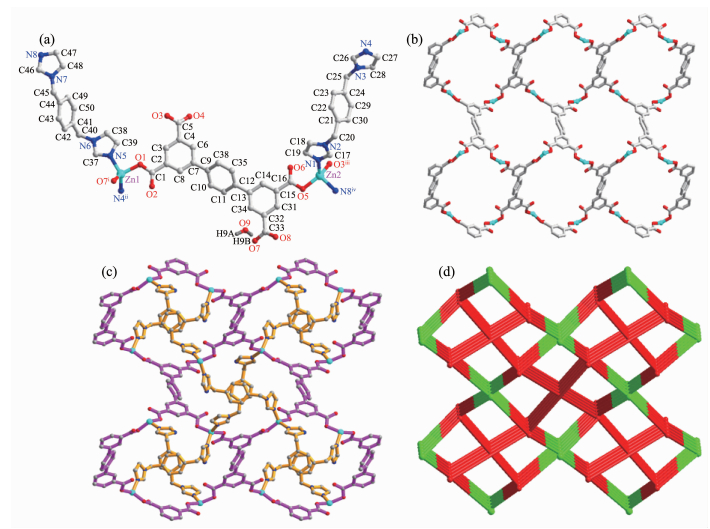
Complex 1 crystallizes in the monoclinic system with the P21 space group. Its asymmetric unit contains two Zn2+ ions, one tptc4- linker, two 1, 4-bimb linkers and one lattice water molecule. Both Zn2+ ions are four-coordinated and exhibit distorted tetrahedron geometries (Fig. 1a). Each Zn2+ ion is bound to two oxygen atoms of two distinct tptc4- linkers and two nitrogen atoms provided by two 1, 4-bimb ligands. The bond angles around Zn2+ range from 97.7° to 129.1°, and the bond lengths of Zn-O and Zn-N vary from 0.193 4 to 0.197 1 nm and 0.200 4 to 0.202 1 nm, respectively.
Symmetry codes: ⅰ 2-x, -0.5+y, 1-z; ⅱ 3+x, y, 1+z; ⅲ 1-x, 0.5+y, -z; ⅳ-3+x, 1+y, z
The H4tptc ligands in 1 are completely depro-tonated. All carboxylate groups adopt monodentate bridging coordination modes to link Zn2+ ions forming a 2D network (Fig. 1b), which are further expanded by 1, 4-bimb linkers to construct 3D structures (Fig. 1c). Topologically, complex 1 reveals a 2-nodal (4, 4)-c network with the topology of (86) by denoting Zn2+ ions and H4tptc ligands to be 4-c nodes, respectively.
Complex 2 crystallizes in the triclinic system P1 space group. There are one Ni2+ ion, half of tptc4- linkers, one 1, 2-bimb, and one coordinated water molecule in the asymmetric unit of 2. As exhibited in Fig. 2a, each Ni2+ ion is coordinated by three carboxy-late O atoms (Ni1-O1 0.214 26 nm, Ni1-O2 0.214 44 nm, Ni1-O3ⅰ 0.202 80 nm), a lattice water O atom (Ni1-O5W 0.207 47 nm), and two N atoms of two 1, 4-bimb (Ni1-N1 0.205 47 nm and Ni-N4ⅱ 0.206 35 nm), presenting a pseudo-octahedral geometry. The bond angles around Ni1 range from 61.46° to 179.23°.
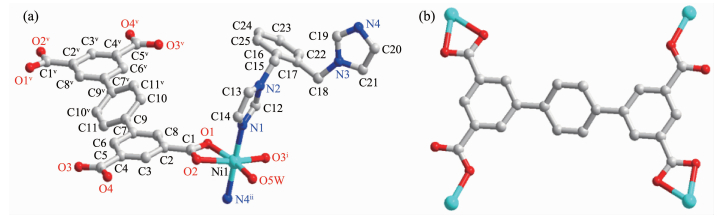
Symmetry codes: ⅰ x, -1+y, z; ⅱ 1+x, 1+y, z; ⅴ 1-x, 3-y, 2-z
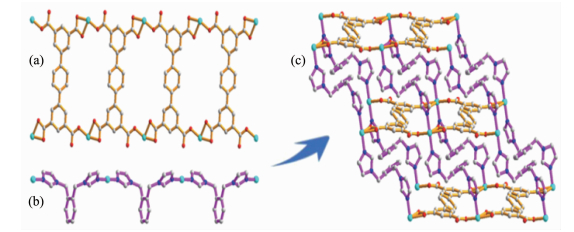
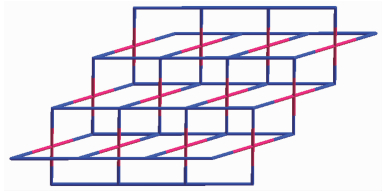
As shown in Fig. 2b, four carboxylate groups of the H4tcpb ligand adopt two different coordination patterns (bridging mode and chelating mode). The H4tcpb ligands link the Ni2+ ions to get an interesting 1D rectangle chain (Fig. 3a), while 1, 2-bimb ligands link with the Ni2+ ions to form a 1D [Ni(1, 2-bimb)]n linear chain (Fig. 3b). These two chains intertwine each other to form a 2D sheet by sharing metal centers (Fig. 3c). Finally, 3D supramolecular structure is formed through O5W-H5WA…O2 and O5W-H5WB…O4 hydrogen bonds interactions between the adjacent sheets (Fig. 4). Topological analysis indicates that the framework of 2 can be simplified to a new (4, 4)-c network with the point symbol of {4.64.8}2{42.64}, where H4tptc ligands and Ni2+ ions are taken as 4-connected nodes, respectively.

Hydrogen bonds are showed by dotted lines
To evaluate the phase purity of CPs, the PXRD patterns of the as-synthesized samples were analyzed at ambient temperature (Fig.S2). The key peaks of the experimental PXRD patterns were almost consistent with the simulated ones, indicating that the phase purity of CPs is good. The difference in strength may be caused by the preferred orientation of crystal powder samples.
As shown in Fig.S3, complex 1 exhibits a weightlessness of 1.76% (Calcd. 1.75%) below 159 ℃, which is attributed to the loss of a lattice water molecule. After that, its framework is stable below 400 ℃. As for 2, the first weight loss of 6.88% (Calcd. 6.74%) corresponds to the release of a lattice water and a coordinated water molecule under 196 ℃. The framework of 2 started to break down after 396 ℃.
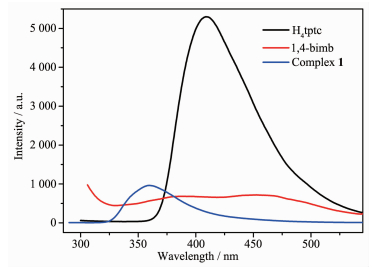
The luminescence properties of ligands (H4tptc and 1, 4-bimb) and complex 1 were measured under room temperature (Fig. 6). The emission spectra of H4tptc and 1, 4-bimb ligands were observed at 408 and 457 nm (λex=280 nm), respectively, which can be attributed to the π-π* and π*-n transition[27-31]. Further-more, compared with the emission bands of H4tptc and 1, 4-bimb, complex 1 was blue-shifted and exhibited an obvious emission maximum at 359 nm (λex=280 nm). This is due to structural changes in ligands because of coordination with metal ions, which greatly enhances the rigidity of CP and decreases the energy loss through radiation less decay[32].
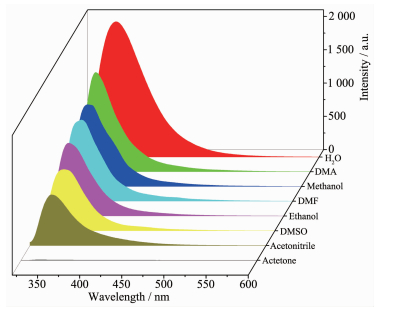
In addition, from the perspective of practical application, the luminescence sensing properties of 1 in common solvents are also investigated. The ground samples were dispersed in different solvents (2 mL), including H2O, DMA, DMF, methanol, acetonitrile, ethanol, acetone, DMSO, etc., by ultrasonic treatment for 30 min to obtain uniform 1@solvent suspensions. As exhibited in Fig. 7, the luminescence intensity of 1 depends on the types of the solvent. It is worth noting that 1 exhibited the strongest emission peak in H2O and the weakest emission in acetone, which may be the result of interaction between the network of CPs and solvent molecules with disparate polarities[33].
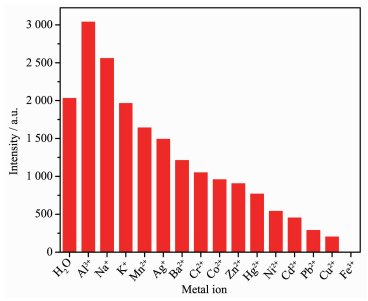
Furthermore, because of water stability of complex 1, luminescence sensing properties of 1 towards metal ions in aqueous solution were carried out. The finely ground sample of 1 was dispersed in M(NO3)x aqueous solutions (0.01 mol·L-1, M=Na+, Cd2+, K+, Cu2+, Pb2+, Ag+, Fe3+, Mn2+, Cr3+, Zn2+, Co2+, Ni2+, Ba2+, Al3+, Hg2+, Ni2+) to form 1@M suspensions treated by the ultrasonic for 30 min. As presented in Fig. 8, the luminescence intensity of 1 presents ion-dependent changes. Al3+ and Na+ ions enhanced its luminescence intensity, while the other cations reduced its luminescence intensities. Particularly, the luminescence intensity of 1 was almost completely quenched by Fe3+ ion, implying that 1 can be one of the luminescent probes sensing Fe3+ ion.
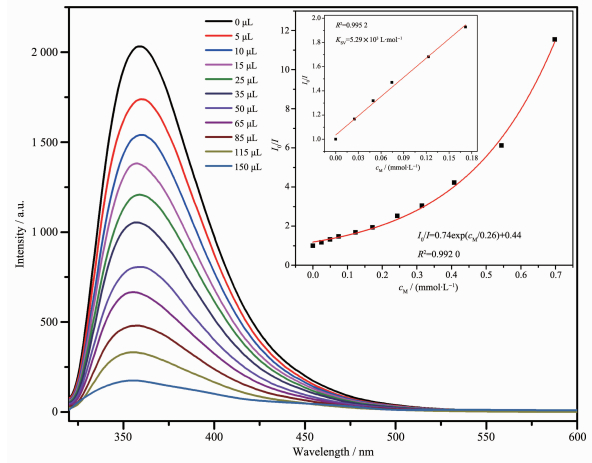
To test the sensitivity of 1 for sensing Fe3+ ion, the titration experiments were carried out. 2 mg crystal samples were dispersed in 3 mL aqueous solution to form 1@H2O suspensions, and then 30 μL Fe(NO3)3 solution (0.01 mol·L-1) was gradually added into the above suspensions at a time. As can be seen in Fig. 9, the luminescence intensity of 1@H2O suspension decreases gradually with the addition of Fe3+ ion. When the concentration of Fe3+ ion was 0.7 mmol·L-1, the luminescence intensity of 1 was almost completely quenched. The relationship between I0/I and the concentration of Fe3+ ion can be expressed by the equation of I0/I=0.74exp(cM/0.26)+0.44, where cM represents the concentration of Fe3+, I0 and I stand for luminescence intensities of 1@H2O and 1@Fe3+ suspen-sion, respectively. When the concentration of Fe3+ ion is low, the Stern-Volmer (S-V) curve can be expressed as a linear equation of I0/I=1+KsvcM (Fig. 9)[34]. The Ksv value of Fe3+ was 5.29×10³ L·mol-1. The detection limit was calculated by 3σ/Ksv to be as low as 4.63×10⁻⁴ mol·L-1 (σ is the standard deviations by measuring the blank solution for 5 times at room temperature).
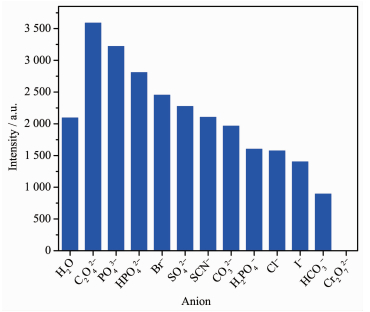
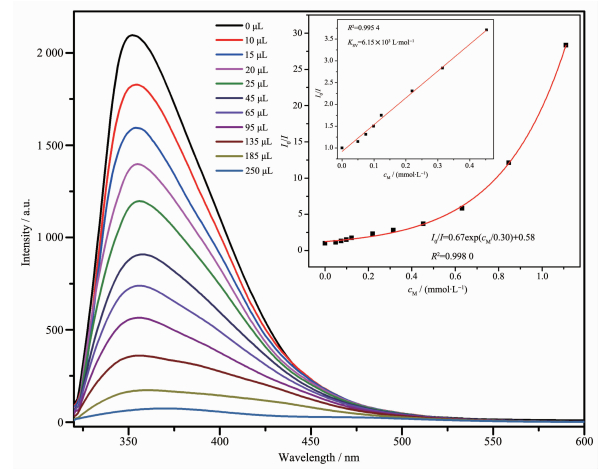
The luminescence experimental procedure of anions is similar to that of cations except substituting M(NO3)x with KnX (0.01 mol·L-1, X=Cr2O72-, HPO42-, SCN-, CO32-, H2PO4-, I-, HCO3-, PO43-, Br-, SCN-, SO42-, H2PO4- and Cl-). As exhibited in Fig. 10, compared to other anions, Cr2O72- ion has the remarkable quenching effect to the luminescence of 1. Similarly, the titration experiment of Cr2O72- anion is shown in Fig. 11, and the S-V curve is linear at low concentration and gradually deviated from linearity with the increasing of Cr2O72- concentration. The quenching constant (KSV) was calculated to be 6.15×10³ L·mol-1, which was higher than that of the reported MOFs for sensing Cr2O72- ions (Table S2)[35-36].
In order to explore the mechanism of lumine-scence quenching, PXRD patterns of samples were measured before and after luminescence experiment, and the results showed that PXRD patterns of samples after luminescence experiment were almost identical with those of the original ones, which indicates that the structural collapse of complex is not the cause of luminescence quenching (Fig.S4). Furthermore, the UV-Vis absorption spectra (Fig.S5) showed that there were the partial overlap between the excitation band of 1 and the absorption band of Fe3+/Cr2O72- ions, which shows the competitive absorption of energy between the frameworks and that Fe3+/Cr2O72- ions is responsible for luminescence quenching[37].
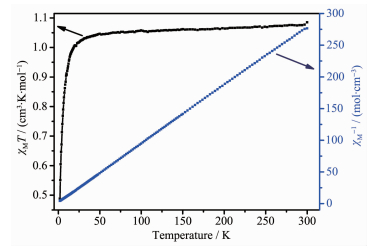
The direct-current (dc) magnetic susceptibility of 2 was measured in a temperature range of 2~300 K under a 1 000 Oe applied field. As exhibited in Fig. 12, the χMT value is 1.08 cm3·K·mol-1 at room temperature, which is close to the theoretical value of 1.0 cm3·K·mol-1 for one isolated Ni2+ ion (S=1, g=2.0). The χMT value decreased slowly to 0.49 cm3·K·mol-1 at 30 K, and then decreased sharply, which may be attributed to the antiferromagnetic interaction between Ni2+ ions. Furthermore, the curve of the reciprocal susceptibilities ( χM-1) vs T was well fitted by the Curie-Weiss law: χMT=C/(T-θ), which gave C=1.07 cm3·K·mol-1 and θ=-2.68 K in a temperature range of 50~300 K, confirming the antiferromagnetic interaction between Ni2+ ions.
In short, two new CPs have been successfully synthesized by utilizing the mixed ligands strategy. Complex 1 shows a 3D network with the point symbol of (86), and complex 2 is a 3D supramolecular archit-ecture formed by the H-bond interaction between the adjacent 2D layers. Furthermore, the luminescence properties show that 1 has good sensing selectivity for Fe3+/Cr2O72- ions in aqueous solution, which indicates 1 has potential application in the detection of Fe3+ and Cr2O72- ions. Moreover, magnetic measurements indicate that there is the antiferromagnetic interaction between Ni2+ ions in 2.
Supporting information is available at http://www.wjhxxb.cn
Duan J, Jin W, Kitagawa S. Coord Chem Rev., 2017, 332:48-74 doi: 10.1016/j.ccr.2016.11.004
Zhang Y B, Zhang W X, Feng F Y, et al. Angew. Chem. Int. Ed., 2009, 48(29):5287-5290 doi: 10.1002/anie.200901964
Samaddar P, Son Y S, Tsang D C W, et al. Coord. Chem. Rev., 2018, 368:93-114 doi: 10.1016/j.ccr.2018.04.013
Zhang S F, Xiong F, He Z, et al. Polyhedron., 2015, 102:401-409 doi: 10.1016/j.poly.2015.08.040
杨冰冰, 赵丰, 许胜先, 等.无机化学学报, 2019, 35(6):1020-1026 http://www.cqvip.com/QK/93659X/201906/7002102972.htmlYANG Bing-Bing, ZHAO Feng, XU Sheng-Xian, et al. Chinese J. Inorg. Chem., 2019, 35(6):1020-1026 http://www.cqvip.com/QK/93659X/201906/7002102972.html
Xu L H, Fang G Z, Liu J F, et al. J. Mater. Chem. A, 2016, 4:15880-15887 doi: 10.1039/C6TA06403E
任丽磊, 彭晓霞, 王树军, 等.无机化学学报, 2019, 35(6):965-970 http://www.cqvip.com/QK/93659X/201906/7002102965.htmlREN Li-Lei, PENG Xiao-Xia, WANG Shu-Jun, et al. Chinese J. Inorg. Chem., 2019, 35(6):965-970 http://www.cqvip.com/QK/93659X/201906/7002102965.html
Sun D, Liu F J, Huang R B, et al. CrystEngComm, 2012, 14:7872-7876 doi: 10.1039/c2ce26161h
Luo X, Zhang X, Duan Y L, et al. Dalton Trans., 2017, 46(19):6303-6311 doi: 10.1039/C7DT00715A
Cui P P, Zhao Y, Zhang X D, et al. Dyes Pigm., 2016, 124:241-248 doi: 10.1016/j.dyepig.2015.09.024
Zhang X T, Fan L M, Fan W L, et al. Inorg. Chem. Acta, 2016, 441:146-151 doi: 10.1016/j.ica.2015.10.033
Mukherjee S, Gole B, Song Y, et al. Inorg Chem., 2011, 50(8):3621-3631 doi: 10.1021/ic102580a
Xie M H, Yang X L, Wu C D. Chem. Commun., 2011, 47(19):5521-5523 doi: 10.1039/c1cc10461f
Manna K, Zhang T, Carboni M, et al. J. Am. Chem. Soc., 2014, 136(38):13182-13185 doi: 10.1021/ja507947d
Lohar S, Banerjee A, Sahana A, et al. Anal. Methods, 2013, 5(2):442-445 doi: 10.1039/C2AY26224J
Sun X, Wang Y, Lei Y, et al. Chem. Soc. Rev., 2015, 44(22):8019-8061 doi: 10.1039/C5CS00496A
Zhou X, Lee S, Xu Z, et al. Chem. Rev., 2015, 115(15):7944-8000 doi: 10.1021/cr500567r
Bobbitt N S, Mendonca M L, Howarth A J, et al. Chem. Soc. Rev., 2017, 46:3357-3385 doi: 10.1039/C7CS00108H
Liu B B, Lin X L, Li H, et al. Cryst. Growth Des., 2015, 15:4355-4362 doi: 10.1021/acs.cgd.5b00648
Hu F L, Shi Y X, Chen H H, et al. Dalton Trans., 2015, 44(43):18795-18803 doi: 10.1039/C5DT03094C
Chen Z, Sun Y W, Zhang L L, et al. Chem. Commun., 2013, 49:11557-11559 doi: 10.1039/c3cc46613b
Thompson C M, Kirman C R, Proctor D M, et al. J. Appl. Toxicol., 2014, 34(5):525-536 doi: 10.1002/jat.2907
Wang C C, Li H Y, Guo G L, et al. Transition Met. Chem., 2013, 38(3):275-282 doi: 10.1007/s11243-012-9688-y
Sheldrick G M. SADABS, Ver.2.05, University of Göttingen, Germany, 1996.
Sheldrick G M. SHELXS-97, Program for Crystal Structure Refinement, University of Göttingen, Germany, 1997.
Sarkisov L, Martin R L, Haranczyk M, et al. J. Am. Chem. Soc., 2014, 136(6):2228-2231 doi: 10.1021/ja411673b
Su Z, Fan J, Okamura T. Cryst. Growth Des., 2010, 10(4):1911-1922 doi: 10.1021/cg100020t
Wudkewych M J, Laduca R L. Polyhedron, 2016, 114:72-79 doi: 10.1016/j.poly.2015.10.011
Yang X F, Zhu H B, Liu M. Polyhedron, 2017, 128:18-29 doi: 10.1016/j.poly.2017.02.041
Hong M M, Liu A F, Xu Y, et al. Chin. Chem. Lett., 2016, 27:989-992 doi: 10.1016/j.cclet.2016.03.027
沙秋月, 袁雪梅, 王小雨, 等.无机化学学报, 2016, 32(7):1293-1302 http://www.cqvip.com/QK/93659X/201607/669428287.htmlSHA Qiu-Yue, YUAN Xue-Mei, WANG Xiao-Yu, et al. Chinese J. Inorg. Chem., 2016, 32(7):1293-1302 http://www.cqvip.com/QK/93659X/201607/669428287.html
Li Z H, Xue L P, Li S H. CrystEngComm, 2013, 15(14):2745-2754 doi: 10.1039/c3ce26686a
Zeng G, Xing S, Wang X, et al. Inorg. Chem., 2016, 55(3):1089-1095 doi: 10.1021/acs.inorgchem.5b02193
Zhang X, Wang Z J, Chen S G, et al. Dalton Trans., 2017, 46(7):2332-2338 doi: 10.1039/C6DT04675D
Cao C, Hu H C, Qiao W Z, et al. CrystEngComm, 2016, 18(23):4445-4451 doi: 10.1039/C5CE02568K
Parmar B, Rachuri Y, Bisht K K, et al. Inorg. Chem., 2017, 56(5):2627-2638 doi: 10.1021/acs.inorgchem.6b02810
Wen R M, Han S D, Ren G J, et al. Dalton Trans., 2015, 44(24):10914-10917 doi: 10.1039/C4DT02445A

Figure 1 (a) Coordination environment of Zn2+ ions in 1; (b) 2D network of 1 based on Zn2+ ion and tptc4- observed along a-axis; (c) 3D structure of 1 viewed along a-axis; (d) Overall topological network for complex 1
Symmetry codes: ⅰ 2-x, -0.5+y, 1-z; ⅱ 3+x, y, 1+z; ⅲ 1-x, 0.5+y, -z; ⅳ-3+x, 1+y, z

Figure 2 (a) Coordination environment of Ni2+ ions in 2; (b) Coordination mode of the H4tcpb ligand in complex 2
Symmetry codes: ⅰ x, -1+y, z; ⅱ 1+x, 1+y, z; ⅴ 1-x, 3-y, 2-z

Figure 3 (a) One dimensional rectangle chain based on H4tcpb and Ni2+ ions; (b) 1D [Ni(1, 2-bimb)]n linear chain constructed by 1, 2-bimb ligands and Ni2+ ions; (c) View of the 2D network of 2

Figure 4 Hydrogen bonds between adjacent 2D layers of 2
Hydrogen bonds are showed by dotted lines

Figure 5 Schematic diagram of the 4, 4-connected net of 2 with the point symbol of{4.64.8}2{42.64}

Figure 7 Luminescence intensities of complex 1 scattered in different organic solvents

Figure 9 Influence of the addition of Fe3+ ions on the emission spectra of 1 dispersed in water solution

Figure 10 Luminescence intensity of complex 1 in aqueous solution containing different anions

Figure 11 Influence of the addition of Cr2O72- ions on the emission spectra of 1 dispersed in water solution
Table 1. Crystal structure data and refinement parameters of 1 and 2
| 1 | 2 | |
| Empirical formula | C50H40N8O9Zn2 | C25H21N4NiO5 |
| Formula weight | 1 027.64 | 516.17 |
| Temperature/K | 296.15 | 298(2) |
| Crystal system | Monoclinic | Triclinic |
| Space group | P21 | P1 |
| a/nm | 0.735 9(7) | 0.907 7(3) |
| b/nm | 1.901 7(18) | 1.009 8(4) |
| c/nm | 1.610 0(15) | 1.717 9(6) |
| α/(°) | 94.964(3) | |
| β/(°) | 94.683(11) | 103.998(3) |
| γ/(°) | 108.727(3) | |
| Volume/nm3 | 2.246(4) | 1.423 7(9) |
| Z | 2 | 2 |
| Dc/(g·cm-3) | 1.520 | 1.204 |
| μ/mm-1 | 1.137 | 0.718 |
| F(000) | 1 056.0 | 534.0 |
| 2θ range for data collection/(°) | 5.078~49.998 | 4.944~55.426 |
| Reflection collected | 11 712 | 19 215 |
| Independent reflection | 4 988 | 6 581 |
| Rint | 0.092 8 | 0.053 1 |
| Data, restraint, parameter | 4 988, 1, 623 | 6 581, 0, 336 |
| Goodness-of-fit on F2 | 1.051 | 1.023 |
| R1, wR2 [I≥2σ(I)] | 0.061 9, 0.113 2 | 0.040 7, 0.093 0 |
| R1, wR2 (all data) | 0.110 3, 0.132 8 | 0.058 5, 0.099 4 |
 下载: 导出CSV

 扫一扫看文章

扫一扫关注我们