
Scheme 1.
Schematic illustration for the preparation of MSNs-FITC and cell uptake
Synthesis of Fluorescent Mesoporous Silica Nanoparticles and Application for Intracellular Drug Delivery
Min-Min CHEN , Hao-Ran GENG , Jin-Xia HU , Qiong ZHANG , Amfo Agyekum Godfred , Zhuo-Qi ZHANG , Xi-Chuan CAO

Cancer remains a major cause of death in most countries in the world and the incidence of cancer increases with age[1]. To achieve the efficacy, the traditional chemo-therapy requires high doses of cancer drug reaching the tumor site through the blood circulation. For one thing, the drug utilization is very low, for another, high cytotoxicity of the drug always causes serious side effects in the normal tissue site. Thus, ideal drug delivery systems (DDSs) are sought much needed. As one of the DDSs to treat cancer, nanotherapeutic systems can protect the drug from releasing prematurely. In addition, they have other unique advantages: increased stability of anti-cancer drugs in blood, decreased non-specific toxicity, and easy modification of particle surface for targeting systems[2-4]. To date, plentiful nanotherapeutic systems have been developed and exemplified regarding traditional systems such as liposomes[5-6], polymer-based therapeutics[7-8], carbon nanotubes[9], and silica particles[10-11] etc.
Since Vallet-Regí et al.[12] firstly reported MCM-41 mesoporous silica as drug carrier of ibuprofen for controlled release in the year of 2001, mesoporous silica nanoparticles (MSNs) have opened up new and exciting possibilities in the field of cancer cure[13-17]. Silica has been approved by the United State Food and Drug Administration (US FDA) as "Generally Recognised As Safe" and by the European Union (EU) for its use in cosmetics and food additives[18]. In particular, the applications of MSNs in drug delivery have been intensively focused. MSNs possess several attractive features such as large surface area with abundant activity of Si-OH, which could easily immobilize various functional materials in the external surface of the MSNs before surfactant removal to generate multifunctional nanomedical platforms for multimodal imaging or simultaneous diagnosis and therapy[19-21]. On the other hand, mesoporous silica nanoparticles are solid materials which are comprised of a honeycomb-like rigid porous structure with hundreds of empty channels (mesopores) that are able to absorb/encapsulate relatively large amounts of therapy drug molecules under mild conditions. Furthermore, the MSNs also have the ability to effectively protect the entrapped molecules from premature release and degradation due to their excellent bio-stability under physiological conditions[22]. As a result of their excellent biocompatibility, modifiable external surface with abundant Si-OH, large surface area, high pore volume, and adjustable pore size, MSNs are developed to be one of the most important candidates for drug carriers[23-27].
In this contribution, MSNs functionalized orderly with amino groups and FITC were prepared as shown in Scheme 1. The weak base type drug doxorubicin (DOX), a classic anticancer drug in clinic, was used as the model drug to assess the drug loading and releasing behaviors of the carriers. The in vitro cellular cytotoxicity test was performed to evaluate the biocompatibility of MSNs-FITC, and the cytotoxic effect of DOX@MSNs-FITC to Hela cells was also investigated. Cell uptake of MSNs was monitored by CLSM and Flow Cytometry (FCM). The results reported here support the potential of amino-functionalized MSNs as a nanocarrier for simultaneous controlled drug release based on the low pH value in cancer/tumors and fluorescent bioimaging.
Cetyltrimethyl ammonium chloride (CTAC, 98%), tetraethylorthosilicate (TEOS, 99%), and diethanola-mine (DEA, 98%) were obtained from Shanghai Chemical Reagents Company (Shanghai, China). Doxorubicin (DOX) and [3-(2-aminoethyl)aminopropyl]trimethoxysilane (APTES) were purchased from Sigma-Aldrich (America). Fluorescein isothiocyanate (FITC) was purchased from Alfa Aesar (America). Hela cells were obtained from Chinese Academy of Sciences Cells Bank (Shanghai, China). Phosphate-buffered saline (PBS), 3-(4, 5-dimethylthiazol-2-yl)-2, 5-diphenyltetrazo-lium bromide (MTT) and 2-(4-amidinophenyl)-6-indo-lecarbamidine dihydrochloride (DAPI) were purchased from Beyotime (Shanghai, China). Dulbeccos modified Eagle medium (DMEM), fetal bovine serum (FBS), penicillinstreptomycin solution and Trypsin-EDTA solution were obtained from Gibco (America). All the chemicals were of analytical grade and used without further treatment. All solutions were prepared and diluted using ultrapure water from the Millipore Milli-Q system.
The morphology and structure of MSNs samples were characterized via transmission electron microscopy (TEM) and scanning electron microscope (SEM). TEM micrographs were obtained on a FEI Tecnai G2S-Twin microscope with a field emission gun operating at 200 kV. SEM micrographs were obtained on a JEOL JSM-6700F microscope with acceleration voltage of 10 kV. Powder X-ray diffraction (XRD) patterns were recorded on a Rigaku D/Max 2550 X-ray diffractometer with Cu Kα radiation (40 kV, 20 mA) at λ=0.154 18 nm with a scanning rate of 1°·min-1 over a range of 0.8°~6.0° (2θ) with a step width of 0.02°. The pore chara-cteristics of the samples were studied by determining the nitrogen adsorption using a Micromeritics ASAP 2020M system. Their surface area was calculated by the Brunauer-Emmett-Teller (BET) approach and the pore size distributions were obtained by the Barrett-Joyner-Halenda (BJH) method. FTIR measurement was recorded on a Bruker IFS 66V/S FTIR spectrometer using KBr pellets as background. UV-Vis absorption spectra were performed using a Thermo EV-60 spectro-photometer in the range between 1 000 and 300 nm. Intracellular tracking was subjected to be observed with FV1000 confocal laser scanning microscopy. Transfer capability was recorded by BD FACS Calibur Flow cytometry.
MSNs were synthesized with the sol-gel method. The following is a typical synthesis example: 6.4 mL water (0.36 mol), 0.9 g ethanol (0.015 mol), 1.04 g of a 25%(w/w) CTAC solution (0.786 mmol), and 0.02 g DEA (0.19 mmol) were mixed and stirred vigorously at 40 ℃ for 30 min. Then 0.73 mL TEOS (3.25 mmol) was added dropwise into the above solution within 2 min and the mixture was continously under stirring for another 2 h. Finally, with the resulting white solution being cooled to room temperature, the particles (denoted as CTAC/MSNs) were collected by centrifuga-tion and washed several times by water and methanol alternately. The surfactant CTAC was then removed by reflux in a mixture of 70 mL methanol and 0.70 mL concentrated 37.2%(w/w) HCl at 80 ℃ for 6 h. The resulting particles (denoted as MSNs) were then collected in the same way as CTAC/MSNs.
A typical synthesis procedure was depicted as following: 1 mg FITC was reacted with 5 μL APTES in 1 mL absolute ethanol by stirring for 24 h in darkness at room temperature to obtain the FITC-conjugated APTES (APTES-FITC). Then 20 μL APTES-FITC was mixed with the as-synthesized CTAC/MSNs for further 2 h stirring in darkness at 40 ℃. The solution was cooled to room temperature and collected by centrifugation (denoted as CTAC/MSNs-FITC). Similarly, the surfactant-free particles (denoted as MSNs-FITC) were obtained by extraction as mentioned above.
DOX was used as a model drug molecules agent to evaluate the drug loading and releasing manner. Typically, 4 mg MSNs-FITC were immersed in 4 mL buffered solution at pH of 7.4 containing 560 μg DOX. After stirring for 24 h under light-sealed conditions, the mixture was centrifuged and the supernatant was removed. The DOX@MSNs-FITC were obtained and washed twice with PBS solution to wash away the DOX adsorbed on the external surface. The supernatant solution concentration was calculated based on absorbance intensity at 483 nm via UV-Vis spectroscopy (Thermo EV-60, American). DOX loading capacity (Cload) and entrapment efficiency (ηentrapment) in the nanoparticles were calculated by the following equations:
|
$ {C_{{\rm{load }}}} = \frac{{{M_{{\rm{load }}}}}}{{{M_{{\rm{nanoparticles }}}}}} \times 100\% $ |
|
$ {\eta _{{\rm{entrapment }}}} = \frac{{{M_{{\rm{load }}}}}}{{{M_{{\rm{feed }}}}}} \times 100\% $ |
Where Mload is the mass of DOX loaded into nano-particles (mg), Mnanoparticles is the mass of nanoparticles (g), Mfeed is the mass of DOX in feed (mg).
The release kinetics of DOX from DOX@MSNs-FITC were carried out in phosphate buffered saline (PBS) at 37 ℃ and shaken at 120 r·min-1. 4 mg DOX@MSNs-FITC were dispersed in 4 mL PBS (pH=7.4, 5.5, and 4.6, respectively), followed by 1 mL of solution collected at timed intervals. The volume of the release medium kept constant by adding 1 mL fresh medium after each sampling. The released DOX was analyzed by UV-Vis. The releasing efficiency (ηrelease) was calculated by the following equations:
|
$ {\eta _{{\rm{release }}}} = \frac{{{M_{{\rm{release }}}}}}{{{M_{{\rm{load }}}}}} \times 100\% $ |
Where Mrelease is the mass of DOX in the release medium (mg).
Hela cells were cultured as a monolayer in DMEM medium supplemented with 10% (V/V) FBS at 37 ℃ in a humidified incubator (5%(V/V) CO2 in air). The MTT assay was used to measure cell viability. Briefly, cells were seeded in 96-well plates at a density of 1×10⁴ cells per well and four duplicate wells were set up in each sample. After incubation for 24 h at 37 ℃ in 100 μL DMEM medium containing 10% FBS, culture medium was discarded and then cells were treated with free DOX, DOX@MSNs-FITC or blank MSNs-FITC at various concentrations. After incubation for 24 h, 20 μL of MTT solution (5 mg·mL-1) was added to each well and the plate was incubated in the CO2 incubator for an additional 4 h. The precipitated formazan violet crystals were dissolved in 150 μL of DMSO. The optical density (OD) value of each individual well was calculated using a spectrophotometer (Thermo MK3, American) at 570 nm absorbance. With untreated cells in medium used as a control and corresponding groups without cells used as blanks, all experiments were carried out with four replicates.
The Hela cells were seeded into 24-well plates at a density of 3×10⁴ cells per well respectively. After a 24 h incubation period, the cells were treated with MSNs-FITC at various concentrations for 4 h. Then culture medium was removed, cells were swashed with PBS three times. After the removal of supernatants, the cells were fixed with 4% (w/V, g·mL-1) paraformal-dehyde for 30 min. Subsequently, the slides were rinsed with PBS three times and the cells were stained with DAPI for 10 min. Finally, the intracellular localizations of MSNs-FITC were directly visualized with CLSM. In the assay, all experiments were carried out under a light-sealed condition.
FCM was used to demonstrate the transfer capability of the MSNs-FITC nanoparticles into cells. Hela cells were seeded into a 6-well plate (5×10⁵ cells per well), and cultured for 24 h, then treated with MSNs-FITC at various concentrations with the untreated cells used as blank control. After incubating for 4 h, the media was removed, and the cells were swashed twice with PBS buffer to remove residual nanoparticles. Then, with the cells being harvested with 0.25% (V/V) trypsin solution, washed with PBS buffer three times, and finally suspended in PBS, the signals of FITC fluorescence were recorded by FCM. In the assay, all experiments were carried out under a light-sealed condition to avoid photo bleaching.
The MSNs were synthesized using a base-catalyzed sol-gel method with TEOS as the silica precursor, the CTAC surfactant as the template and Diethanolamine as the catalyst. The MSNs were then functionalized with FITC by one-pot procedure grafting to obtain the APTES-FITC functionalized MSNs. The size and pore structure of the MSNs-FITC were characterized by SEM, TEM, FT-IR and N2 adsorption-desorption test.
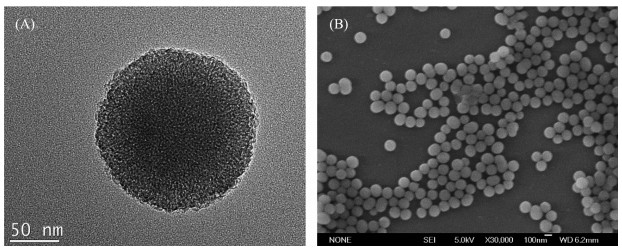
TEM image showed MSNs-FITC as rough spheres with an average size of approximately 150 nm in diameter (Fig. 1A). The SEM image also showed that the spherical MSNs-FITC were well dispersed without any obvious aggregation (Fig. 1B).
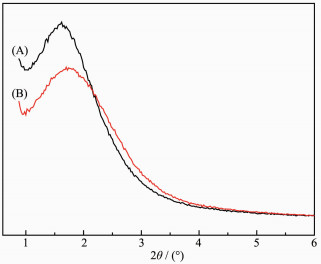
The pore structure of MSNs before and after the functionalization was examined using small-angle powder XRD. Both MSNs and MSNs-FITC showed two broad peaks which suggested short-range ordering and a wormlike pore structure inside the nanoparticles. It could be revealed that the fluorescence groups were functionalized on MSNs successfully as a result of the decrease in intensity and slight change in the position of the peaks.
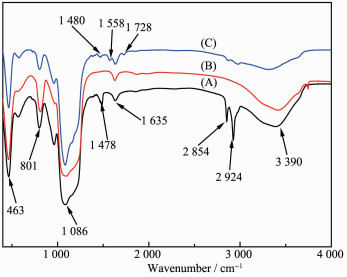
In order to form mesoporous structure, CTAC surfactants in the pore had to be removed by extraction. In addition, the residual CTAC surfactants would bring cytotoxicity and decreased the biocompatibility of carriers. As shown in the FT-IR spectra of CTAC/MSNs (Fig. 3A), owing to the large amount of CTAC present in the channel, CTAC/MSNs gave the characteristic C-H stretching vibrations at 2 924 and 2 854 cm-1, and C-H deformation vibration around 1 478 cm-1 [28]. After removal of CTAC, these C-H peaks derived from CTAC disappeared, suggesting that the CTAC molecules had been removed successfully (Fig. 3B). Peaks at 3 390 and 1 635 cm-1 were assigned to H-O-H groups present on the surface of MSNs or due to water molecules adsorbed[29]. The peaks at 1 086, 801 and 463 cm-1 were all characteristic absorbance bands of silica, and corresponded to Si-O-Si asymmetric stretching, Si-O-Si symmetric stretching and Si-O-Si bending, respectively[30]. However, the MSNs-FITC showed the C-H bonds at 2 924, 2 854, 1 480 cm-1 again and C=O bonds at 1 728 cm-1 [31] after further grafting APTES-FITC (Fig. 3C). Furthermore, a clear IR peak centered at 1 558 cm-1 appeared and could be assigned to the N-H bonds[32], which revealed that the functionalization of fluorescence groups was successful.
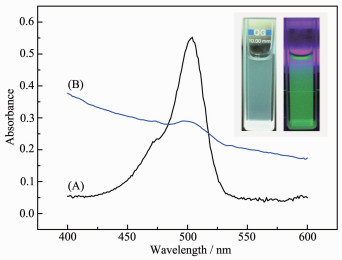
To further verify the successful grafting of FITC on the MSNs, UV-Vis absorption spectroscopy was utilized as shown in Fig. 4, which displayed that the successfully FITC-conjuncted with APTES (APTES-FITC) in water exhibited the main absorption bands at 496 nm (Fig. 4A). This band was also present in the spectrum of MSNs-FITC (Fig. 4B), indicating a successful conjugation of FITC on MSNs successfully, which also can be proved by the strong green fluorescence of MSNs-FITC irradiated with UV lamp (right), but no fluorescence irradiated with white lamp (left) in the inset photographs.
Insets are photographs of MSNs-FITC dispersed in PBS under white light (left), and MSNs-FITC dispersed in PBS under UV light (right) situations
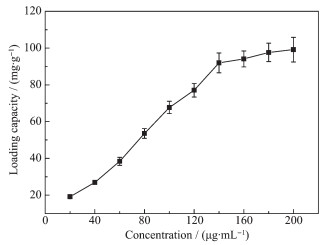
To evaluate the drug loading capacity and releasing behaviour of MSNs-FITC, a classic water-soluble anticancer drug DOX was used as a model drug. The nanocarrier was loaded with DOX by soaking them in a concentrated drug-PBS solution at pH value of 7.4, then collected by centrifugation and washed with PBS several times. UV-Vis spectroscopy was used to determine the DOX loading capacity and release properties. As shown in Fig. 5, the DOX was loaded in nanocarrier with different concentrations, the drug loading content increased along with the increase of the DOX concentration. When the conce-ntration was less than 140 μg·mL-1, the drug loading content quickly increased, and DOX loading capacity and entrapment efficiency reached 91.96 mg·g-1 (8.42%(w/w)) and 65.7% at the concentration of 140 μg·mL-1. But it increased slowly once the concentra-tion was between 140 and 180 μg·mL-1. Moreover, with the concentration raising to 180 and 200 μg·mL-1, the loading capacity hardly increased and approxi-mately reached saturation, which demonstrated that the continuously increased concentration would not lead to increased encapsulation efficiency.
Results are expressed as mean ± the standard error from three independent experiments
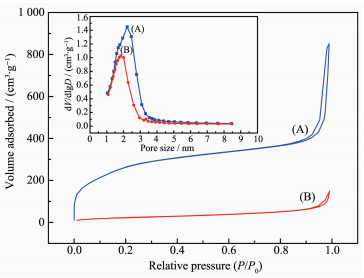
To prove that the DOX molecules could penetrate into the hole of mesopores of the MSNs-FITC, BET analysis was also carried out as shown in Fig. 6. The specific surface area and cumulative pore volume of the nude MSNs-FITC were calculated to be 861 m2·g-1 and 1.48 cm3·g-1. However, after drug loading, the values of calculated specific surface area and cumula-tive pore volume of the materials decreased to about 148 m2·g-1 and 0.99 cm3·g-1, respectively. Further-more, the average pore size measured before and after the DOX loading were 2.2 and 1.8 nm respectively. As the results clearly indicated, the BET surface area, pore volume, and pore diameter of MSNs-FITC were all decreased significantly after the loading of DOX, suggesting the DOX molecules had penetrated into the nanopores.
Inset: corresponding pore size distributions
The studies of DOX released from DOX@MSNs-FITC were conducted under different PBS buffer solutions at pH values of 7.4, 5.5, as well as 4.6 at 37 ℃. The in vitro cumulative drug release profiles over a period of 48 h were shown in Fig. 7. The results demonstrated that the DOX release performance was obviously pH dependent and cumulative release amount increased with the decrease of pH. At pH value of 7.4, the release amount was quite low and only approximately 38%(w/w) was released in 24 h. At pH value of 5.5, the release amount gradually increased to 71%(w/w) in 24 h and exhibited relatively faster release rate. Subsequently, when pH value decreased to 4.6, a faster release behavior was obtained and the release amount reached 89%(w/w) in 24 h. This is because the drug release was mainly determined by the effect of electrostatic interaction between DOX molecules and the nanoparticles surface. It is known that the pKa of DOX is 8.3 adjacently, so most amine groups of DOX exist as protonated forms (-NH3+ forms) in the range of pH values examined here[33]. On the other hand, the pKa of Si-OH on the internal surface of MSNs ranged from 4 to 5. It means that the higher the pH value of the medium was, the more negative charges were on the internal surface of the mesopores, the stronger attraction existed between the positively charged DOX and the negatively charged carriers, so the more difficult for the loaded DOX to be released out of the nanoparticles[34-35]. It is well documented that pH values in different tissues and cellular compartments vary significantly. For example, the tumor extracellular environment is more acidic (pH=6.8) than blood and normal tissues (pH=7.4), and the pH values of late endosome and lysosome are even lower, at 5.0~5.5[36-37]. So the sustained release properties are favorable for increased drug accumula-tion in the cytoplasm of cancer cells following endocy-tosis and reduced drug release from the carriers in normal tissue, and can thus enhance the long-term chemotherapy efficacy and reduce non-specificity toxicity.
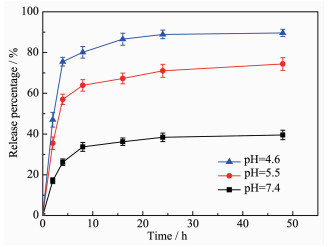
Results are expressed as mean ± the standard error from three independent experiments
An efficient drug delivery system should not only have sustained release properties, but also possess favorable biocompatibility. The in vitro cytotoxicity in Hela cells was investigated by MTT assay as shown in Fig. 8. The blank MSNs-FITC had a negligible cytotoxicity after being cultured with Hela cells for 24 h, even at concentrations as high as 100 μg·mL-1. The well biocompatible on Hela cells could be attributed to the relatively low concentration of the surfactants in MSNs-FITC. To further demonstrate the pharmacolo-gical activity of the DOX@MSNs-FITC, their cytotoxic effects were also tested. Conversely, when the Hela cells were treated with either free DOX solution or the suspension of DOX@MSNs-FITC with equal DOX dosage, the result exhibited increased cytotoxicity with the increase of the concentration of the DOX. But DOX@MSNs-FITC showed stronger effect on killing tumor cells than free DOX at the same dosage[38-39]. This may be because the carrier loading DOX is more biocompatible than the free DOX, so it can easily disguise as harmless substances to enter the cells by endocytosis. Once the carrier entered into the cytoplasm of the cell, it began to release the loading drug molecules due to the acidic surroundings thereby causing more cell death as a result of the high intracellular concentration of DOX. Free DOX will be excluded in the process of endocytosis thereby causing less cell death due to the low intracellular concentra-tion of DOX. Therefore, it could be concluded that MSNs-FITC have been a promising potential candidate for drug loading and delivery in cancer therapy.
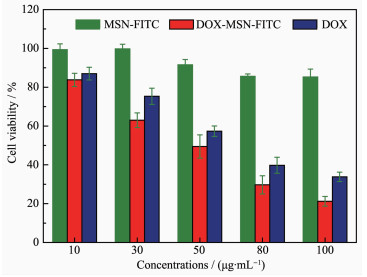
Results are expressed as means ± the standard error from three independent experiments
Effective endocytosis of the nanocarriers by cancer cell is a critical role for intracellular drug delivery. CLSM analysis was performed to examine the cellular endocytosis and sequential distribution of nanocarriers. Fig. 9 showed the CLSM images of Hela cells cultivated with different MSNs-FITC concentra-tions at 50, 80 and 100 μg·mL-1. To confirm the efficient uptake of the nanocarriers by cancer cells, different concentrations of MSNs-FITC were incubated with Hela cells in DMEM at 37 ℃ for 4 h. The blue regions represent the signal from the nucleus stained with DAPI, and the green regions are the signal from FITC. The green fluorescence could be observed clearly in almost all of the cells from the CLSM images and distributed around nucleus intensively, demonstrating that these nanocarriers could penetrate the plasma membrane of Hela cells and transferred into the cytoplasm with high efficiency. Moreover, the intensity of green fluorescence could be obviously recognized after incubation at 100 μg·mL-1, which was stronger than that incubated at 50 μg·mL-1, suggesting the dose-dependent endocytosis by Hela cells[40]. This evidence visually confirms that MSNs-FITC can be used as a transmembrane delivery carrier for potential drug delivery and as a fluorescent tracer for live cell imaging with realtime monitoring properties.
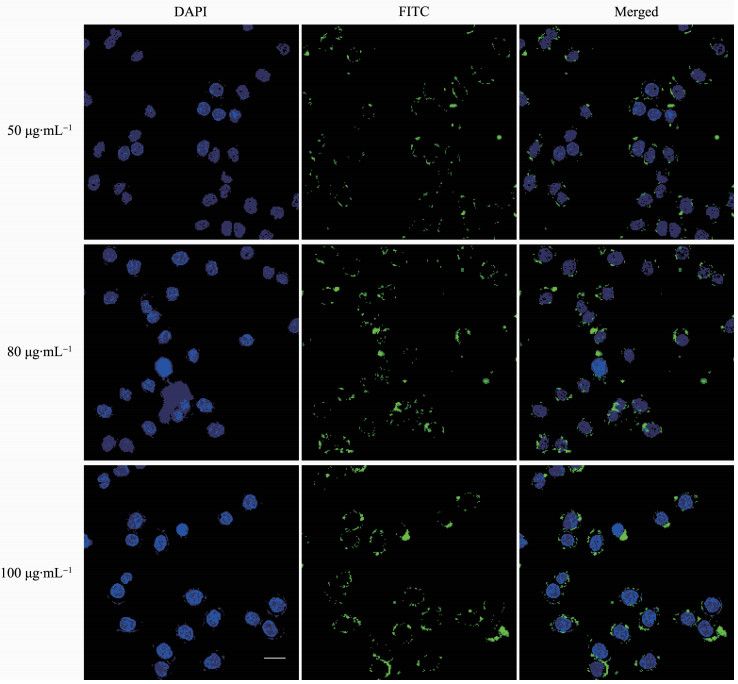
Blue fluorescence shows nuclei stained with DAPI. Green fluorescence shows the location of MSNs-FITC. The scale bar is 20 μm
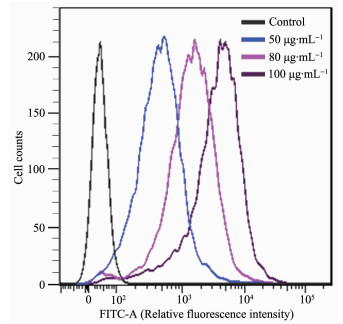
Dose-depended internalization of MSNs-FITC was further investigated by FCM analysis. Fig. 10 showed FCM histogram profiles of Hela cells treated with different concentrations of MSNs-FITC at 50, 80 and 100 μg·mL-1, respectively. Meanwhile, the FCM histogram profiles of Hela cells showed quantifica-tionally the changes of fluorescence intensity. It is clear that the fluorescence intensity increased obviously with increased concentrations of MSNs-FITC, which was consistent with the data of CLSM analysis, indicating effectively dose-depended internalization of MSNs-FITC.
In summary, a drug delivery system mesoporous silica nanoparticles were prepared via a base-catalyzed sol-gel method. The well-defined nano-particles were confirmed by the results from SEM, TEM, FTIR, BET, and UV-Vis spectra. DOX was applied as model drug to investigate drug loading and releasing behaviors. The nanoparticles possessed both high loading capacity (8.42%(w/w)) and encapsulation efficiency (65.7%). The cumulative release of DOX@ MSNs-FITC showed a low leakage at pH value of 7.4 with only 38% amount being released after 24 h while significantly enhanced to 89% at pH value of 4.6. These results demonstrated that the drug release system was pH dependent apparently. The MTT cytotoxicity assay confirmed that the blank nanocarrier MSNs-FITC were almost non cytotoxicity on Hela cells even at 100 μg·mL-1 after incubation for 24 h. CLSM analysis demonstrated that these can penetrate the plasma membrane of Hela cells and transfer into the cytoplasm with high efficiency. FCM analysis indicated the internalization of nanocarriers was dose-depended. For further applications, the outermost surface of the MSNs-FITC should also be modified with pH-responsive ligands (e.g., polymer, supramolecular assemblies or inorganic nanoparticles) to enhance the delivery efficiency and minimize adverse side effects.
Bray F, Ferlay J, Soerjomataram I, et al. CA Cancer J. Clin., 2018, 68:394-424 doi: 10.3322/caac.21492
Gao F P, Li L L, Fu C H, et al. Adv. Mater., 2013, 25(38):5508-5513 doi: 10.1002/adma.201301217
Chen X L, Sun H, Hu J, et al. Colloids Surf. B, 2017, 152:77-84 doi: 10.1016/j.colsurfb.2017.01.010
Guo Y M, Li H, Shi W K, et al. J. Colloid Interface Sci., 2017, 502:59-66 doi: 10.1016/j.jcis.2017.04.085
Zhang P F, Zhang L, Qin Z N, et al. Adv. Mater., 2018, 30(7):1705350 doi: 10.1002/adma.201705350
Akhtar N, Khan R A. Prog. Lipid Res., 2016, 64:192-230 doi: 10.1016/j.plipres.2016.08.005
Shen H J, Shi H, Ma K, et al. Acta Biomater., 2013, 9(4):6123-6133 doi: 10.1016/j.actbio.2012.12.024
Yang J Y, Kopeek J. J. Drug Delivery Sci. Technol., 2015, 30(Part B):318-330
Sun H, She P, Lu G L, et al. J. Mater. Sci., 2014, 49(20):6845-6854 doi: 10.1007/s10853-014-8436-4
Li T T, Shi S X, Goel S, et al. Acta Biomater., 2019, 89:1-13 doi: 10.1016/j.actbio.2019.02.031
Diab R, Canilho N, Pavel I A, et al. Adv. Colloid Interface Sci., 2017, 249:346-362 doi: 10.1016/j.cis.2017.04.005
Vallet-Regí M, Rámila A, del Real R P, et al. Chem. Mater., 2001, 13(2):308-311 doi: 10.1021/cm0011559
Hao N J, Jayawardana K W, Chen X, et al. ACS Appl. Mater. Interfaces, 2015, 7(2):1040-1045 doi: 10.1021/am508219g
Mai T B, Tran T N, Islam M R, et al. J. Mater. Sci., 2014, 49(4):1519-1526 doi: 10.1007/s10853-013-7833-4
Tian Y, Glogowska A, Zhong W, et al. J. Mater. Chem. B, 2013, 1(39):5264-5272 doi: 10.1039/c3tb20544d
Martínez C M, Lozano D, Colilla M, et al. Acta Biomater., 2018, 65:393-404 doi: 10.1016/j.actbio.2017.11.007
Hu L L, Meng J, Zhang D D, et al. Talanta, 2018, 177:203-211 doi: 10.1016/j.talanta.2017.07.017
Steven C R, Busby G A, Mather C, et al. J. Mater. Chem. B, 2014, 2:5028-5042 doi: 10.1039/C4TB00510D
Lee J E, Lee D J, Lee N, et al. J. Mater. Chem., 2011, 21:16869-16872 doi: 10.1039/c1jm11869b
Kwon S, Singh R K, Kim T H, et al. Acta Biomater., 2014, 10(3):1431-1442 doi: 10.1016/j.actbio.2013.10.028
Zhang Y, Hsu B Y W, Ren C L, et al. Chem. Soc. Rev., 2015, 44(1):315-335
Yuan L, Tang Q Q, Yang D, et al. J. Phys. Chem. C, 2011, 115(20):9926-9932 doi: 10.1021/jp201053d
Nguyen C T H, Webb R I, Lambert L K, et al. ACS Appl. Mater. Interfaces, 2017, 9(11):9470-9483 doi: 10.1021/acsami.7b00411
Begum G, Laxmi M V, Rana R K, et al. J. Mater. Chem., 2012, 22:22174-22180 doi: 10.1039/c2jm32898d
Zhang S L, Chu Z Q, Yin C, et al. J. Am. Chem. Soc., 2013, 135(15):5709-5716 doi: 10.1021/ja3123015
Hao W J, Shen Y X, Liu D Y, et al. RSC Adv., 2017, 7:851-860 doi: 10.1039/C6RA25224A
Narayan R, Nayak U Y, Raichur A M, et al. Pharmaceutics, 2018, 10:118 doi: 10.3390/pharmaceutics10030118
Wang J, Liu H Y, Leng F, et al. Microporous Mesoporous Mater., 2014, 186(1):187-193
Hong C Y, Li X, Pan C Y. J. Mater. Chem., 2009, 19(29):5155-5160
Hu X X, Hao X H, Wu Y, et al. J. Mater. Chem. B, 2013, 1:1109-1118 doi: 10.1039/c2tb00223j
Jiao Y F, Guo J, Shen S, et al. J. Mater. Chem., 2012, 22(34):17636-17643 doi: 10.1039/c2jm31821k
Rim H P, Min K H, Lee H J, et al. Angew. Chem. Int. Ed., 2011, 50(38):8853-8857 doi: 10.1002/anie.201101536
Chen Y Y, Ma P A, Yang D M, et al. Chem. Asian J., 2014, 9(2):506-513 doi: 10.1002/asia.201301262
Gu J L, Su S S, Zhu M J, et al. Microporous Mesoporous Mater., 2012, 161:160-167 doi: 10.1016/j.micromeso.2012.05.035
Song G S, Li C, Hu J Q, et al. J. Mater. Chem., 2012, 22(33):17011-17018
Mei X, Chen D Y, Li N J, et al. Microporous Mesoporous Mater., 2012, 152:16-24 doi: 10.1016/j.micromeso.2011.12.015
Popat A, Liu J, Lu G Q, et al. J. Mater. Chem., 2012, 22:11173-11178 doi: 10.1039/c2jm30501a
Yu C M, Gao C M, Lü S Y, et al. Colloids Surf. B, 2014, 115:331-339 doi: 10.1016/j.colsurfb.2013.12.023
Zhao Z H, Huang D T, Yin Z Y, et al. J. Mater. Chem., 2012, 22:15717-15725 doi: 10.1039/c2jm31692g
Zhang Y Z, Wang J C, Bai X Y, et al. Mol. Pharmaceutics, 2012, 9(3):505-513 doi: 10.1021/mp200287c

Figure 1 (A) TEM image of the synthesized MSNs-FITC and (B) SEM image of the synthesized MSNs-FITC

Figure 4 UV-Vis absorption spectra of (A) APTES-FITC and (B) MSNs-FITC
Insets are photographs of MSNs-FITC dispersed in PBS under white light (left), and MSNs-FITC dispersed in PBS under UV light (right) situations

Figure 5 Loading capacity of MSNs-FITC in different DOX concentrations
Results are expressed as mean ± the standard error from three independent experiments

Figure 6 Nitrogen adsorption-desorption isotherms of (A) MSNs-FITC and (B) DOX@MSNs-FITC
Inset: corresponding pore size distributions

Figure 7 In vitro DOX release profiles from MSNs-FITC at different pH values
Results are expressed as mean ± the standard error from three independent experiments

Figure 8 Cytotoxicity of blank nanoparticles, free DOX and equivalent DOX concentration of DOX-loaded nanoparticles in Hela cells for 24 h
Results are expressed as means ± the standard error from three independent experiments

Figure 9 Confocal laser scanning microscope images of Hela cells cultivated with different concentrations of MSNs-FITC at 50, 80 and 100 μg·mL-1
Blue fluorescence shows nuclei stained with DAPI. Green fluorescence shows the location of MSNs-FITC. The scale bar is 20 μm

 扫一扫看文章

扫一扫关注我们
 下载:
下载:

 下载:
下载:


