Figure 1.
Schematic diagram of calculation procedure

Crystallization Kinetics of Mg-Borates Precipitating from Diluted Boron-Containing Brine of Da Qaidam Saline Lake
Jiao-Yu PENG , Bo ZHANG , Jing CHEN , Ya-Ping DONG , Wu LI


The new process of "crystallization by dilution" was firstly reported by Gao et al.[1-2] during study on the chemistry of borate in sulfate-type salt lake of Da Qaidam, in China. It refers to that borates could be accumulated in the concentrated brine throughout solar evaporation process, and keep stable at room temperature for a few months and do not crystallize until reach to the maximum solubility (5.82% in the form of B2O3)[3], while diluting this boron-concentrated brine with water can accelerate the precipitation of Mg-borates from aqueous solutions. Different hydrated Mg-borates, such as inderite (kurnakovite), hung-chaoite, and macallisterite, can be crystallized out after dilution for a period of time, not only from brines with different dilution ratios for the same time period, but also from the same diluted brine after setting different periods[1, 4-6]. This phenomenon explained the forming and mineralization of borate minerals deposited on Da Qaidam salt lake bottom[7-9], especially for the minerogenetic mechanism of pinnoite[10-12]. Furthermore, since the boron content in Mg-borate precipitates was more than 35% in the form of B2O3, which is much higher than boron ores (5%~30% B2O3) in China[13]. The high grade Mg-borate salts could be used as raw materials for industrial production of boron compound. Therefore, the "crystallization by dilution" would provide an economical method for the boron extraction from brine. However, since the magnesium borates have a high supersolubility and need a long time to achieve the solid-liquid equili-brium, which often causes a slow crystallization rate and low boron recovery during dilution process, it is of great importance to study the crystallization kinetics of Mg-borates from diluted brines. The objective of the present study was to investigate the crystallization kinetics and transformation mechanism of Mg-borates from different diluted brines by dynamical method. Factors such as temperature, dilution ratio and boron concentration on the Mg-borates crystallization were studied. The results obtained would provide funda-mental data and theories for the efficient separation of boron resource from brine using dilution method.
Gao et al.[14-19] had studied the crystallization kinetics of Mg-borates from MgO-nB2O3-MgCl2/MgSO4-H2O supersaturated solutions. In their studies, an appropriate mathematical modification of Nielsen′s polynuclear layer and mononuclear layer controlled growth mechanism[20-21] has been made, and the kinetic crystallization reaction equations of Mg-borates in supersaturated solutions are given as follows:
MA model: -dc/dt=k1(c0-c)2/3(c0-c∞)p
MB model: -dc/dt=k2(c0-c)4/3(c0-c∞)p
where MA and MB models correspond to the polynuclear layer and mononuclear layer controlled growth mechanism, respectively; k1 and k2 are the rate constants, c0 and c∞ are the initial concentration and equilibrium concentration of boron in solution, respectively; p is the reaction order referring to 1, 2, 3, and 4. Thus, four kinetic equations such as MA-1(MB-1), MA-2 (MB-2), MA-3 (MB-3) and MA-4(MB-4) are obtained. Generally, the crystallization mechanism controlled by MB model needs higher reaction energy and longer inducing period compared with the MA model.
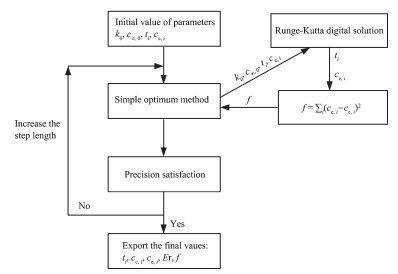
Based on the simple optimum method and Runge-Kutta digital solution of differential equations[14], the experimental data of c-t curve was fitted and the optimum kinetic equation of Mg-borates was calculated by computer, as shown in Fig. 1. The c0 value is considered as the boron concentration at the point of initial precipitation of solid phase, the c∞, 0 is the initial value of equilibrium concentration of boron estimated less than the last value of experimental data. Because Mg-borates often have a high super-solubility and require a long period of time (more than half a year) to establish the solid-liquid equilibrium, it is difficult to determine the c∞ value experimentally. The k0 is also the initial value of the rate constant. The relative error Er was defined as: Er=(cc, i-ce, i)/ce, i×100%. cc, i and ce, i are the calculation data and experi-mental data at ti time period, respectively. The preci-sion used was 10-7. Among all the obtained MA and MB kinetic equations, the suitable equation is selected when the values of Er are no more than 5.0%.
In the present study, the boron-concentrated brine system can be referred as MgO-2B2O3-MgSO4-MgCl2-H2O, which is similar to that of Gao′s studies. Therefore, we choose the MA and MB models to calculate the kinetic equations of Mg-borates precipitated from different diluted brines.
A boron-containing brine (1.28% B2O3), saturated with bischofite (MgCl2·6H2O), was obtained from Da Qaidam salt lake and concentrated further by evapora-tion at (298.15±3) K after the addition of Na2SO4·10H2O solid. The concentration of boron in concen-trated brines was 2.60%, 3.78% and 4.96% in the form of B2O3 (Table 1). The Na2SO4·10H2O solid was recrystallized from mirabilite ores. Deionized water (resistivity, 18.25 MΩ·cm) was used in all experiments.

 下载:
导出CSV
下载:
导出CSV
| Brine | Density/(g·cm-3) | pH | Mass fraction of ion/% | ||||||
| Na+ | Mg2+ | K+ | B3+ (B2O3) | Cl- | SO42- | Li+ | |||
| Da Qaidam (L0) | 1.362 2 | 4.39 | 0.107 | 8.86 | 0.048 | 1.28 | 24.47 | 2.29 | 0.144 |
| Brine L1 | 1.348 1 | 4.50 | -0.051 | 8.70 | 0.056 | 2.60 | 22.90 | 3.23 | 0.246 |
| Brine L2 | 1.394 5 | 4.43 | 0.016 | 8.80 | 0.063 | 3.78 | 23.22 | 2.91 | 0.301 |
| Brine L3 | — | 4.31 | 0.055 | 8.71 | 0.078 | 4.96 | 22.32 | 3.42 | 0.353 |
The crystallization experiments were performed as follows[1]: an amount of the boron-concentrated brine was diluted with some water. The diluted brine was placed in a well-sealed glass vessel at constant temperature and stirred ca. 5 min each day to promote the precipitation of solid phase. When the solid phase began to precipitate from the diluted brine, some solution samples were taken out using a porous filter (Pore size: 3~4 μm) for boron concentration analysis. The sampling experiments were carried out every one or three days until the solution concentration of boron changed little or remained basically constant. Then the mixtures were filtered, and the resultant sediment was washed using some water and absolute alcohol, respectively, and dried in a vacuum drying oven for 24 h. The obtained solid phases were characterized by X-ray diffraction (XRD, PRO PANalytical X′Pert, Cu Kα1, λ=0.154 nm) with a tube voltage and current of 40 kV and 30 mA, respectively. The powder pattern was measured in a scanning range from 5° to 70°. The composition of solid was analyzed by titration.
During the crystallization process, the boron concentrations used were 2.60%, 3.78% and 4.96% in the form of B2O3, and the mass dilution ratios (mwater/mbrine) tested were 0.50, 1.0 and 2.0. The temperature used was 258.15, 277.15 and 298.15 K. The experi-ments at low temperature (258.15 and 277.15 K) were achieved by placing in a refrigerator and that of 298.15 K was settled in water bath.
The titration analysis of brine and solid compositions was based on a previous publication[22]. The Mg2+ ion was analyzed by complexometric titration with ethylene diamine tetraacetic acid (EDTA). The K+ ion was analyzed by quaternary ammonium back titration. The Li+ ion was determined by the flame atomic absorption spectrophotometer (AAS, AAnalyst 800, PE of USA). The Cl- ion and boron was analyzed by mercurimetry and mannitol conversion acid base titration, respectively. The SO42- ion was analyzed by the gravimetric method. While the Na+ ion concentra-tion in brine was calculated using the ion charge balance principle. The accuracy of these analyses was ±0.1%~±0.3%.
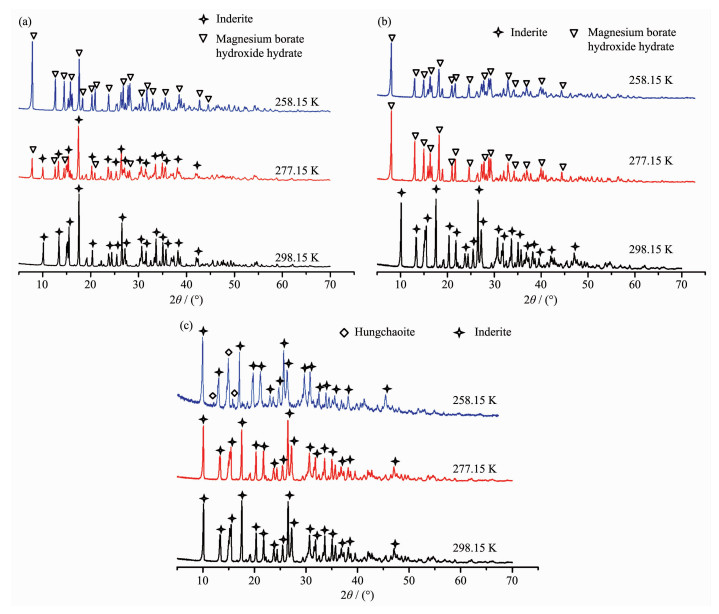
The XRD patterns of precipitates crystallized from diluted brines are shown in Fig. 2. And the solid phase composition is listed in Table 2. The water content in precipitates was obtained by subtracting the mass of MgO and B2O3 from the total mass. As shown in Table 2, at 1.0 dilution ratio, when boron concentration was less than 3.78% in B2O3, the only triborates such as magnesium borate hydroxide (MgB3O3(OH)5·6H2O) and inderite (MgB3O3(OH)5·5H2O) had crystallized out from the diluted brines. As the boron concentration increased to 4.96% B2O3, the tetraborate of hungchaoite (MgB4O5(OH)4·7H2O) appeared in the precipitates at temperature lower than 277.15 K. This is because the high boron concentra-tion and low temperature favored the formation of [B4O5(OH)4]2- ion by polymerization. Besides, the content of B2O3 in precipitates varied in a range of 35%~40%, much higher than the grade (wB2O3≥12%) requested for chemical processing of borate minerals in China.
Dilution ratio=1.0
下载:
导出CSV
| cboron/% (w/w) | Dilution ratio | T/℃ | wMgO/% (w/w) | wB2O3/% (w/w) | wH2O/% (w/w) | nMgO:nB2O3:nH2O | Solid phase determined by XRD | Formula |
| 2.60 | 1.0 | 298.15 | 14.38 | 37.80 | 47.82 | 1.00:1.52:7.44 | Magnesium borate hydroxide hydrate | 2MgO·3B2O3·15H2O |
| 1.0 | 277.15 | 14.05 | 36.91 | 49.04 | 1.00:1.52:7.81 | Inderite+Magnesium borate hydroxide hydrate | 2MgO·3B2O3·15H2O+2MgO·3B2O3·17H2O | |
| 1.0 | 258.15 | 13.57 | 35.10 | 51.34 | 1.00:1.50:8.47 | Magnesium borate hydroxide hydrate | 2MgO·3B2O3·17H2O | |
| 3.78 | 1.0 | 298.15 | 14.40 | 37.94 | 47.66 | 1.00:1.53:7.41 | Inderite | 2MgO·3B2O3·15H2O |
| 1.0 | 277.15 | 13.62 | 35.52 | 50.86 | 1.00:1.51:8.36 | Magnesium borate hydroxide hydrate | 2MgO·3B2O3·17H2O | |
| 1.0 | 258.15 | 13.55 | 35.16 | 51.30 | 1.00:1.50:8.47 | Magnesium borate hydroxide hydrate | 2MgO·3B2O3·17H2O | |
| 4.96 | 1.0 | 298.15 | 14.37 | 37.99 | 47.65 | 1.00:1.53:7.42 | Inderite | 2MgO·3B2O3·15H2O |
| 1.0 | 277.15 | 12.73 | 40.06 | 47.21 | 1.00:1.82:8.29 | Inderite+Hungchaoite | 2MgO·3B2O3·15H2O+MgO·2B2O3·9H2O | |
| 1.0 | 258.15 | 12.50 | 38.34 | 49.17 | 1.00:1.78:8.80 | Inderite+Hungchaoite | 2MgO·3B2O3·15H2O+MgO·2B2O3·9H2O |
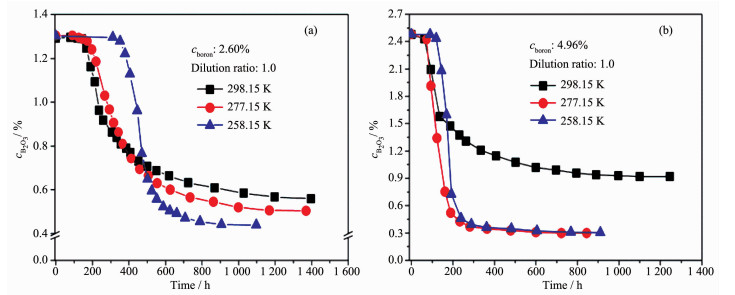
Fig. 3 shows the effect of temperature on the crystallization process (cB2O3-t curve) of Mg-borates from 2.60% and 4.96% boron(B2O3) brines at 1.0 dilution ratio, respectively.
As shown in Fig. 3, the crystallization process appeared in the shape of reversed S curve including inducing period, crystallization and phase equilibrium stages. The time of inducing period decreased with the increasing of temperature and boron concentrations. While the total time period, throughout the crystalliza-tion process, shortened greatly with the decreasing of temperature and an increasing in boron concentrations due to higher supersaturation. For instance, the crystallization time shortened twice (from 1 400 to 600 h) as boron(B2O3) concentration increased from 2.60% to 4.96% at 258.15 K. Besides, when the boron (B2O3) concentration increased to 4.96% (Fig. 3b), It was noted that the crystallization time changed little at temperature less than 277.15 K. Because the boron(B2O3) concentration of 4.96% in brine is closed to the maximum supersolubility of Mg-borate (5.71%~5.81% B2O3)[3] in concentrated salt lake brine, the influence of boron concentration is predominant and further temperature reduction makes little effect on crystallization.
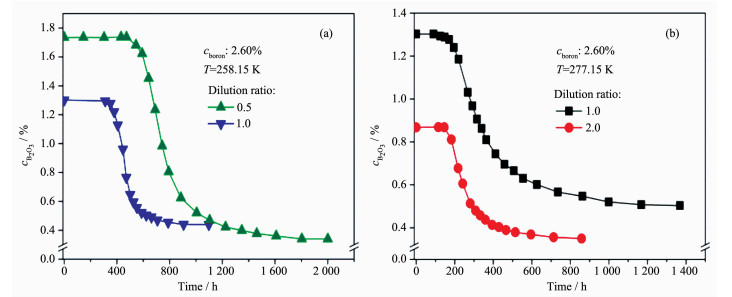
The influence of mass dilution ratio (mwater/mbrine) on the crystallization is shown in Fig. 4. The boron(B2O3) concentration used was 2.60%. As can be seen, the phase equilibrium concentration of boron at dilution ratio of 0.50 was lower than that of 1.0 ratio at 258.15 K (Fig. 4a). But the crystallization time of the former was twice longer than the latter due to the slower crystallization rate of Mg-borates at ratio of 0.50. At 277.15 K (Fig. 4b), the crystallization time at ratio of 2.0 was shorter and the yield of boron was also lower compared with ratio of 1.0. According to our study, the diluted brine of 2.0 ratio would freeze when the temperature decreased from 277.15 to 258.15 K. Therefore, the dilution ratio ranging from 0.50 to 1.0 and the temperature below 277.15 K would be more preferable to the Mg-borates crystallization from salt lake brine.
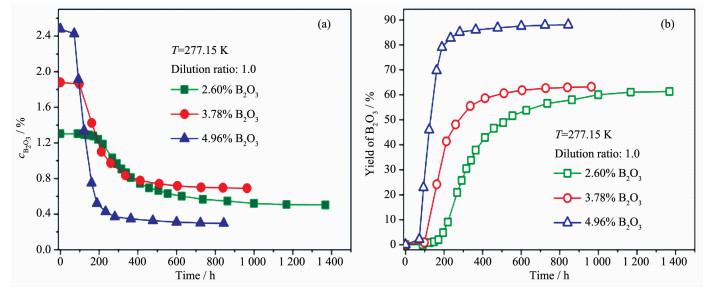
As shown in Fig. 5, the boron concentration affected dramatically on the yield of Mg-borates at ratio of 1.0, as well as the crystallization time. When boron(B2O3) concentration increased from 2.60% to 4.96%, the boron yield increased substantially from 61.4% to 88.0% in the form of B2O3. This result would offer considerable benefits to the boron extraction from salt lake brine by dilution method.
After calculations of the kinetic equation both from MA and MB models, the optimum kinetic equations of Mg-borates at 1.0 ratio with different temperature and boron concentrations were obtained as follows:
(1) 2.60% B2O3 boron-concentrated brine at 1.0 dilution ratio
298.15 K: -dc/dt=0.0343 9(1.290-c)2/3(c-0.540)2
277.15 K: -dc/dt=0.0239 1(1.293-c)2/3(c-0.490)2
258.15 K: -dc/dt=0.0200 9(1.295-c)2/3(c-0.440)
(2) 3.78% B2O3 boron-concentrated brine at 1.0 dilution ratio
298.15 K: -dc/dt=0.013 16(1.879-c)2/3(c-0.650)2
277.15 K: -dc/dt=0.025 46(1.863-c)2/3(c-0.630)2
258.15 K: -dc/dt=0.023 24(1.854-c)2/3(c-0.570)2
(3) 4.96% B2O3 boron-concentrated brine at 1.0 dilution ratio
298.15 K: -dc/dt=0.009 82(2.479-c)2/3(c-0.850)2
277.15 K: -dc/dt=0.013 73(2.427-c)2/3(c-0.250)2
258.15 K: -dc/dt=0.049 01(2.477-c)2/3(c-0.220)3
The corresponding crystallization results of Mg-borates with boron(B2O3) concentration of 2.60%, 3.78% and 4.96% are shown in Table 3 to 5, respe-ctively. The relative errors between the experimental and calculated data were plotted in Fig. 6. As shown in Fig. 6, most of the absolute values of relative error were less than 5% except for the minorities, suggesting the calculated data agreed well with the experiment one. According to the kinetic equations, it is known that the crystallization of Mg-borates is dominated by the polynuclear layer controlled growth mechanism. While the boron concentration increases to the maximum supersaturation level, the mononuclear layer controlled growth mechanism changes to be the predominant one at temperature of 258.15 K.
下载:
导出CSV
| 298.15 K | 277.15 K | 258.15 K | |||||||||||
| Time/h | ce/% | cc/% | Er(MA-2)/% | Time/h | ce/% | cc/% | Er(MA-2)/% | Time/h | ce/% | cc/% | Er(MA-2)/% | ||
| 0 | 1.292 | 0 | 1.303 | 0 | 1.302 | ||||||||
| 118.0 | 1.292 | 89.9 | 1.303 | 310.8 | 1.295 | 1.295 | 0.00 | ||||||
| 140.7 | 1.290 | 1.289 | -0.08 | 125.1 | 1.293 | 1.292 | -0.08 | 350.4 | 1.277 | 1.274 | -0.23 | ||
| 166.7 | 1.246 | 1.270 | 1.93 | 148.2 | 1.289 | 1.281 | -0.62 | 378.6 | 1.220 | 1.216 | -0.33 | ||
| 190.5 | 1.163 | 1.221 | 4.99 | 170.9 | 1.277 | 1.255 | -1.72 | 406.5 | 1.128 | 1.114 | -1.24 | ||
| 213.3 | 1.092 | 1.150 | 5.31 | 195.5 | 1.240 | 1.205 | -2.82 | 446.1 | 0.962 | 0.923 | -4.05 | ||
| 235.8 | 0.964 | 1.070 | 11.00 | 220.2 | 1.185 | 1.139 | -3.88 | 470.9 | 0.766 | 0.803 | 4.83 | ||
| 259.8 | 0.918 | 0.990 | 7.84 | 268.1 | 1.031 | 0.999 | -3.10 | 501.3 | 0.648 | 0.680 | 4.94 | ||
| 307.6 | 0.864 | 0.867 | 0.35 | 291.9 | 0.968 | 0.938 | -3.10 | 525.8 | 0.595 | 0.606 | 1.85 | ||
| 332.1 | 0.839 | 0.821 | -2.15 | 315.8 | 0.906 | 0.885 | -2.32 | 552.1 | 0.558 | 0.548 | -1.79 | ||
| 355.8 | 0.810 | 0.786 | -2.96 | 339.8 | 0.863 | 0.840 | -2.67 | 587.5 | 0.523 | 0.500 | -4.40 | ||
| 384.3 | 0.790 | 0.753 | -4.68 | 363.9 | 0.810 | 0.802 | -0.99 | 622.6 | 0.504 | 0.472 | -6.35 | ||
| 408.5 | 0.770 | 0.730 | -5.19 | 411.7 | 0.744 | 0.743 | -0.13 | 662.1 | 0.492 | 0.456 | -7.32 | ||
| 452.3 | 0.732 | 0.699 | -4.51 | 458.8 | 0.696 | 0.702 | 0.86 | 707.4 | 0.470 | 0.447 | -4.89 | ||
| 500.0 | 0.707 | 0.674 | -4.67 | 506.8 | 0.666 | 0.670 | 0.60 | 788.8 | 0.455 | 0.442 | -2.86 | ||
| 550.1 | 0.687 | 0.655 | -4.66 | 554.8 | 0.630 | 0.646 | 2.54 | 906.4 | 0.440 | 0.440 | 0.00 | ||
| 620.0 | 0.665 | 0.635 | -4.51 | 626.7 | 0.602 | 0.620 | 2.99 | 1 097.4 | 0.440 | 0.440 | 0.00 | ||
| 723.9 | 0.633 | 0.615 | -2.84 | 735.4 | 0.566 | 0.593 | 4.77 | ||||||
| 869.1 | 0.608 | 0.598 | -1.64 | 862.7 | 0.547 | 0.572 | 4.57 | ||||||
| 1 028.6 | 0.586 | 0.587 | 0.17 | 999.5 | 0.520 | 0.558 | 7.31 | ||||||
| 1 197.3 | 0.567 | 0.578 | 1.94 | 1 167.9 | 0.507 | 0.545 | 7.50 | ||||||
| 1 397.1 | 0.560 | 0.572 | 2.14 | 1 368.7 | 0.503 | 0.535 | 6.36 | ||||||
| *ce: experimental data; cc: calculated data | |||||||||||||
下载:
导出CSV
| 298.15 K | 277.15 K | 258.15 K | |||||||||||
| Time/h | ce/% | cc/% | Er(MA-2)/% | Time/h | ce/% | cc/% | Er(MA-2)/% | Time/h | ce/% | cc/% | Er(MA-2)/% | ||
| 0.00 | 1.879 | 1.879 | 0.00 | 0.00 | 1.880 | 0.00 | 1.874 | ||||||
| 47.5 | 1.841 | 1.830 | -0.60 | 98.3 | 1.863 | 1.863 | 0.00 | 95.6 | 1.868 | ||||
| 93.0 | 1.648 | 1.653 | 0.30 | 162.1 | 1.425 | 1.479 | 3.79 | 144.5 | 1.854 | 1.854 | 0.00 | ||
| 149.7 | 1.361 | 1.376 | 1.10 | 211.8 | 1.102 | 1.115 | 1.18 | 192.3 | 1.533 | 1.631 | 6.39 | ||
| 198.5 | 1.183 | 1.195 | 1.01 | 259.8 | 0.975 | 0.947 | -2.87 | 245.2 | 1.251 | 1.164 | -6.95 | ||
| 248.9 | 1.066 | 1.070 | 0.38 | 336.2 | 0.836 | 0.827 | -1.08 | 321.4 | 0.871 | 0.875 | 0.46 | ||
| 325.1 | 0.968 | 0.953 | -1.55 | 412.5 | 0.777 | 0.771 | -0.77 | 396.5 | 0.748 | 0.767 | 2.54 | ||
| 400.2 | 0.898 | 0.885 | -1.45 | 510.1 | 0.740 | 0.732 | -1.08 | 484.1 | 0.692 | 0.708 | 2.31 | ||
| 487.2 | 0.851 | 0.834 | -2.00 | 604.3 | 0.717 | 0.711 | -0.84 | 604.4 | 0.659 | 0.666 | 1.06 | ||
| 607.2 | 0.806 | 0.791 | -1.86 | 726.5 | 0.702 | 0.693 | -1.28 | 735.0 | 0.642 | 0.642 | 0.00 | ||
| 710.3 | 0.765 | 0.767 | 0.26 | 839.7 | 0.696 | 0.682 | -2.01 | 843.4 | 0.631 | 0.630 | -0.16 | ||
| 809.1 | 0.746 | 0.751 | 0.67 | 963.6 | 0.691 | 0.674 | -2.46 | 970.8 | 0.624 | 0.620 | -0.64 | ||
| 906.2 | 0.730 | 0.738 | 1.10 | ||||||||||
| 1 023.1 | 0.724 | 0.727 | 0.41 | ||||||||||
| 1 116.0 | 0.712 | 0.720 | 1.12 | ||||||||||
| *ce: experimental data; cc: calculated data | |||||||||||||
下载:
导出CSV
| 298.15 K | 277.15 K | 258.15 K | |||||||||||
| Time/h | ce/% | cc/% | Er(MA-2)/% | Time/h | ce/% | cc/% | Er(MA-2)/% | Time/h | ce/% | cc/% | Er(MA-2)/% | ||
| 0.00 | 2.479 | 2.479 | 0.00 | 0.00 | 2.480 | 0.00 | 2.477 | ||||||
| 61.6 | 2.430 | 2.299 | -5.39 | 71.6 | 2.427 | 2.427 | 0.00 | 88.8 | 2.477 | 2.477 | 0.00 | ||
| 92.3 | 2.095 | 2.066 | -1.38 | 93.4 | 1.913 | 2.033 | 6.27 | 118.7 | 2.433 | 2.476 | 1.77 | ||
| 134.8 | 1.577 | 1.751 | 11.03 | 122.9 | 1.340 | 1.115 | -16.79 | 145.5 | 2.078 | 2.467 | 18.72 | ||
| 186.4 | 1.475 | 1.486 | 0.75 | 161.3 | 0.751 | 0.687 | -8.52 | 169.3 | 1.595 | 1.609 | 0.88 | ||
| 230.4 | 1.373 | 1.344 | -2.11 | 189.1 | 0.520 | 0.564 | 8.46 | 193.3 | 0.723 | 0.686 | -5.12 | ||
| 263.3 | 1.305 | 1.270 | -2.68 | 233.7 | 0.429 | 0.463 | 7.93 | 238.8 | 0.460 | 0.476 | 3.48 | ||
| 335.0 | 1.209 | 1.162 | -3.89 | 281.0 | 0.370 | 0.408 | 10.27 | 288.3 | 0.391 | 0.409 | 4.60 | ||
| 407.2 | 1.147 | 1.095 | -4.53 | 364.1 | 0.347 | 0.358 | 3.17 | 362.4 | 0.359 | 0.365 | 1.67 | ||
| 502.0 | 1.077 | 1.041 | -3.34 | 477.7 | 0.327 | 0.325 | -0.61 | 480.8 | 0.344 | 0.332 | -3.49 | ||
| 598.8 | 1.020 | 1.005 | -1.47 | 600.0 | 0.310 | 0.307 | -0.97 | 604.2 | 0.321 | 0.314 | -2.18 | ||
| 697.5 | 0.989 | 0.979 | -1.01 | 723.0 | 0.300 | 0.295 | -1.67 | 768.6 | 0.308 | 0.300 | -2.60 | ||
| 794.0 | 0.956 | 0.961 | 0.52 | 843.5 | 0.297 | 0.288 | -3.03 | 909.8 | 0.302 | 0.291 | -3.64 | ||
| 889.5 | 0.936 | 0.948 | 1.28 | ||||||||||
| 997.8 | 0.927 | 0.936 | 0.97 | ||||||||||
| 1 100.6 | 0.921 | 0.927 | 0.65 | ||||||||||
| 1 246.1 | 0.917 | 0.917 | 0.00 | ||||||||||
| *ce: experimental data; cc: calculated data | |||||||||||||
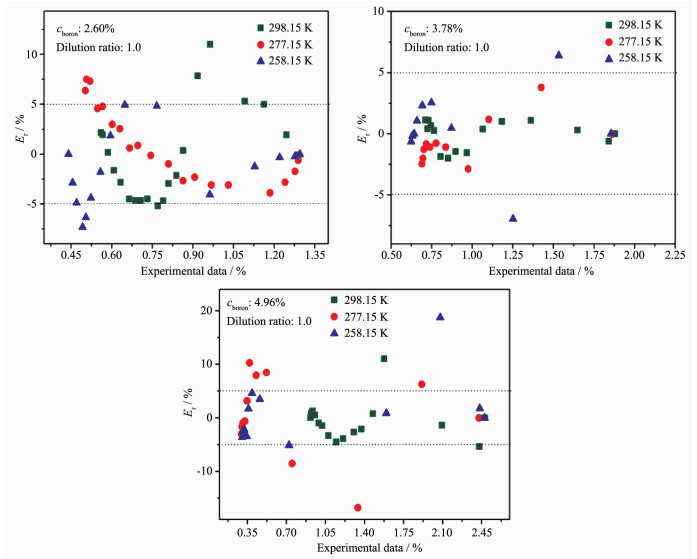
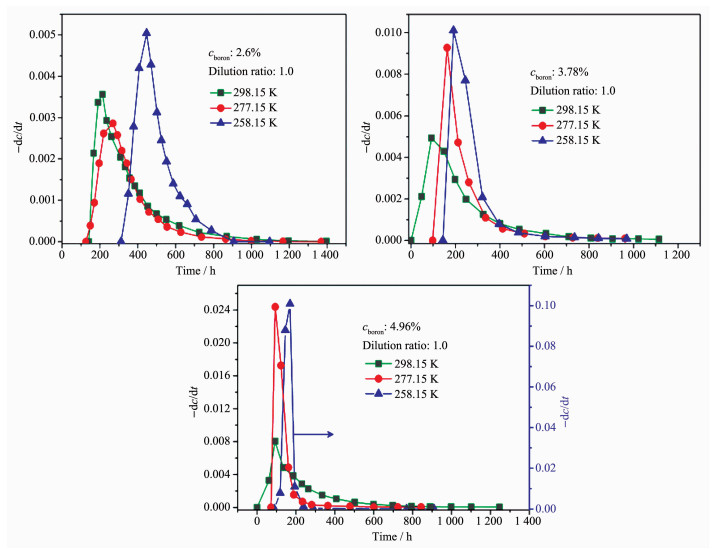
Fig. 7 shows the crystallization rate (-dc/dt) of Mg-borates calculated by kinetic equations during crystallization. It is noted that the crystallization rate initially increases exponentially to a maximum value and then decreases dramatically with the crystalliza-tion time, particularly for the high boron concentration and low temperature. Furthermore, it is noticeable that the crystallization rate increases with the increasing of boron concentrations and the drops of temperature, which explains the reason that the crystallization time of Mg-borates shortened dramatically with the rising in boron concentrations and also the lowering of temperature.
According to our earlier study[5, 23], the Raman spectra of the diluted brine (cboron=2.5%~4.7%) and the mother solution after precipitation were recorded at room temperature and it is found that the main boron forms in the diluted brine at ratio of 1.0 are B(OH)3, [B(OH)4]-, and [B3O3(OH)4]- anions. Species of [B5O6(OH)4]- and [B4O5(OH)4]2- ions are the minorities. But it changed after Mg-borates precipitation from the brine. The Raman intensity of the [B3O3(OH)4]- ion decreased and the [B(OH)4]-, [B5O6(OH)4]- and [B4O5(OH)4]2- ions disappeared in the mother solution. This is because the [B3O3(OH)4]- ion was used for Mg-borates precipitation and the boron concentration in solution decreased rapidly, which promotes the de-polymerization of [B5O6(OH)4]- and [B4O5(OH)4]2- in solution. Besides, the pH value of solution also decreased after precipitation and the solution became weak acidic. This reveals that the OH- ion is also consumed for the Mg-borates precipitation. In this paper, since the boron concentration, dilution ratio, and the solid phases are similar to the earlier report, the phase transformations of inderite, magnesium borate hydroxide and hungchaoite happening in the diluted brine at ratio of 1.0 can be deduced as follows:
For the triborates, the trimers of [B3O3(OH)4]- ion present in solution would couple a OH- to form the [B3O3(OH)5]2- ion and then react with [Mg(H2O)6]2+ ion in solution to precipitate the triborates, the main reactions can be:
|
$ \left[\mathrm{B}_{3} \mathrm{O}_{3}(\mathrm{OH})_{4}\right]^{-}+\mathrm{OH}^{-} \rightleftharpoons\left[\mathrm{B}_{3} \mathrm{O}_{3}(\mathrm{OH})_{5}\right]^{-} $ |
(1) |
|
$ \mathrm{Mg}^{2+}+6 \mathrm{H}_{2} \mathrm{O} \rightleftharpoons\left[\mathrm{Mg}\left(\mathrm{H}_{2} \mathrm{O}\right)_{6}\right]^{2+} $ |
(2) |
|
$ \begin{array}{r}{\left[\mathrm{B}_{3} \mathrm{O}_{3}(\mathrm{OH})_{5}\right]^{2-}+\left[\mathrm{Mg}\left(\mathrm{H}_{2} \mathrm{O}\right)_{6}\right]^{2+} \rightleftharpoons} \\ {\mathrm{MgB}_{3} \mathrm{O}_{3}(\mathrm{OH})_{5} \cdot 5 \mathrm{H}_{2} \mathrm{O} \downarrow+\mathrm{H}_{2} \mathrm{O}} \\ {\text { (inderite) }}\end{array} $ |
(3) |
|
$ \begin{array}{r}{\left[\mathrm{B}_{3} \mathrm{O}_{3}(\mathrm{OH})_{5}\right]^{2-}+\left[\mathrm{Mg}\left(\mathrm{H}_{2} \mathrm{O}\right)_{6}\right]^{2+} \rightleftharpoons} \\ {\mathrm{MgB}_{3} \mathrm{O}_{3}(\mathrm{OH})_{5} \cdot 6 \mathrm{H}_{2} \mathrm{O} \downarrow}\end{array} $ |
(4) |
(magnesium borate hydroxide hydrate)
Among the reactions, since the [B3O3(OH)4]- coupled a OH- to form the [B3O3(OH)5]2- ion, the solution pH value decreases after solid precipitation.
For the tetraborates, the lower temperature and increasing boron concentration favor the polymerizaiton of the [B3O3(OH)4]- with [B(OH)4]- to form the [B4O5(OH)4]2- ion, and then [B4O5(OH)4]2- react with [Mg(H2O)6]2+ ion to precipitate the hungchaoite. The main reactions can be:
|
$ \begin{array}{r}{\left[\mathrm{B}_{3} \mathrm{O}_{3}(\mathrm{OH})_{4}\right]^{-}+\mathrm{OH}^{-}+\mathrm{B}(\mathrm{OH})_{3} \rightleftharpoons} \\ {\left[\mathrm{B}_{4} \mathrm{O}_{5}(\mathrm{OH})_{4}\right]^{2-}+2 \mathrm{H}_{2} \mathrm{O}}\end{array} $ |
(5) |
|
$ \mathrm{Mg}^{2+}+6 \mathrm{H}_{2} \mathrm{O} \rightleftharpoons\left[\mathrm{Mg}\left(\mathrm{H}_{2} \mathrm{O}\right)_{6}\right]^{2+} $ |
(6) |
|
$ \begin{array}{r}{\left[\mathrm{B}_{4} \mathrm{O}_{5}(\mathrm{OH})_{4}\right]^{2-}+\left[\mathrm{Mg}\left(\mathrm{H}_{2} \mathrm{O}\right)_{6}\right]^{2+}+\mathrm{H}_{2} \mathrm{O} \rightleftharpoons} \\ {\quad \operatorname{MgB}_{4} \mathrm{O}_{5}(\mathrm{OH})_{4} \cdot 7 \mathrm{H}_{2} \mathrm{O} \downarrow} \\ {\text { (hungchaoite) }}\end{array} $ |
(7) |
The boron-concentrated brine with system of MgO·2B2O3-MgSO4-MgCl2-H2O was obtained by evapo-ration and the crystallization of Mg-borates from diluted brines was studied by the kinetic method. The major conclusions are as follows:
(1) The crystallization time, crystallization rate and boron yield are greatly influenced by temperature, dilution ratio and boron concentration. High boron concentration with medium dilution ratio and low temperature are found to be more beneficial to the boron crystallization and the boron yield obtained was more than 88% (cB2O3), which is favorable to the boron extraction from salt lake brine by dilution method.
(2) According to the kinetic equations, the crystallization of Mg-borates in diluted brine is dominated by the mechanism of polynuclear layer controlled growth. However, as the boron concentra-tion increases to the maximum supersaturation level and the temperature decreases to 258.15 K, the mononuclear layer controlled growth mechanism becomes the predominant one. Furthermore, the phase transformation mechanism of Mg-borates was also proposed based on the Raman spectra of borate ions in solution before or after precipitation.
The above results can provide useful information and technical support for the application of dilution method in boron separation from salt lake.
高世扬, 许开芬, 李刚, 等.化学学报, 1986, 44:1229-1233 http://www.cnki.com.cn/Article/CJFDTotal-HXXB198612007.htmGAO Shi-Yang, XU Kai-Feng, LI Gang, et al. Acta Chim. Sinica, 1986, 44:1229-1233 http://www.cnki.com.cn/Article/CJFDTotal-HXXB198612007.htm
高世扬, 冯九宁.无机化学学报, 1992, 8(1):68-70 http://www.wjhxxb.cn/wjhxxbcn/ch/reader/view_abstract.aspx?file_no=19920115&flag=1GAO Shi-Yang, FENG Jiu-Ning. Chinese J. Inorg. Chem., 1992, 8(1):68-70 http://www.wjhxxb.cn/wjhxxbcn/ch/reader/view_abstract.aspx?file_no=19920115&flag=1
高世扬, 符廷进, 王建中.无机化学学报, 1985, 1:97-102 http://www.wjhxxb.cn/wjhxxbcn/ch/reader/view_abstract.aspx?file_no=19850012&flag=1GAO Shi-Yang, FU Ting-Jin, WANG Jian-Zhong. Chinese. J. Inorg. Chem., 1985, 1:97-102 http://www.wjhxxb.cn/wjhxxbcn/ch/reader/view_abstract.aspx?file_no=19850012&flag=1
Peng J Y, Bian S J, Zhang B, et al. Hydrometallurgy, 2017, 174:47-55 doi: 10.1016/j.hydromet.2017.09.003
PENG Jiao-Yu (彭姣玉). Thesis for the Doctorate of University of Chinese Academy of Sciences (中国科学院大学博士论文). 2016.
Peng J Y, Bian S J, Lin F, et al. Phase Transitions, 2017, 90(10):1025-1033 doi: 10.1080/01411594.2017.1288230
高春亮, 余俊清, 闵秀云, 等.盐湖研究, 2015, 23(1):22-29 http://www.cqvip.com/QK/93634X/201501/664643077.htmlGAO Chun-Liang, YU Jun-Qing, MIN Xiu-Yun, et al. Journal of Salt Lake Research, 2015, 23(1):22-29 http://www.cqvip.com/QK/93634X/201501/664643077.html
高春亮, 余俊清, 闵秀云, 等.地质学报, 2015, 89(3):659-670 http://www.wanfangdata.com.cn/details/detail.do?_type=perio&id=dizhixb201503017GAO Chun-Liang, YU Jun-Qing, MIN Xiu-Yun, et al. Acta Geol. Sin., 2015, 89(3):659-670 http://www.wanfangdata.com.cn/details/detail.do?_type=perio&id=dizhixb201503017
高世扬, 李秉孝.矿物学报, 1982(2):107-112 doi: 10.3321/j.issn:1000-4734.1982.02.004GAO Shi-Yang, LI Bing-Xiao. Acta Mineralogica Sinica, 1982(2):107-112 doi: 10.3321/j.issn:1000-4734.1982.02.004
Lin F, Dong Y P, Peng J Y, et al. Phase Transitions, 2016, 89(6):558-567 doi: 10.1080/01411594.2015.1077524
Peng J Y, Bian S J, Lin F, et al. Phase Transitions, 2017, 90(10):1025-1033 doi: 10.1080/01411594.2017.1288230
刘志宏, 胡满成, 高世扬, 等.地球化学, 2003, 32(6):569-572 doi: 10.3321/j.issn:0379-1726.2003.06.008LIU Zhi-Hong, HU Man-Cheng, GAO Shi-Yang, et al. Geochimica, 2003, 32(6):569-572 doi: 10.3321/j.issn:0379-1726.2003.06.008
郑学家.硼化合物生产及应用. Beijing:Chem-ical Industry Press, 2008:21-43ZHENG Xue-Jia. Production and Application of Boron Compounds. Beijing:Chem-ical Industry Press, 2008:21-43
高世扬, 陈学安, 夏树屏.化学学报, 1990, 48:1049-1056 http://www.irgrid.ac.cn/handle/1471x/641321GAO Shi-Yang, CHEN Xue-An, XIA Shu-Ping. Acta Chim. Sinica, 1990, 48:1049-1056 http://www.irgrid.ac.cn/handle/1471x/641321
高世扬, 黄发清, 夏树屏.盐湖研究, 1993, 1(1):38-48 http://www.cqvip.com/QK/93634X/199301/1005118867.htmlGAO Shi-Yang, HUANG Fa-Qing, XIA Shu-Ping. Journal of Salt Lake Research, 1993, 1(1):38-48 http://www.cqvip.com/QK/93634X/199301/1005118867.html
姚占力, 高世扬, 朱黎霞.无机化学学报, 1995, 11(4):419-423 http://www.wjhxxb.cn/wjhxxbcn/ch/reader/view_abstract.aspx?file_no=19950415&flag=1YAO Zhan-Li, GAO Shi-Yang, ZHU Li-Xia. Chinese. J. Inorg. Chem., 1995, 11(4):419-423 http://www.wjhxxb.cn/wjhxxbcn/ch/reader/view_abstract.aspx?file_no=19950415&flag=1
朱黎霞, 高世扬, 夏树屏, 等.无机化学学报, 2000, 16(5):722-728 doi: 10.3321/j.issn:1001-4861.2000.05.004ZHU Li-Xia, GAO Shi-Yang, XIA Shu-Ping, et al. Chinese. J. Inorg. Chem., 2000, 16(5):722-728 doi: 10.3321/j.issn:1001-4861.2000.05.004
马玉涛, 夏树屏, 高世扬.化学研究与应用, 2001, 13(6):636-640 doi: 10.3969/j.issn.1004-1656.2001.06.009MA Yu-Tao, XIA Shu-Ping, GAO Shi-Yang. Chemical Research and Application, 2001, 13(6):636-640 doi: 10.3969/j.issn.1004-1656.2001.06.009
高世扬, 姚占力, 夏树屏.化学学报, 1994, 52:10-22GAO Shi-Yang, YAO Zhan-Li, XIA Shu-Ping. Acta Chim. Sinica, 1994, 52:10-22
Nielsen A E. Acta Chem. Scand. 1959(13):784-802
Nielsen A E. Kinetics of Precipitation. Oxford:Pergamon, 1964.
中国科学院青海盐湖研究所分析室.卤水和盐的分析方法.2版. Beijing:Chemical Industry Press, 1988.Analysis Room of Qinghai Institute of Salt Lakes, Chinese Academy of Sciences. Workbook of Identication and Analysis Method of Salt Minerals. 2nd Ed.. Beijing:Chemical Industry Press, 1988.
Peng J Y, Chen J, Dong Y P, et al. Spectrochim. Acta Part A, 2018, 199:367-375 doi: 10.1016/j.saa.2018.03.063

Figure 2 XRD patterns of solid phases crystallized from diluted brines with various boron concentrations: (a) 2.60%; (b) 3.78%; (c) 4.96%
Dilution ratio=1.0

Figure 6 Concentrations of B2O3 and their errors between the experimental and calculated data during

Figure 7 (-dc/dt)-t curves of solid phases crystallized from diluted brines with different boron concentrations and temperatures
Table 1. Compositions of the brine used in experiments
| Brine | Density/(g·cm-3) | pH | Mass fraction of ion/% | ||||||
| Na+ | Mg2+ | K+ | B3+ (B2O3) | Cl- | SO42- | Li+ | |||
| Da Qaidam (L0) | 1.362 2 | 4.39 | 0.107 | 8.86 | 0.048 | 1.28 | 24.47 | 2.29 | 0.144 |
| Brine L1 | 1.348 1 | 4.50 | -0.051 | 8.70 | 0.056 | 2.60 | 22.90 | 3.23 | 0.246 |
| Brine L2 | 1.394 5 | 4.43 | 0.016 | 8.80 | 0.063 | 3.78 | 23.22 | 2.91 | 0.301 |
| Brine L3 | — | 4.31 | 0.055 | 8.71 | 0.078 | 4.96 | 22.32 | 3.42 | 0.353 |
 下载: 导出CSV
Table 2. Analyses of solid phases crystallized from diluted brines
| cboron/% (w/w) | Dilution ratio | T/℃ | wMgO/% (w/w) | wB2O3/% (w/w) | wH2O/% (w/w) | nMgO:nB2O3:nH2O | Solid phase determined by XRD | Formula |
| 2.60 | 1.0 | 298.15 | 14.38 | 37.80 | 47.82 | 1.00:1.52:7.44 | Magnesium borate hydroxide hydrate | 2MgO·3B2O3·15H2O |
| 1.0 | 277.15 | 14.05 | 36.91 | 49.04 | 1.00:1.52:7.81 | Inderite+Magnesium borate hydroxide hydrate | 2MgO·3B2O3·15H2O+2MgO·3B2O3·17H2O | |
| 1.0 | 258.15 | 13.57 | 35.10 | 51.34 | 1.00:1.50:8.47 | Magnesium borate hydroxide hydrate | 2MgO·3B2O3·17H2O | |
| 3.78 | 1.0 | 298.15 | 14.40 | 37.94 | 47.66 | 1.00:1.53:7.41 | Inderite | 2MgO·3B2O3·15H2O |
| 1.0 | 277.15 | 13.62 | 35.52 | 50.86 | 1.00:1.51:8.36 | Magnesium borate hydroxide hydrate | 2MgO·3B2O3·17H2O | |
| 1.0 | 258.15 | 13.55 | 35.16 | 51.30 | 1.00:1.50:8.47 | Magnesium borate hydroxide hydrate | 2MgO·3B2O3·17H2O | |
| 4.96 | 1.0 | 298.15 | 14.37 | 37.99 | 47.65 | 1.00:1.53:7.42 | Inderite | 2MgO·3B2O3·15H2O |
| 1.0 | 277.15 | 12.73 | 40.06 | 47.21 | 1.00:1.82:8.29 | Inderite+Hungchaoite | 2MgO·3B2O3·15H2O+MgO·2B2O3·9H2O | |
| 1.0 | 258.15 | 12.50 | 38.34 | 49.17 | 1.00:1.78:8.80 | Inderite+Hungchaoite | 2MgO·3B2O3·15H2O+MgO·2B2O3·9H2O |
下载: 导出CSV
Table 3. Concentrations of B2O3 and their errors calculated by dynamic model during crystallization from 2.60% B2O3 diluted brine at ratio of 1.0*
| 298.15 K | 277.15 K | 258.15 K | |||||||||||
| Time/h | ce/% | cc/% | Er(MA-2)/% | Time/h | ce/% | cc/% | Er(MA-2)/% | Time/h | ce/% | cc/% | Er(MA-2)/% | ||
| 0 | 1.292 | 0 | 1.303 | 0 | 1.302 | ||||||||
| 118.0 | 1.292 | 89.9 | 1.303 | 310.8 | 1.295 | 1.295 | 0.00 | ||||||
| 140.7 | 1.290 | 1.289 | -0.08 | 125.1 | 1.293 | 1.292 | -0.08 | 350.4 | 1.277 | 1.274 | -0.23 | ||
| 166.7 | 1.246 | 1.270 | 1.93 | 148.2 | 1.289 | 1.281 | -0.62 | 378.6 | 1.220 | 1.216 | -0.33 | ||
| 190.5 | 1.163 | 1.221 | 4.99 | 170.9 | 1.277 | 1.255 | -1.72 | 406.5 | 1.128 | 1.114 | -1.24 | ||
| 213.3 | 1.092 | 1.150 | 5.31 | 195.5 | 1.240 | 1.205 | -2.82 | 446.1 | 0.962 | 0.923 | -4.05 | ||
| 235.8 | 0.964 | 1.070 | 11.00 | 220.2 | 1.185 | 1.139 | -3.88 | 470.9 | 0.766 | 0.803 | 4.83 | ||
| 259.8 | 0.918 | 0.990 | 7.84 | 268.1 | 1.031 | 0.999 | -3.10 | 501.3 | 0.648 | 0.680 | 4.94 | ||
| 307.6 | 0.864 | 0.867 | 0.35 | 291.9 | 0.968 | 0.938 | -3.10 | 525.8 | 0.595 | 0.606 | 1.85 | ||
| 332.1 | 0.839 | 0.821 | -2.15 | 315.8 | 0.906 | 0.885 | -2.32 | 552.1 | 0.558 | 0.548 | -1.79 | ||
| 355.8 | 0.810 | 0.786 | -2.96 | 339.8 | 0.863 | 0.840 | -2.67 | 587.5 | 0.523 | 0.500 | -4.40 | ||
| 384.3 | 0.790 | 0.753 | -4.68 | 363.9 | 0.810 | 0.802 | -0.99 | 622.6 | 0.504 | 0.472 | -6.35 | ||
| 408.5 | 0.770 | 0.730 | -5.19 | 411.7 | 0.744 | 0.743 | -0.13 | 662.1 | 0.492 | 0.456 | -7.32 | ||
| 452.3 | 0.732 | 0.699 | -4.51 | 458.8 | 0.696 | 0.702 | 0.86 | 707.4 | 0.470 | 0.447 | -4.89 | ||
| 500.0 | 0.707 | 0.674 | -4.67 | 506.8 | 0.666 | 0.670 | 0.60 | 788.8 | 0.455 | 0.442 | -2.86 | ||
| 550.1 | 0.687 | 0.655 | -4.66 | 554.8 | 0.630 | 0.646 | 2.54 | 906.4 | 0.440 | 0.440 | 0.00 | ||
| 620.0 | 0.665 | 0.635 | -4.51 | 626.7 | 0.602 | 0.620 | 2.99 | 1 097.4 | 0.440 | 0.440 | 0.00 | ||
| 723.9 | 0.633 | 0.615 | -2.84 | 735.4 | 0.566 | 0.593 | 4.77 | ||||||
| 869.1 | 0.608 | 0.598 | -1.64 | 862.7 | 0.547 | 0.572 | 4.57 | ||||||
| 1 028.6 | 0.586 | 0.587 | 0.17 | 999.5 | 0.520 | 0.558 | 7.31 | ||||||
| 1 197.3 | 0.567 | 0.578 | 1.94 | 1 167.9 | 0.507 | 0.545 | 7.50 | ||||||
| 1 397.1 | 0.560 | 0.572 | 2.14 | 1 368.7 | 0.503 | 0.535 | 6.36 | ||||||
| *ce: experimental data; cc: calculated data | |||||||||||||
下载: 导出CSV
Table 4. Concentrations of B2O3 and their errors calculated by dynamic model during crystallization from 3.78% B2O3 diluted brine at ratio of 1.0*
| 298.15 K | 277.15 K | 258.15 K | |||||||||||
| Time/h | ce/% | cc/% | Er(MA-2)/% | Time/h | ce/% | cc/% | Er(MA-2)/% | Time/h | ce/% | cc/% | Er(MA-2)/% | ||
| 0.00 | 1.879 | 1.879 | 0.00 | 0.00 | 1.880 | 0.00 | 1.874 | ||||||
| 47.5 | 1.841 | 1.830 | -0.60 | 98.3 | 1.863 | 1.863 | 0.00 | 95.6 | 1.868 | ||||
| 93.0 | 1.648 | 1.653 | 0.30 | 162.1 | 1.425 | 1.479 | 3.79 | 144.5 | 1.854 | 1.854 | 0.00 | ||
| 149.7 | 1.361 | 1.376 | 1.10 | 211.8 | 1.102 | 1.115 | 1.18 | 192.3 | 1.533 | 1.631 | 6.39 | ||
| 198.5 | 1.183 | 1.195 | 1.01 | 259.8 | 0.975 | 0.947 | -2.87 | 245.2 | 1.251 | 1.164 | -6.95 | ||
| 248.9 | 1.066 | 1.070 | 0.38 | 336.2 | 0.836 | 0.827 | -1.08 | 321.4 | 0.871 | 0.875 | 0.46 | ||
| 325.1 | 0.968 | 0.953 | -1.55 | 412.5 | 0.777 | 0.771 | -0.77 | 396.5 | 0.748 | 0.767 | 2.54 | ||
| 400.2 | 0.898 | 0.885 | -1.45 | 510.1 | 0.740 | 0.732 | -1.08 | 484.1 | 0.692 | 0.708 | 2.31 | ||
| 487.2 | 0.851 | 0.834 | -2.00 | 604.3 | 0.717 | 0.711 | -0.84 | 604.4 | 0.659 | 0.666 | 1.06 | ||
| 607.2 | 0.806 | 0.791 | -1.86 | 726.5 | 0.702 | 0.693 | -1.28 | 735.0 | 0.642 | 0.642 | 0.00 | ||
| 710.3 | 0.765 | 0.767 | 0.26 | 839.7 | 0.696 | 0.682 | -2.01 | 843.4 | 0.631 | 0.630 | -0.16 | ||
| 809.1 | 0.746 | 0.751 | 0.67 | 963.6 | 0.691 | 0.674 | -2.46 | 970.8 | 0.624 | 0.620 | -0.64 | ||
| 906.2 | 0.730 | 0.738 | 1.10 | ||||||||||
| 1 023.1 | 0.724 | 0.727 | 0.41 | ||||||||||
| 1 116.0 | 0.712 | 0.720 | 1.12 | ||||||||||
| *ce: experimental data; cc: calculated data | |||||||||||||
下载: 导出CSV
Table 5. Concentrations of B2O3 and their errors calculated by dynamic model during crystallization from 4.96% B2O3 diluted brine at ratio of 1.0*
| 298.15 K | 277.15 K | 258.15 K | |||||||||||
| Time/h | ce/% | cc/% | Er(MA-2)/% | Time/h | ce/% | cc/% | Er(MA-2)/% | Time/h | ce/% | cc/% | Er(MA-2)/% | ||
| 0.00 | 2.479 | 2.479 | 0.00 | 0.00 | 2.480 | 0.00 | 2.477 | ||||||
| 61.6 | 2.430 | 2.299 | -5.39 | 71.6 | 2.427 | 2.427 | 0.00 | 88.8 | 2.477 | 2.477 | 0.00 | ||
| 92.3 | 2.095 | 2.066 | -1.38 | 93.4 | 1.913 | 2.033 | 6.27 | 118.7 | 2.433 | 2.476 | 1.77 | ||
| 134.8 | 1.577 | 1.751 | 11.03 | 122.9 | 1.340 | 1.115 | -16.79 | 145.5 | 2.078 | 2.467 | 18.72 | ||
| 186.4 | 1.475 | 1.486 | 0.75 | 161.3 | 0.751 | 0.687 | -8.52 | 169.3 | 1.595 | 1.609 | 0.88 | ||
| 230.4 | 1.373 | 1.344 | -2.11 | 189.1 | 0.520 | 0.564 | 8.46 | 193.3 | 0.723 | 0.686 | -5.12 | ||
| 263.3 | 1.305 | 1.270 | -2.68 | 233.7 | 0.429 | 0.463 | 7.93 | 238.8 | 0.460 | 0.476 | 3.48 | ||
| 335.0 | 1.209 | 1.162 | -3.89 | 281.0 | 0.370 | 0.408 | 10.27 | 288.3 | 0.391 | 0.409 | 4.60 | ||
| 407.2 | 1.147 | 1.095 | -4.53 | 364.1 | 0.347 | 0.358 | 3.17 | 362.4 | 0.359 | 0.365 | 1.67 | ||
| 502.0 | 1.077 | 1.041 | -3.34 | 477.7 | 0.327 | 0.325 | -0.61 | 480.8 | 0.344 | 0.332 | -3.49 | ||
| 598.8 | 1.020 | 1.005 | -1.47 | 600.0 | 0.310 | 0.307 | -0.97 | 604.2 | 0.321 | 0.314 | -2.18 | ||
| 697.5 | 0.989 | 0.979 | -1.01 | 723.0 | 0.300 | 0.295 | -1.67 | 768.6 | 0.308 | 0.300 | -2.60 | ||
| 794.0 | 0.956 | 0.961 | 0.52 | 843.5 | 0.297 | 0.288 | -3.03 | 909.8 | 0.302 | 0.291 | -3.64 | ||
| 889.5 | 0.936 | 0.948 | 1.28 | ||||||||||
| 997.8 | 0.927 | 0.936 | 0.97 | ||||||||||
| 1 100.6 | 0.921 | 0.927 | 0.65 | ||||||||||
| 1 246.1 | 0.917 | 0.917 | 0.00 | ||||||||||
| *ce: experimental data; cc: calculated data | |||||||||||||
下载: 导出CSV

 扫一扫看文章


扫一扫关注我们