Figure 1.
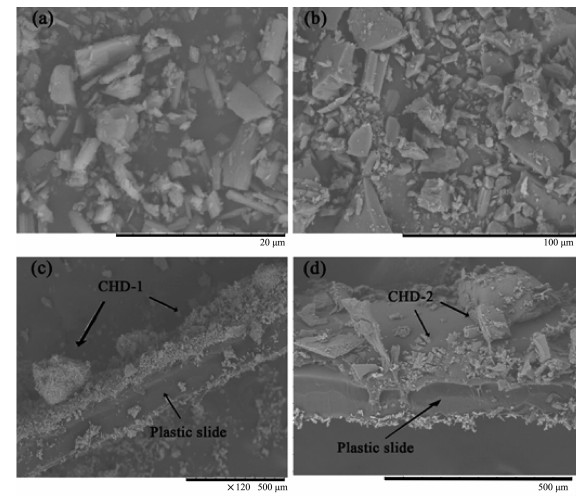
Scanning electron microscopy images of CHD-1 (a), CHD-2 (b), film of CHD-1 (c) and CHD-2 (d)
Two Homologous Metal-Organic Frameworks Based on Zn(Ⅱ) and Cd(Ⅱ): Luminescent Sensors for Nitro Aromatic Compounds in Solution and Vapor Medium
Jiang LI , Sen HAN , Tuan-Jie CHEN , Zhao-Xi GOU , Qi ZHANG , Xiao-Sahuang NIE , Hai-Ru CAO

The chemical sensing and detection play a crucial role in the anti-terrorism operation[1], environmental monitoring[2], medical science[3] and industrial produc-tion[4], etc. Recently, more and more researches focus on the development of the highly selective chemical sensor for the purpose of detection of nitro aromatic compounds in biological and environmental samples[1]. In general, the nitro aromatic compounds are widely used industrially as organic solvents, pesticides, and reagents for chemical weapons. A series of nitro aromatic compound are known as acutely toxic, organic pollutants that are frequently discharged into the environment by industrial production processes, and thus pose a threat to human health and environmental safety[5-8]. Therefore, how to detect nitro aromatic compounds fast and quantitatively deserves more attention by scientists across different disciplines. So far, luminescent sensing was considered as an effective approach due to the rapid response, high selectivity, convenience and real-time monitoring characterizations. However, with the disadvantages as the low saturated vapor pressure and weak interac-tions with probe[9-10], this methods listed above are still facing the limitations to detect nitro aromatic in vapor-phase.
A variety of sensing methods and materials has been developed for the detection of low levels of such toxic nitro aromatic compounds, focusing not only on the rapid detection, but also on the operational ease[11-12]. Particularly, multifunctional metal-organic frameworks (MOFs) was proposed as a new class of potential chemical sensors with luminescence and permanent porosity[13-19]. The luminescent sensing ability of MOFs mainly relies on the interaction between the host backbones and the guest molecules[20-27]. The majority of effective MOFs-based sensors are constructed with π-conjugated ligand, because the rich π-electron backbone can not only provide powerful luminescence but also supply active functional groups as the binding sites[28-29]. In particular, the permanent pores in luminescent MOFs lead to increase interaction between the frameworks and the analytes, which could enhance the sensing ability of MOFs[30].
We have previously reported on the synthesis, structure and properties of these MOFs to detection of Cu(Ⅱ) ions: [Cd2(DDCPB)(DMF)2(H2O)]n (CHD-1) and {[Zn2(DDCPB)(DMA)2]·DMA}n (CHD-2) (H4DDCPB=1, 1′:3′, 1″-terphenyl-3, 3″, 5, 5″-tetracarboxylic acid)[31]. However, we make full use of the high porosity and strong luminescence of two MOFs (CHD-1 and CHD-2) to sense nitro aromatics compounds. H4DDCPB was selected as the flexible V-shaped ligand for its aromatic π rings which may help to enhance the rigidity of the framework and promote luminescent character. CHD-1 and CHD-2 display ligand-based luminescence and high stability in those kinds of organic solutions. Therefore, both of them could detect NACs quantitatively and sensitively through luminescence quenching, which make them promising luminescence sensors. It should be noted that guest sensing incorporate pores or channels in CHD-1, while CHD-2 features a dense stacking mode without solvent accessible volume. Therefore, the detection limits of two MOFs are different and determined by luminescent sensor structure. Furthermore, two MOFs-based films were prepared and exhibit high sensitivity against the vapor of nitrobenzene (NB) and 2-nitrotoluene (o-MNT). Additionally, the mechanism of photo-induced electron transfer was systematically investigated.
All the reagents and solvents were obtained from commercial sources and used directly without further purification. Elemental analyses for C, H and N were performed on a Carlo-Erba CHNO-S microanalyzer. Infrared spectra (IR) were acquired with KBr discs via a Bruker EQUINOX-55 FT-IR spectrometer in a range of 400 to 4 000 cm-1. Thermogravimetric analyses (TGA) were carried out with NETZSCH STA 449 CTG/DTA equipment under N2 stream at a heating rate of 5 ℃·min-1. The luminescence properties were conducted in Hitachi F4500 fluorescence spectrophotometer. The powder X-ray diffraction (PXRD) patterns were collected on a Bruker D8 ADVANCE X-ray powder diffractometer with Cu Kα radiation (λ=0.154 18 nm) in a 2θ range of 5°~50° at a speed of 0.02°·s-1. The operating voltage and current are 40 kV and 40 mA, respectively. The SEM images were operated by S4800 scanning electron microscope (SEM) (Hitachi, Japan) at voltage of 2 kV. The quantum yields of two MOFs were performed with Horiba Fluoromax-4 at room temperature.
A mixture of Cd(NO3)2·6H2O (1 mmol), H4DDCPB (1 mmol), DMF(2 mL) and H2O (1 mL) was put into 15 mL Teflon-lined stainless steel vessel, and then heated at 120 ℃ for 72 h[31]. The colorless rod-like crystals were obtained after the vessel progressively cooled to room temperature. The productivity is in ca. 57.0% yield based on Cd. Anal. Calcd. for C28H24N2Cd2O10(%): C, 43.49; H, 3.13; N, 3.62. Found(%): C, 43.55; H, 3.25; N, 3.75.
The synthesis of CHD-2 was similar to the synthesis process of CHD-1 except that the solvent was DMA. The productivity obtained in ca. 63.0% yield based on Zn. Anal. Calcd. for C34H37N3Zn2O11(%): C, 51.39; H, 4.69; N, 5.28. Found(%): C, 54.42; H, 4.73; N, 5.30.
The luminescent properties were investigated in the solid state, in organic solvent suspensions and in air at room temperature. The as-synthesized samples (5.0 mg) of CHD-1 and CHD-2 were immersed in different organic solvents to check the sensing selectivity, including methanol, ethanol, acetone, N-methyl pyrrolidone, tetrahydrofuran, 1, 4-dioxane, acetonitrile, chlorobenzene, bromobenzene, cyclohex-ane, dimethylsulfoxide, dichloromethane, benzene and a series of nitro aromatics compounds (nitrobenzene (NB), 1, 4-dinitrobenzene (1, 4-DNB), 2, 4-dinitrotoluene (2, 4-DNT), 2-nitrotoluene (o-MNT) and 4-nitrotoluene (p-MNT). The finely ground sample powders were dispersed in 5 mL organic solvent by using ultrasonication for 2 h. All titrations were carried out by gradually adding solution of NACs into the solvent suspensions of the samples. To verify the stability of two compounds in the quenching suspensions, the PXRD patterns of the immersed powders were measured (Fig.S1 and Fig.S2).
The sample used as an in situ time-dependent luminescent sensor for solvent vapors was prepared as follows: the ground sample powder (5 mg) was pressed into a firm sheet. The sheet was attached to a thin plastic slide and placed into a bottle. The film was kept about 3 cm away from the bottom of the airtight bottle; then one drop of NB and o-MNT was added into the bottle.
CHD-1 and 2 were synthesised by a modified solvothermal method based on our previous work[31]. By the way, the MOFs structure description was displayed in Supporting Information (Fig.S15~S17).
The crystallinity and purity of the prepared samples were confirmed by the powder X-ray diffraction (PXRD) patterns as shown in Fig.S1 and S2. The very strong and sharp peaks imply the high crystallinity. Both samples showed similar diffraction peaks located at nearly the same angles and matched perfectly with simulated patterns from single crystal X-ray diffraction. The morphologies of MOFs-based films, which were prepared for sensing experimenta-tion, were determined by scanning electron micros-copy (SEM). The SEM images of films on the other hand demonstrate uniformity amongst crystals.
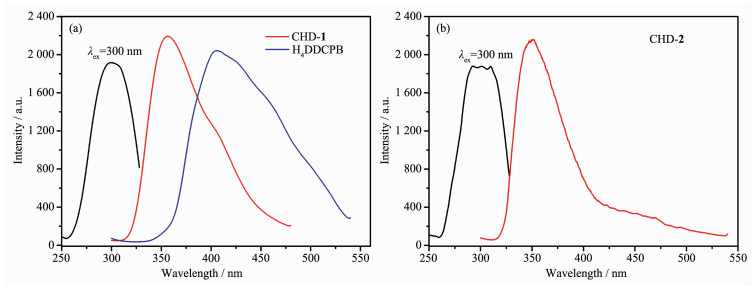
As depicted in Fig. 2, the solid-state luminescent properties of free ligand and compounds were determined at room temperature. The ligand exhibited an intense emission at 406 nm upon excitation at 300 nm, which can be attributed to π*-n or π*-π transi-tions. Both of them showed intense emission maximum at 357 and 350 nm upon excitation at 300 nm, respectively. The quantum yield of CHD-1 and CHD-2 were 2.56% and 1.91%, respectively. Compared with the emission peak of ligand, the spectra of compounds indicate the blue-shifts that can be ascribed to π*→π transition involving a ligand-centered excited state[32-33].
The potential of CHD-1 and CHD-2 for detecting of nitro aromatic compounds (NACs) have been investigated. The PXRD patterns for both CHD-1 and 2 after immersion in organic solvent were the same as those of CHD-1 and CHD-2, respectively, indicating the stability in the solvents (Fig.S1 and S2, supporting information). As the same treatment above, the excitations were conducted through the wavelength of 300 nm.
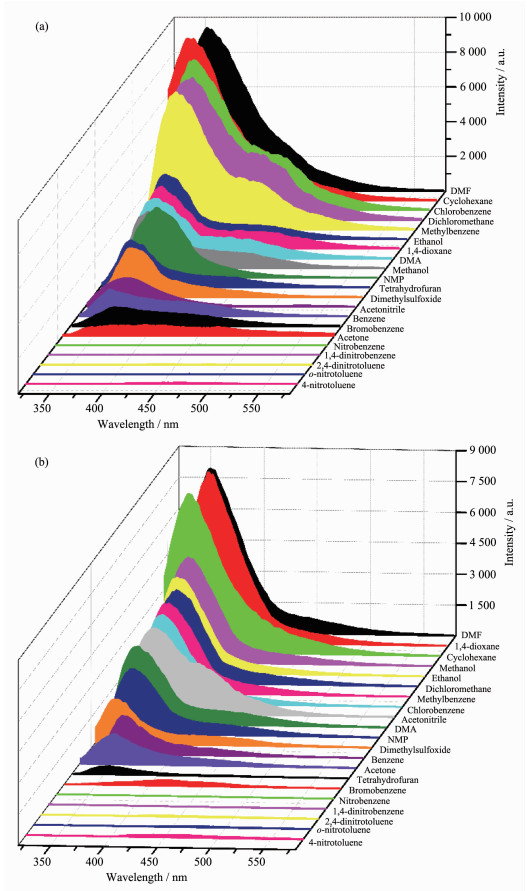
Firstly, the luminescent responses of CHD-1 and CHD-2 toward all organic solvent were performed. As shown in Fig. 3, a series of nitro aromatic compounds, including nitrobenzene (NB), 1, 4-dinitrobenzene (1, 4-DNB), 2, 4-dinitrotoluene (2, 4-DNT), 2-nitrotoluene (o-MNT) and 4-nitrotoluene (p-MNT), could completely quench emissive intensities of both compounds. In contrast, some organics, such as DMF, 1, 4-dioxane, toluene, could enhance the emissive intensities. However, the rest of other organics, containing alcohols (methanol, ethanol), ketones (acetone, N-methyl pyrrolidone), ethers (tetrahydrofuran, 1, 4-dioxane), nitriles (acetonitrile), arylhalide (chloroben-zene, bromobenzene), cyclane (cyclohexane), sulfox-ides (dimethylsulfoxide), dichloromethane, and even aromatic compounds (benzene) have a slightly effect on the luminescence intensity. These results indicate that CHD-1 and CHD-2 can act as a luminescent probe for the recognition of nitro aromatic compounds.
λex=300 nm
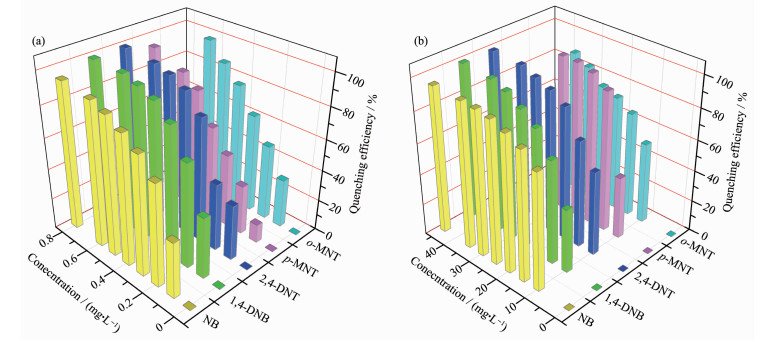
Secondly, in order to further check the detection limits of both compounds, the titration experiments of NACs have been conducted. The sensitive quenching effect of CHD-1 and CHD-2 were examined with a batch of their suspensions (3 mL DMA) with a gradually increased concentration of all nitro aromatic compounds (CHD-1: Fig.S3~S7; CHD-2: Fig.S8~S12). Luminescence quenching efficiency must be quantized, which can be calculated by the following equation:
|
$ {\rm{QE = }}\left( {1 - \frac{I}{{{I_0}}}} \right) \times 100\% $ |
(1) |
Where I0 is the initial emission intensity of CHD-1 and CHD-2, and I is the intensity of analytes-incorporated CHD-1 and CHD-2 and QE is quenching efficient.
Finally, as shown in Fig. 4, in the all titration experiments, the quenching efficiency of CHD-1 and CHD-2 increased drastically and reached 50% with the analytes amount in the very low concentration (0.3 and 10 mg·L-1, respectively). In the case of CHD-1, the emission decreased to 64% of the initial intensity upon the addition of NB at 0.2 mg·L-1. However, for CHD-2, 70% quenching of emission was observed at 10 mg·L-1. The concentrations of NB, 1, 4-DNB, 2, 4-DNT, o-MNT and p-MNT caused the complete emission quenching of CHD-1 at 0.3 mg·L-1 or so. However, the concentration of NACs fully quenched the luminescence of CHD-2 in a range of 30~45 mg·L-1. Totally, both compounds exhibit similar quenching for these NACs, but the response of CHD-1 to concen-trations of nitro compounds is much lower than that of CHD-2.
In order to obtain the detection limits of two MOFs, the Stern-Volmer (SV) equation was established[34]:
|
$ {\mathit{I}_0}/I = 1 + {K_{{\rm{SV}}}}{c_{\rm{M}}} $ |
(2) |
Wherein KSV stands for the quenching constant (L·mol-1) and cM is the concentration of NACs. For the NACs, the plot of I0/I vs cM was nearly linear in the range of low concentrations. The KSV values of NACs were calculated and listed in Table 1 and Table 2.
 下载:
导出CSV
下载:
导出CSV
| NAC | Intensity/a.u. | Average instensity/a.u. | Standard deviation | KSV/(L·mol-1) | LOD/(μmol·L-1) | ||||
| 1 | 2 | 3 | 4 | 5 | |||||
| NB | 3 037.32 | 3 039.68 | 3 034.59 | 3 040.21 | 3 032.80 | 3 036.92 | 3.20 | 1.684xl06 | 5.7 |
| 1, 4-DNB | 8 560.42 | 8 561.77 | 8 564.92 | 8 565.43 | 8 557.72 | 8 562.05 | 3.80 | 8.155×10⁶ | 1.4 |
| 2, 4-DNT | 9 918.26 | 9 925.50 | 9 916.44 | 9 910.65 | 9 930.01 | 9 920.17 | 7.63 | 8.507×10⁶ | 2.7 |
| p-MNT | 8 235.67 | 8 247.94 | 8 251.35 | 8 241.21 | 8 236.71 | 8 242.57 | 6.88 | 6.476×10⁵ | 32 |
| o-MNT | 9 651.23 | 9 658.72 | 9 647.36 | 9 659.41 | 9 649.94 | 9 653.33 | 5.42 | 9.170×10⁵ | 18 |
下载:
导出CSV
| NAC | Intensity/a.u. | Average instensity/a.u. | Standard deviation | KSV/(L·mol-1) | LOD/(mmol·L-1) | ||||
| 1 | 2 | 3 | 4 | 5 | |||||
| NB | 4 068.41 | 4 077.53 | 4 072.38 | 4 060.27 | 4 065.36 | 4 068.79 | 6.59 | 6.317×10⁴ | 0.31 |
| 1, 4-DNB | 10 071.32 | 10 069.49 | 10 054.27 | 10 062.28 | 10 073.81 | 10 066.23 | 3.81 | 7.623×10⁴ | 0.15 |
| 2, 4-DNT | 7 664.23 | 7 658.35 | 7 671.49 | 7 652.23 | 7 660.85 | 7 661.43 | 7.13 | 9.816×10⁴ | 0.21 |
| p-MNT | 8 623.71 | 8 615.21 | 8 633.18 | 8 625.27 | 8 618.59 | 8 623.19 | 6.87 | 1.057×10⁵ | 0.19 |
| o-MNT | 9 686.68 | 9 687.45 | 9 677.63 | 9 682.21 | 9 681.47 | 9 683.09 | 4.03 | 1.793×10⁴ | 0.67 |
On the basis of the KSV values and standard deviations by measuring luminescence intensity of blank solutions 5 times (Table 1 and 2), the detection of limit (LOD) was also calculated[35-37]:
|
$ \delta = \sqrt {\frac{{\sum {\left( {{\mathit{I}_0} - {I_{\rm{R}}}} \right)^2} }}{{N - 1}}} $ |
(3) |
|
$ {\rm{LOD = 3}}\delta {\rm{/}}{K_{{\rm{SV}}}} $ |
(4) |
where δ is the standard deviation of blank measure-ments (N=5); the values I0 and IR are the luminescence intensity of suspension in the absence and the average of I0, respectively. The high quenching constants KSV and the low detection limits (LOD) indicate extremely high sensitivity toward NACs.
The discrepancy in the response concentration between CHD-1 and CHD-2 can be explained as the pores inside CHD-1 that serve as recognition sites and enhance the host-guest interaction. So, comparison with CHD-1 and CHD-2, the detection response of CHD-1 is much more sensitive than that of CHD-2. It is noteworthy that the concentration of quenching the half luminescent intensity to nitro aromatics compounds locate in 0~0.3 and 0~15 mg·L-1, respectively, which is lower than that reported by Pang (0~1 000 mg· L-1)[38], Sun (0~100 mg·L-1)[39], Su (0~100 mg·L-1)[40] and Li (0~2 000 mg·L-1)[41]. The results illustrate that the porous frameworks could not only have a highly sensitivity towards a wide range of NACs, but also detects the trace amount of them.
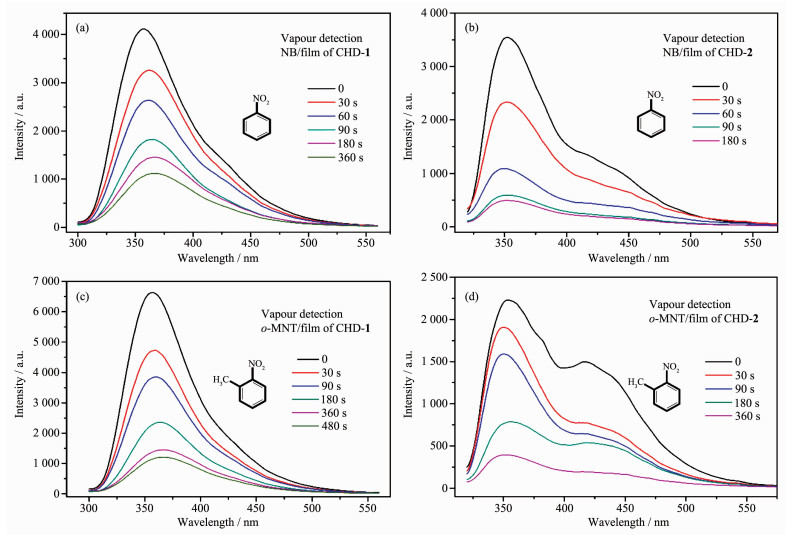
CHD-1 and CHD-2 were proved for their ability to act as solution-based sensory materials towards a series of nitro aromatic compounds. Compared to the common sol or gel sensing systems, the highly stable and porous CHD-1 and CHD-2 can provide a superior sensing platform to overcome the aggregation-caused quenching effect. Thus, the film based on two MOFs was prepared, and nitrobenzene (NB) and 2-nitroto-luene (o-MNT) was used as analytes to investigate the vapor-phase sensing capability of the film. Just as expected, the film displayed highly sensitive response towards the vapor of NB and o-MNT. The films of CHD-1 and CHD-2 were further exposed to analytes for 30, 60, 90, 180 and 360 s, and the luminescent intensity was measured immediately after each time period (Fig. 5). However, the luminescent intensity declined nearly 50% in as short as 60 s. The vapor pressure of NB and o-MNT were 0.02 and 0.03 kPa at 298 K, respectively, which were generated by depositing small amounts of the analytes into sealed bottle, creating a static headspace. The MOFs-based films were rapidly placed inside the sealed tubes for fixed amounts of time during the sensing procedure.
In a word, CHD-1 and CHD-2 not only act as luminescent probe for NACs, but also exhibit good vapor-phase detection ability towards them.
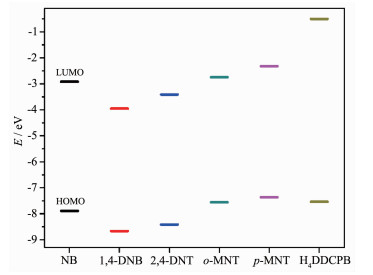
Since the nitro-based compounds are typical electron-withdrawing substituents[41], the sensing mech-anism can be proposed to be the photo-induced electron transfer (PET)[42-43]. Generally, for electron-withdrawing nitro-analytes, the electrons from the electron-rich framework are transferred to the lower LUMO of the electron-deceit nitro-compounds, not to the ground state of the framework. The excited electron of MOF-based sensors would be so tightly bound to nitro aromatic that transitions from excited state to ground state are blocked.
To verify the hypothesis, the frontier molecular orbital of these nitro aromatics and H4DDCPB were calculated with density functional theory at the B3LYP/6-31G* level[40]. As shown in Fig. 6, NB, 1, 4-DNB, 2, 4-DNT, o-MNT and p-MNT have the lower LUMO than H4DDCPB, which make them the strong electron acceptor in the excited state[39]. Accordingly, the highest selectivity for detection of 1, 4-DNB is consistent with its lowest LUMO energy level by comparison with all other NACs. However, the order of observed quenching efficiency (1, 4-DNB > 2, 4-DNT > NB > p-MNT > o-MNT) is not fully in accordance with the LUMO energies. As discussed above, the luminescence of CHD-1 and 2 are both ligand-centered and electron rich analytes. The reducibility of H4DDCPB, which has a high LUMO energy (-0.5 eV for H4DDCPB, -2.3~3.9 eV for the tested nitro aromatics), and electron deficiency of the nitro aromatics with low LUMO energy together facilitates the excited electron to transfer from the frameworks to the electron deficient NACs, leading to the quenching of luminescence.
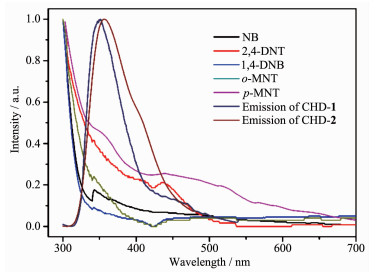
As shown in Fig. 7, the absorption spectra of nitro aromatics have a large overlap with the emission spectra of both compounds. If the absorption band of the analyte has an effective overlap with the emission band of the fluorophore, the resonance energy transfer can occur from fluorophore to non-emissive analyte[44]. Resonance energy transfer can dramatically enhance luminescence quenching efficiency and also improves sensitivity[45-47].
However, the discrepancy in structure factors between CHD-1 and CHD-2 in detection of NACs concentration also should be considered. The structure of CHD-1 and CHD-2 should play a significant role in the sensing process. The 2D microspores in the CHD-1 would enhance the interaction between nitro group and functional group (benzene of the ligand or coordinated DMF molecules) of frameworks, which result in quenching the luminescence with the lower concentration of analytes than that of CHD-2. Therefore, in this case, it is resemblance to the previous studies that the pore structures of MOFs are beneficial to their interaction with analytes[42]. The diameter of the tested nitro aromatics with van der Waals radius is within the range of 0.6~0.8 nm[48]. Thus, three types of open channels (1.11 nm×1.12 nm, 1.21 nm× 1.61 nm and 1.15 nm×0.77 nm along with a, b-axis excluding the van der Waals radii) within 1 are large enough to take in nitro aromatics. It is supposed that, during the immersion, the nitro aromatics would act as guest molecules to enter the channel and interact internally with the host framework causing a luminescence quenching.
In summary, two highly stable and porous MOFs based on Cd(Ⅱ) and Zn(Ⅱ) were successfully synth-esized under solvothermal conditions. Both compounds display highly selective and sensitive luminescence quenching on nitro aromatic compounds in gas and solution phase. In particular, compared with that of CHD-2, CHD-1 with 2D microspores possesses the lowest detection limits for nitro aromatic compounds locating in 0~4 μmol·L-1, which are lower than the reported compounds. The present works give a reference that to rationally design MOF-based senor with multidimensional microspores is beneficial to the detection of target; this may be useful under more realistic conditions in the future.
Supporting information is available at http://www.wjhxxb.cn
Cui S Q, Pu S Z, Dai Y F. Anal. Methods, 2015, 7:3593-3599 doi: 10.1039/C5AY00322A
Jung J Y, Kang M, Yoon J, et al. Chem. Commun., 2013, 49:176-178 doi: 10.1039/C2CC36626F
Ruan Y B, Li C, Xie J, et al. Chem. Commun., 2010, 46:9220-9222 doi: 10.1039/c0cc03825c
Jang Y K, Nam U C, Kim C. Dyes Pigm., 2013, 99:6-13 doi: 10.1016/j.dyepig.2013.04.002
Megharaj M, Pearson H W, Venkateswarlu K. Arch. Environ. Contam. Toxicol., 1991, 21:578-584 doi: 10.1007/BF01183881
Dunnick J K, Elwell M R. Fundam. Appl. Toxicol., 1994, 22:411-422 doi: 10.1006/faat.1994.1047
Uberol V, Bhatacharya S K. Water Environ. Res., 1997, 69:146-156 doi: 10.2175/106143097X125290
Jjiunju P M, Maher S, Cooks R G, et al. Anal. Chem., 2015, 87:10047-10055 doi: 10.1021/acs.analchem.5b02684
Peveler W J, Roldan A, Parkin I P, et al. ACS Nano, 2016, 10:1139-1146 doi: 10.1021/acsnano.5b06433
Xiong W, Liu X L, Zhao J C, et al. Anal. Chem., 2016, 88:10826-10830 doi: 10.1021/acs.analchem.6b03618
Zeng S, Baillargeat D, Yong K, et al. Chem. Soc. Rev., 2014, 43:3426-3452 doi: 10.1039/c3cs60479a
Wang H X, Wang N, Jiang Q W, et al. Environ. Sci. Technol., 2017, 51:3518-3525 doi: 10.1021/acs.est.6b06474
Zhou J M, Shi W, Cheng P, et al. Inorg. Chem., 2013, 52:8082-8090 doi: 10.1021/ic400770j
Lustig W P, Mukherjee S, Ghosh S K, et al. Chem. Soc. Rev., 2017, 46:3242-3285 doi: 10.1039/C6CS00930A
Chen Y Q, Li G R, Bu X H, et al. Chem. Sci., 2013, 4:3678-3682 doi: 10.1039/c3sc00057e
Kim T K, Lee J H., Moon H R, et al. Inorg. Chem., 2013, 52:589-595 https://www.ncbi.nlm.nih.gov/pubmed/23270469/
Zheng Q, Yang F, Zhou Y, et al. Inorg. Chem., 2013, 52:10368-10374 doi: 10.1021/ic401092j
Zhou H C, Long J R, Yaghi O M, et al. Chem. Rev., 2012, 112:673-674 doi: 10.1021/cr300014x
Tan Y X, Wang F and Zhang J, et al. Chem. Soc. Rev., 2018, 47:2130-2144 doi: 10.1039/C7CS00782E
Hu Y L, Ding M L, Jiang H L, et al. Chem. Commun., 2016, 52:5734-5737 doi: 10.1039/C6CC01597B
Yi F Y, Chen D, Jiang H L, et al. ChemPlusChem, 2016, 81:675-690 doi: 10.1002/cplu.201600137
程美令, 杨冰心, 唐晓艳, 等.无机化学学报, 2019, 35(4):687-694 http://www.wjhxxb.cn/wjhxxbcn/ch/reader/view_abstract.aspx?flag=1&file_no=20190415&journal_id=wjhxxbcnCHENG Mei-Ling, YANG Bin-Xin, TANG Xiao-Yan, et al. Chinese J. Inorg. Chem., 2019, 35(4):687-694 http://www.wjhxxb.cn/wjhxxbcn/ch/reader/view_abstract.aspx?flag=1&file_no=20190415&journal_id=wjhxxbcn
Hou S L, Dong J, Zhao B, et al. Anal. Chem., 2018, 90:1516-1519 doi: 10.1021/acs.analchem.7b05088
Hou Y, Xu H, Zhao B, et al. Chem. Commun., 2015, 51:6769-6772 doi: 10.1039/C5CC01181G
Zhou L J, Deng W H, Liu Q Y, et al. Inorg. Chem., 2016, 55:6271-6277 doi: 10.1021/acs.inorgchem.6b00928
Li Y J, Wang Y L, Liu Q Y, et al. Inorg. Chem., 2017, 56:2159-2164 doi: 10.1021/acs.inorgchem.6b02811
He R, Wang Y L, Liu Q Y, et al. Dyes Pigm., 2018, 151:342-347 doi: 10.1016/j.dyepig.2018.01.018
Fu H R, Yan L B, Wu N T, et al. J. Mater. Chem. A, 2018, 6:9183-9191 doi: 10.1039/C8TA02857E
Zhou Z, Han M L, Li D S, et al. Dalton Trans., 2018, 47:5359-5365 doi: 10.1039/C8DT00594J
Vishnoi P, Walawalkar M, Muruqavel R, et al. Phys. Chem. Chem. Phys., 2014, 16:10651-10658 doi: 10.1039/C4CP00930D
Li J, Men C P, Cui L, et al. Z. Anorg. Allg. Chem., 2018, 644:228-234 doi: 10.1002/zaac.201700406
Xue Y Y, He Y, Chen B, et al. J. Mater. Chem. A, 2013, 1:4525-4530 doi: 10.1039/c3ta01118f
Lakowicz J R. Principles of Fluorescence Spectroscopy. 3rd Ed. New York:Springer, 2006:5-33
Xiao Y, Cui Y, Zheng Q, Xiang S, et al. Chem. Commun., 2010, 46:5503-5505 doi: 10.1039/c0cc00148a
Chen S G, Shi Z Z, Zheng H G, et al. Cryst. Growth Des., 2017, 17:67-72 doi: 10.1021/acs.cgd.6b01197
Liu J, Ji G, Xiao J, et al. Inorg. Chem., 2017, 56:4197-4205 doi: 10.1021/acs.inorgchem.7b00157
Wu X X, Fu H R, Ma L F. Cryst. Growth Des., 2017, 17:6041-6048 doi: 10.1021/acs.cgd.7b01155
Pang L Y, Yang G P, Shi Q Z, et al. Cryst. Growth Des., 2014, 14:2954-2961 doi: 10.1021/cg5002418
Wang H, Yang W T, Sun Z M. Chem. Asian J., 2013, 8:982-989 doi: 10.1002/asia.201201184
Zhang S R, Du D Y, Su Z M, et al. Chem. Eur. J., 2014, 20:3589-3594 doi: 10.1002/chem.201304692
Wang G Y, Song C, Li Y, et al. J. Mater. Chem. A, 2014, 2:2213-2220 doi: 10.1039/C3TA14199C
Hu Z C, Deibert B J, Li J. Chem. Sov. Rev., 2014, 43:5815-5840 doi: 10.1039/C4CS00010B
Chen B, Yang Y, Lobkovsky E B, et al. Adv. Mater., 2007, 19:1693-1696 doi: 10.1002/adma.200601838
Nagarkar S S, Joarder B, Ghosh S K, et al. Angew. Chem. Int. Ed., 2013, 52(10):2881-2885 doi: 10.1002/anie.201208885
Wang J, Mei J, Tang B Z, et al. J. Mater. Chem. A, 2011, 21:4056-4059 doi: 10.1039/c0jm04100a
Wei W, Huang X, Tang X, et al. RSC Adv., 2012, 2:3765-3771 doi: 10.1039/c2ra20263h
Ramachandra S, Popovic Z D, Cola L D, et al. Small, 2011, 7(10):1488-1494 doi: 10.1002/smll.201100010
Wu Z F, Tan B, Huang X Y, et al. J. Mater. Chem. A, 2014, 2:6426-6431 doi: 10.1039/C3TA15071B

Figure 1 Scanning electron microscopy images of CHD-1 (a), CHD-2 (b), film of CHD-1 (c) and CHD-2 (d)

Figure 2 Luminescent spectra of CHD-1 and CHD-2 and free ligand in solid state at room temperature

Figure 3 Emission spectra of CHD-1 (a) and CHD-2 (b) immersed into different solvents
λex=300 nm

Figure 4 Plot of quenching efficiency of CHD-1 (a) and CHD-2 (b) immersed in DMA at different concentrations of several nitro aromatic compounds

Figure 5 Luminescent emission intensity for film of CHD-1 (a, c) and CHD-2 (b, d) upon exposure to NB and o-MNT vapor for 0~480 s

Figure 7 UV-Vis adsorption spectral overlap between normalized emission spectra of CHD-1, CHD-2 and normalized absorbance spectra of nitro aromatics
Table 1. Standard deviation (δ) and detection limits calculation for the detection of NACs by CHD-1
| NAC | Intensity/a.u. | Average instensity/a.u. | Standard deviation | KSV/(L·mol-1) | LOD/(μmol·L-1) | ||||
| 1 | 2 | 3 | 4 | 5 | |||||
| NB | 3 037.32 | 3 039.68 | 3 034.59 | 3 040.21 | 3 032.80 | 3 036.92 | 3.20 | 1.684xl06 | 5.7 |
| 1, 4-DNB | 8 560.42 | 8 561.77 | 8 564.92 | 8 565.43 | 8 557.72 | 8 562.05 | 3.80 | 8.155×10⁶ | 1.4 |
| 2, 4-DNT | 9 918.26 | 9 925.50 | 9 916.44 | 9 910.65 | 9 930.01 | 9 920.17 | 7.63 | 8.507×10⁶ | 2.7 |
| p-MNT | 8 235.67 | 8 247.94 | 8 251.35 | 8 241.21 | 8 236.71 | 8 242.57 | 6.88 | 6.476×10⁵ | 32 |
| o-MNT | 9 651.23 | 9 658.72 | 9 647.36 | 9 659.41 | 9 649.94 | 9 653.33 | 5.42 | 9.170×10⁵ | 18 |
 下载: 导出CSV
Table 2. Standard deviation (δ) and detection limits calculation for the detection of NACs for CHD-2
| NAC | Intensity/a.u. | Average instensity/a.u. | Standard deviation | KSV/(L·mol-1) | LOD/(mmol·L-1) | ||||
| 1 | 2 | 3 | 4 | 5 | |||||
| NB | 4 068.41 | 4 077.53 | 4 072.38 | 4 060.27 | 4 065.36 | 4 068.79 | 6.59 | 6.317×10⁴ | 0.31 |
| 1, 4-DNB | 10 071.32 | 10 069.49 | 10 054.27 | 10 062.28 | 10 073.81 | 10 066.23 | 3.81 | 7.623×10⁴ | 0.15 |
| 2, 4-DNT | 7 664.23 | 7 658.35 | 7 671.49 | 7 652.23 | 7 660.85 | 7 661.43 | 7.13 | 9.816×10⁴ | 0.21 |
| p-MNT | 8 623.71 | 8 615.21 | 8 633.18 | 8 625.27 | 8 618.59 | 8 623.19 | 6.87 | 1.057×10⁵ | 0.19 |
| o-MNT | 9 686.68 | 9 687.45 | 9 677.63 | 9 682.21 | 9 681.47 | 9 683.09 | 4.03 | 1.793×10⁴ | 0.67 |
下载: 导出CSV

 扫一扫看文章

扫一扫关注我们