Table 1.
Experiment proportion of CePO4-6LaPO4@xSiO2:Eu3+
Citation:
LIU Ru, WANG Xi-Gui. Luminescent Properties of a Red Phosphor CePO4-6LaPO4@4SiO2: Eu3+[J]. Chinese Journal of Inorganic Chemistry,
2019, 35(9): 1659-1664.
doi:
10.11862/CJIC.2019.202

红色荧光粉CePO4-6LaPO4@4SiO2:Eu3+的发光特性
摘要:
采用溶胶凝胶-高温固相法制备CePO4-6LaPO4@4SiO2:Eu3+荧光粉,通过XRD、TEM、EDS、IR以及激发光谱和发射光谱对荧光粉的结构和发光性能进行了表征。XRD和EDS结果证明了目标产物,其由晶态的LaPO4、CePO4和非晶态的SiO2构成;TEM图显示样品形貌为不规则形状,并且显示CePO4-6LaPO4@4SiO2:Eu3+荧光粉形成核壳结构;HRTEM图可以清楚地看出晶格条纹的形成;IR谱图显示结果与XRD和EDS的分析结果一致;荧光光谱图显示:在466 nm激发下,CePO4-6LaPO4@4SiO2:Eu3+荧光粉在615 nm处出现属于Eu3+的5D0→7F2跃迁的强烈红光发射。
English
Luminescent Properties of a Red Phosphor CePO4-6LaPO4@4SiO2: Eu3+
Abstract:
CePO4-6LaPO4@xSiO2:Eu3+ phosphors were synthesized by sol-gel method and high temperature solid state method. The structure and luminescence property of the phosphors were characterized by X-ray diffraction (XRD), transmission electron microscope (TEM), energy dispersive spectra (EDS), infrared spectra (IR), excitation spectra and emission spectra. The results of XRD and EDS confirmed target product, which was made up of crystalline state LaPO4, CePO4 and amorphous state SiO2; TEM showed that the morphology of the sample was irregular and CePO4-6LaPO4@4SiO2:Eu3+ phosphor formed core-shell structure; HRTEM image clearly showed the formation of lattice fringes; IR study was consistent with the XRD and EDS study. The fluorescence spectra showed that under excitation with 466 nm, the CePO4-6LaPO4@xSiO2:Eu3+ phosphor gave a strongest red emission at the 615 nm that belongs to the 5D0→7F2 transition of Eu3+.
-
Key words:
- phosphate
- / silicon dioxide
- / rare earth ion
- / luminescence property
-
0. Introduction
In recent years, much attention has been paid to rare earth doped various phosphors, because it has the advantages of long-term stability, long lifetime and higher luminescent efficiency, etc. And it has been studied extensively for their potential applications in light emitting devices, displays, solid state lasers, optical amplifiers, sensors and optoelectronics devices, etc[1-2]. Managing the red, green and blue light to get warm white light that makes our eyes feel comfortable. The use of red phosphor has more or less defects in recent years, which directly affects the quality of white luminescence. Therefore, the investigation of red phosphor has an important theoretical significance and practical application value[3-5].
In general, phosphors are composed of lumines-cent center and matrix materials. The rare earth Eu3+ shows red light under excitation with UV light and visible light and is an ideal red luminescence center. It is well known that due to the f-f forbidden transition of rare earth ions. The absorption efficiency is low, so it is necessary to find some methods to enhance the absorption efficiency. The method commonly used to enhance the absorption efficiency is to dope rare earth ions as an activator to select a suitable matrix. The energy absorbs from the matrix effectively transmits to the activation center (rare earth ion) to improve the luminescent efficiency. This shows that the choice of matrix is crucial. Phosphates have the advantages of charge stabilization, excellent thermal stability, high chemical stability and other excellent properties. So the phosphates have become an important matrix material. Meanwhile, the silicon dioxide have the advantages of good chemical stability, mechanical properties and low expansion coefficient. So it also becomes an excellent matrix material. But the reports about CePO4, LaPO4 or SiO2 as single matrix are very common[3, 6-10], the reports about CePO4, LaPO4 and SiO2 as composite matrix are unusual. In the paper, a novel red phosphor CePO4-6LaPO4@4SiO2:Eu3+ was successfully synthesized by sol gel method and high temperature solid state method. The structure and luminescence properties of CePO4-6LaPO4@4SiO2:Eu3+ phosphors also were investigated.
1. Experimental
1.1 Synthesis of samples
Firstly, the raw solution listed in Table 1 were added to clean beaker, which were stirred for 3 min. Then NH3·H2O was added to adjust pH value to 9 and kept stirring about 2 h to get a homogeneous sol. Secondly, the sol was transferred to a dry culture dish. After 2 days, it became a gel at room temperature. Next the samples were annealed at 900 ℃ for 17 hours. Finally, the samples were obtained.
Table 1

 下载:
导出CSV
下载:
导出CSV
Solution VTEOS/mL VEtOH/mL VLa(NO3)3·6H2O/mL VCe(NO3)3·6H2O/mL VEuCl3/mL VH3PO4/mL 1 0.76 4.24 9.00 1.50 4.39 10.50 2 1.13 3.87 9.00 1.50 4.39 10.50 3 1.50 3.50 9.00 1.50 4.39 10.50 4 1.89 3.11 9.00 1.50 4.39 10.50 1.2 Chemicals
NH3·H2O purchased from Tianjin Guangfu Fine Chemical Research Institute (98.0%), which was dissolved in distilled water to obtain La(NO3)3 solution. Eu2O3 was purchased from Baotou Rare Earth Institute (99.99%), which was dissolved in HCl solution to obtain EuCl3 (0.16 mol·L-1). H3PO4 was purchased from Tianjin Chemical Reagent Third Factory (85.0%). NH3·H2O was purchased from Tianjin Sailboat Chemical Reagent Technology Co., Ltd. (25%~28%). CH3COOH was purchased from Tianjin Beilian Fine Chemicals Development Co., Ltd (99.7%).
1.3 Characterization
The X-ray diffraction (XRD) pattern of powder samples were measured on a Rigaku-Dmax 2500 X diffractometer equipped with Cu Kα radiation (λ=0.154 05 nm, U=40 kV, I=30 mA, 2θ=10°~80°); A 200 keV JEOL 2010 (HRTEM) micros-cope was used to record Transmission Electron Micros-copy (TEM) images; IR spectra was acquired with using a Hitachi U-4100 UV-VIS-NIR spectrometer with the KBr pellet technique; The excitation and emission spectra were measured with using a F-4500 spectrophotometer equipped with a 150 W xenon lamp as the excitation source.
2. Results and discussion
2.1 XRD study
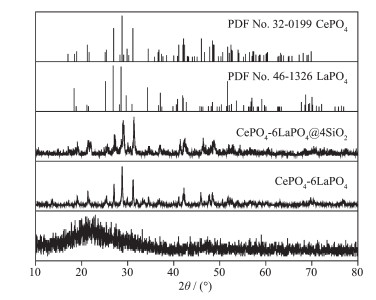
XRD patterns of CePO4-6LaPO4:Eu3+ and CePO4-6LaPO4@4SiO2:Eu3+ phosphors were reported in Fig. 1. For SiO2 particles, no diffraction peak was observed, excepted for a very small broad peak at 2θ=22°, characteristic of amorphous silica[11-12]. In addition, all the diffraction peaks of CePO4-6LaPO4@4SiO2:Eu3+ phosphor were agreed with the standard card (PDF No.32-0199 and No.46-1326). The indicated that a low amount of SiO2 almost did not affect the crystal structure of phosphate. The above results showed that the sample was made up of crystalline state CePO4, LaPO4 and amorphous state SiO2. Note that the intensity diffraction peaks of CePO4-6LaPO4@4SiO2:Eu3+ phos-phor were a little improved than those of CePO4-6LaPO4:Eu3+ phosphor, suggesting that the size of the crystalline grains of phosphate on the surfaces of the silica particles in the composite was smaller than that in the pure phosphate. At the same time, no impurity peak from the third phase was detected, which indicated Eu3+ entered lattice in the matrix and occupied the site of La3+ and Ce3+ in the matrix to form a stable solid solution without affecting the structure of host lattice.
Figure 1
According to previous reports[10, 12], to form a new solid solution, the radius in the percentage difference (Dr) between the doped ions and the possibly substi-tuted ion should be less than 15%, see the following formula:
${D_{\rm{r}}} = \frac{{{R_1}\left( {{\rm{CN}}} \right) - {R_2}\left( {{\rm{CN}}} \right)}}{{{R_1}\left({{\rm{CN}}} \right)}} \times 100 $
Where R1(CN) is the radius of the matrix cation and R2(CN) is the radius of the doped ions. Herein, the values of R1(CN) (Ce3+ and La3+) and R2(CN) (Eu3+) are respectively 0.103, 0.106 and 0.095. According to this formula, the Dr value respectively was 7.8% and 10.4%, and less than 15%, further confirmed that the Eu3+ occupied the site of the La3+ and Ce3+ in the matrix to form a stable solid solution without affecting the structure of the CePO4 and LaPO4 host lattice.
2.2 TEM study
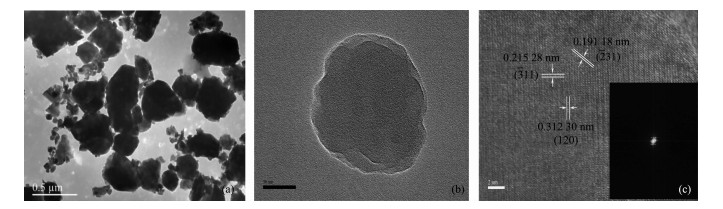
TEM image of CePO4-6LaPO4@4SiO2:Eu3+ phos-phor was reported in Fig. 2(a). It showed that the grain morphology was irregular shape. The grain size was measured by Nano Measure App and was 0.38 μm. According to the XRD data, the grain size was calculated by Scherrer Formula and was 0.31μm. Both results were consistent.
Figure 2
Fig. 2(b) showed TEM image of CePO4-6LaPO4@ 4SiO2:Eu3+ phosphor, CePO4-6LaPO4@4SiO2:Eu3+ phos-phor was further sub-jected to TEM analysis to deter-mine the core-shell structure. The core-shell structure of the sample could be seen clearly due to the different electron penetrability of the core and shell. The core could be seen as a black irregular sphere and the shells had a gray color.
The HRTEM image of CePO4-6LaPO4@4SiO2:Eu3+ phosphor was reported in Fig. 2(c). It clearly showed the CePO4-6LaPO4@4SiO2 lattice and lattice fringes with an inter-planar spacing of 0.191 18, 0.215 28 and 0.312 30 nm, which had good match with those of the standard pattern of PDF card (LaPO4/CePO4), i.e., spacing for (231) 0.191 18 nm, (311) 0.215 28 nm and (120) 0.312 30 nm.
2.3 EDS study
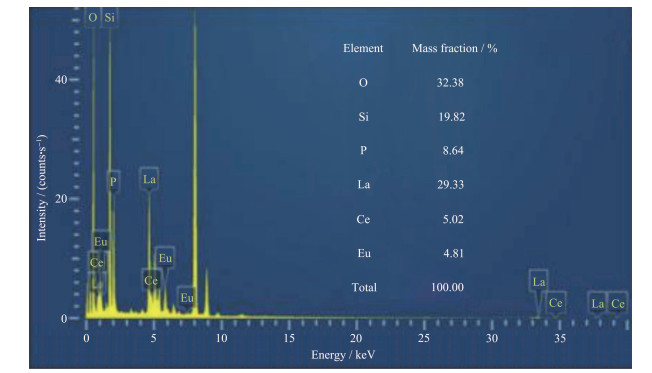
The EDS spectrum of CePO4-6LaPO4@4SiO2:Eu3+ phosphor was reported in Fig. 3. The elements of O, Si, P, La, Ce and Eu were observed in the spectrum, and the ratio of La, Ce and Si elements was 6:1:4, which clearly indicated the formation of CePO4-6LaPO4@ 4SiO2:Eu3+ phosphor.
Figure 3
2.4 IR study
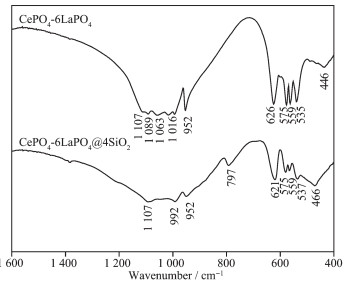
IR spectra of CePO4-6LaPO4:Eu3+ and CePO4-6LaPO4@4SiO2:Eu3+ phosphor were reported in Fig. 4. The absorption bands from 1 600 cm-1 to 400 cm-1 were observed, which had different infrared absorption peaks. In the spectra of CePO4-6LaPO4 as the matrix, the three peaks at 1 089, 1 063 and 1 016 cm-1 were obtained by cleaving at 992 cm-1 and corresponded the asymmetric stretching vibration peak of P-O, which was the characteristic of monoclinic phosphates[17]. In the spectra of CePO4-6LaPO4@4SiO2 as the matrix, the absorption peaks at 1 107 cm-1 belonged to anti-stretching vibration peak of Si-O-Si. The absorption peaks located at 992, 952 cm-1 were observed in the region of the stretching vibration of PO43- group. The absorption peak at 797 cm-1 was stretching vibration peak of Si-O-Si. The band located at 621 cm-1 was observed in the region of O=P-O bending vibrations (it compared with the CePO4-6LaPO4 as the matrix, the peak position occurred blue shift). The bands at 575, 559 and 537 cm-1 were the bending vibrations of O-P-O[13-14] (it compared with CePO4-6LaPO4 as the matrix, the peak at 537 cm-1 occurred red shift). The absorption peak at 466 cm-1 was bending vibration peak of Si-O-Si (it compared with CePO4-6LaPO4 as matrix, the peak position occurred red shift). According to the above analysis, it showed that the sample was made up of phosphate and silicon dioxide, which was consistent with the result of XRD study.
Figure 4
The polarization of Eu3+ was bigger than La3+/Ce3+, Eu3+ replaced La3+/Ce3+, which caused a slight change in the shape of PO43- electron cloud. So the infrared vibration peak of PO43- caused red shift and blue shift in different degrees.
2.5 Luminescence study
2.5.1 Excitation and emission spectrum of CePO4-6LaPO4@xSiO2:Eu3+
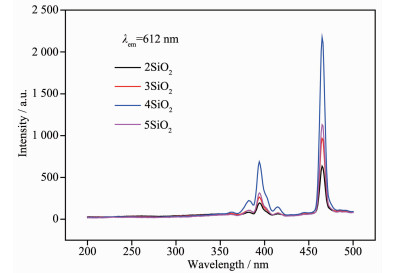
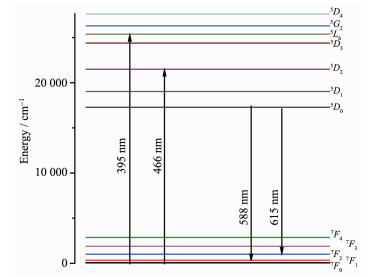
The excitation spectra of core-shell structure CePO4-6LaPO4@xSiO2:Eu3+ were reported in Fig. 5. The excitation spectrum consisted of two sharp peaks at 395 and 466 nm, and the peaks corresponded to the transitions from 7F0 to 5L6 (395 nm) and 5D2 (466 nm). The emission intensity was strongest at 466 nm, so 466 nm was selected as the optimum excitation wavelength.
Figure 5
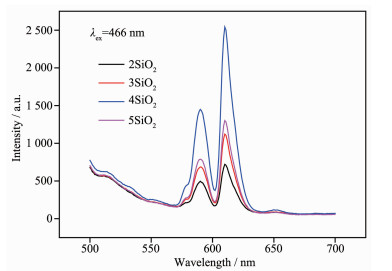
The emission spectra of core-shell structure CePO4-6LaPO4@xSiO2:Eu3+ phosphor were reported in Fig. 6. The emission peaks of 588 and 615 nm corresponded to the transitions from 5D0 to 7F1 and 7F2, respectively. The core shell CePO4-6LaPO4@xSiO2:Eu3+ had a luminous intensity that increased first and then decreased with the increased of SiO2 in the matrix, and there is an optimal core-shell ratio. The shell thickness was measured by the molar ratio of core to the element contained in the shell[18], when the core shell ratio was 1:4, the sample had the brightest red light at 615 nm. Because a large amount of Eu3+ was surrounded by SiO2 and even diffuses into the SiO2 network structure, greatly reducing the possibility of Eu3+ being in the surface state. That is to say, the appearance of the core-shell structure increased the distance between Eu3+ and the surface, thus changing the surrounding matrix environment of Eu3+ near the original surface (from unevenness to relatively uniform), which hindered the energy transfer of the original Eu3+ and surface states, so that improved luminous intensity of the sample. When the core shell ratio was more than 1:4, the luminescence intensity gradually decreased. As the thickness of the shell continued to increase, the thicker shell provided a uniform matrix environment. But the loss of light through the more, which led to the excitation light could be finally utilized became less, so that causing the emitted light to weaken. The above results indicated that the optimum ratio of phosphate to SiO2 was 1:4.
Figure 6
2.5.2 Luminescence study of CePO4-6LaPO4@4SiO2: Eu3+ and CePO4-6LaPO4:Eu3+ phosphors
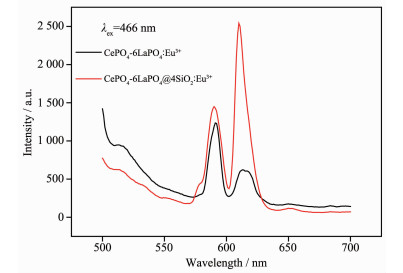
The emission spectra of CePO4-6LaPO4@4SiO2:Eu3+ were reported in Fig. 7. Before the addition of SiO2, the main peak of CePO4-6LaPO4:Eu3+ phosphor was located at 588 nm. After the addition of SiO2, the main peak of CePO4-6LaPO4@4SiO2:Eu3+ phosphor was located at 615 nm. The showed that the addition of SiO2 effectively increased red light intensity of the sample.
Figure 7
The sample emitted orange light and red light, which was closely related to the crystallographic position of Eu3+ [15-16]. The transition 5D0→7F1 was dominant when Eu3+ occupied the lattice site with inversion center, and the sample emitted orange light (the main peak was located at 588 nm). The transition 5D0→7F2 was dominant when Eu3+ occupied the lattice site without inversion center, and the sample emitted red light (the main peak was located at 615 nm). In the experiment, the Eu3+ of CePO4-6LaPO4:Eu3+ phosphor occupied the lattice site with inversion center, so the sample emitted orange light; the Eu3+ of CePO4-6LaPO4 @4SiO2:Eu3+ phosphor occupied the lattice site without inversion center, so the sample emitted red light. It as shown as Fig. 8. The intensity pattern of the emission lines demonstrate that the Eu3+ was successfully doped in the sample. In addition, the formation of core-shell structure was also beneficial to red luminescence[18-19].
Figure 8
3. Conclusions
The CePO4-6LaPO4@xSiO2:Eu3+ red phosphors were synthesized by sol gel method and high temperature solid statue method. The results showed that the optimal excitation wavelength of the phosphor was 466 nm and the optimum ratio of phosphate to SiO2 was 1:4. And the appearance of core-shell structure CePO4-6LaPO4@4SiO2 was more conducive to the doping of Eu3+ and improved the red light of the sample. It indi-cated that CePO4-6LaPO4@4SiO2:Eu3+ could be a good candidate as red phosphor or it combined with blue and green phosphor to get ideal quality warm WLED.
-
-
[1]
Du P, Yu J S. J. Lumin., 2016, 179:451-456 doi: 10.1016/j.jlumin.2016.07.045
-
[2]
Li K, Lian H Z, Shang M M, et al. Dalton Trans., 2015, 44(47):20542-20550 doi: 10.1039/C5DT03565A
-
[3]
Yang J Y, Jia X H, Zeng X D, et al. J. Mater. Sci., 2015, 50(12):4405-4411 doi: 10.1007/s10853-015-8996-y
-
[4]
金叶, 秦伟平, 张继森, 等.光谱学与光谱分析, 2008, 28(12):2768 doi: 10.3964/j.issn.1000-0593(2008)12-2768-04JIN Ye, QIN Wei-Ping, ZHANG Ji-Sen, et al. Spectrosc. Spect. Anal., 2008, 28(12):2768 doi: 10.3964/j.issn.1000-0593(2008)12-2768-04
-
[5]
Gupta S K, Ghosh P S, Sahu M, et al. RSC Adv., 2015, 5(72):58832-58842 doi: 10.1039/C5RA09076H
-
[6]
王喜贵, 吴红英, 谢大弢, 等.中国稀土学报, 2002, 20(3):172-176 http://www.cnki.com.cn/Article/CJFDTotal-YXTB200203002.htmWANG Xi-Gui, WU Hong-Ying, XIE Da-Tao, et al. J. Rare Earth, 2002, 20(3):172-176 http://www.cnki.com.cn/Article/CJFDTotal-YXTB200203002.htm
-
[7]
吴雪艳, 尤洪鹏, 曾小青, 等.高等学校化学学报, 2003, 24(1):1-4 doi: 10.3321/j.issn:0251-0790.2003.01.001WU Xue-Yan, YOU Hong-Peng, ZENG Xiao-Qing, et al. Chem. J. Chinese Universities, 2003, 24(1):1-4 doi: 10.3321/j.issn:0251-0790.2003.01.001
-
[8]
Hatada N, Nose Y, Kuramitsu A, et al. J. Mater. Chem., 2011, 21(24):8781-8786 doi: 10.1039/c0jm03171b
-
[9]
Cao M H, Hu C W, Wu Q Y, et al. Nanotechnology, 2005, 16(2):282-286 http://www.ncbi.nlm.nih.gov/pubmed/21727437
-
[10]
Riwotzki K, Meyssamy H, Kornowski A, et al. J. Phys. Chem. B, 2000, 104(13)2824-2828 doi: 10.1021/jp993581r
-
[11]
Zhang J M, Zhao D L, Zhang D D, et al. Asian J. Chem., 2014, 26:2211-2214 doi: 10.14233/ajchem.2014.15656
-
[12]
Musi S, Filipovi-Vincekovi N, Sekovani L, et al. J. Chem. Eng., 2011, 28:89-94
-
[13]
Ray S, Nair G B, Tadge P, et al. J. Lumin., 2018, 194:64-71 doi: 10.1016/j.jlumin.2017.10.015
-
[14]
Krishna B L, Jeon Y I, Yu J S. J. Alloy Compd., 2014, 614:443-447 doi: 10.1016/j.jallcom.2014.06.108
-
[15]
王喜贵, 薄素玲, 齐霞, 等.无机化学学报, 2009, 25(2):350-353 doi: 10.3321/j.issn:1001-4861.2009.02.028WANG Xi-Gui, BO Su-Ling, QI Xia, et al. Chinese J. Inorg. Chem., 2009, 25(2):350-353 doi: 10.3321/j.issn:1001-4861.2009.02.028
-
[16]
曹娇兰, 王喜贵.无机化学学报, 2018, 34(2):325-330 http://www.wjhxxb.cn/wjhxxbcn/ch/reader/view_abstract.aspx?file_no=20180215&flag=1CAO Jiao-Lan, WANG Xi-Gui. Chinese J. Inorg. Chem., 2018, 34(2):325-330 http://www.wjhxxb.cn/wjhxxbcn/ch/reader/view_abstract.aspx?file_no=20180215&flag=1
-
[17]
Zhao M L, Li G S, Li L P. Cryst. Growth Des., 2012, 12:3983-3991 doi: 10.1021/cg300451d
-
[18]
Lim M A, Seok Ⅱ S, Ghung W J, et al. Opt. Mater., 2008, 31(2):201-205
-
[19]
刘桂霞, 李若兰, 董向婷, 等.发光学报, 2011, 32(5):466-470 http://en.cnki.com.cn/Article_en/CJFDTOTAL-FGXB201003027.htmLIU Gui-Xia, LI Ruo-Lan, DONG Xiang-Ting, et al. Chin. J. Lumin., 2011, 32(5):466-470 http://en.cnki.com.cn/Article_en/CJFDTOTAL-FGXB201003027.htm
-
[1]
-
Table 1. Experiment proportion of CePO4-6LaPO4@xSiO2:Eu3+
Solution VTEOS/mL VEtOH/mL VLa(NO3)3·6H2O/mL VCe(NO3)3·6H2O/mL VEuCl3/mL VH3PO4/mL 1 0.76 4.24 9.00 1.50 4.39 10.50 2 1.13 3.87 9.00 1.50 4.39 10.50 3 1.50 3.50 9.00 1.50 4.39 10.50 4 1.89 3.11 9.00 1.50 4.39 10.50  下载: 导出CSV
-


 扫一扫看文章
计量
- PDF下载量: 2
- 文章访问数: 530
- HTML全文浏览量: 103
