Figure 1.
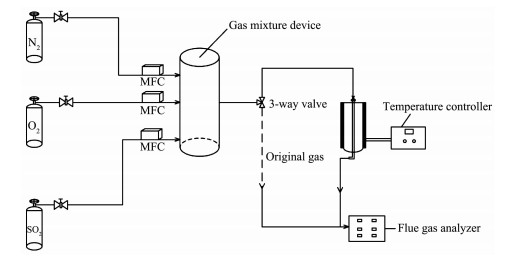
Flowchart of the experimental system
Cyclic Regeneration of Potassium-Modified Activated Semi-coke by Impregnation Method for Flue Gas Desulfurization
Hai-Tao WU , Qi-Dong ZHUO , Zi YANG , Jian-Dong SHI , Hong-Jian CHEN , Wen-Yu YIN , Xiao-Yan TANG , Yun-Shen MA , Rong-Xin YUAN

Sulfur dioxide (SO2) is one of the major air pollu-tants that can cause various problems to the environ-ment and public health. The thermal power and steel industries are leading sources for the emission of SO2[1]. In order to solve the problem of SO2 pollution, many technologies have been developed. Among these, the adsorption-catalysis technology for SO2 removal of flue gas has a good prospect of application[2-4].
Many studies have indicated that carbonaceous materials, including activated carbon, coke, semi-coke, and activated carbon fibers, can effectively remove SO2 with little negative effect on the environment. The carbonaceous materials have excellent performance in the absorption of SO2 due to high surface area, rich pore structure and oxygen-containing functional groups on the carbon surface[5-6]. Previous studies have shown that activated carbon (coke) modified by metal or their oxides, such as Fe[7-8], V[9], Ti[10] and Mn[11], can significantly improve the desulfurization capacity, but with the process of reaction, the desulfurization capacity would decline due to the deposition of desulfurization byproducts on the surface or in the pore of catalysts. The study by Guo[12] has shown that Fe modified activated carbon has a sulfur capacity of 231 mg·g-1, using Fe2O3, Fe3O4 and FeO as the active components, but the generated sulfate in the desulfurization process, such as Fe2(SO4)3, can result in a loss of active compo-nents. The adsorbate in the pore or on the surface of catalysts can be removed by thermal regeneration. The regeneration temperatures could not be too high for industrial applications. As reported by Liu et al.[3], the iron-modified activated coke that has SO2 removal activity at 200 ℃ was regenerated in NH3 at 350 ℃. Guo et al.[13] studied the desulfurization activity of Ni/AC and the result shows that the catalyst calcined at 550 ℃ and 800 ℃ has a higher desulfurization activity. The study by Li et al.[14] has shown that CuO/AC catalyst lodaed with 1%(w/w) CeO2 possesses the best desulfurization effect. CeO2 additive enhances the dispersion degree of CuO on the surface of the catalyst.
In this study, the potassium-modified activated semi-coke (K/ASC) prepared by impregnation method, which shows high SO2 removal ability at 120 ℃, was used to investigate its regeneration properties for flue gas desulfurization. The desulfurization performance and surface chemistry of the regenerated K/ASC were carefully analyzed via X-ray photoelectron spectros-copy (XPS), scanning electron microscope (SEM), X-ray powder diffraction (XRD), etc. In addition, the regeneration mechanism of the ASC modified by metal was discussed.
All chemicals used in this work were analytic reagent grade. The original semi-coke was first crushed and sieved to 10~20 mesh (referred to as SC). The SC particles were activated using nitric acid (10%, w/w) at 200 ℃ for 2 h in a stainless steel autoclave, and the particles were washed with distilled water until pH=7.0 in the washing liquid after activating, then dried at 120 ℃ for 8 h (referred to as ASC).
Catalysts were prepared by impregnation. Potassium carbonate was dissolved in distilled water as the precursors. 20 g of ASC was impregnated with 20 mL of the precursor to achieve 2.5%, 5%, 7.5%, 10% and 15%(w/w) K2CO3 loading, and dried at 120 ℃ in an oven overnight. The samples were calcined in a tube furnace from room temperature to 600 ℃ with a heating rate of 5 ℃·min-1 under N2 and maintained for 2 h, then cooled to room temperature in N2, labeled as K2.5, K5, K7.5, K10, K15, respectively.
The desulfurization activity of samples was evaluated in a fixed-bed reactor under atmospheric pressure, and the experimental apparatus is presented in Fig. 1.
A sample (20 g) was packed into the reactor. The simulated flue gas contained 0.09%(V/V) SO2, 11%(V/V) O2, and N2 as balance. The gas flow velocity was 900 mL·min-1. The inlet and outlet concentration of SO2 were monitored online by a flue gas analyzer continuously, and the desulfurization test was stopped when the outlet concentration of SO2 reached 10% of the inlet. The sulfur capacity was determined by the integration of the SO2 breakthrough curve and was presented as the amount of SO2 removal per unit mass of activated semi-coke, while the corresponding working time was regarded as the breakthrough time. The sulfur capacity of samples were calculated based on the following formula[15]:
|
${\rm{Sc = }}\int_0^t {\frac{{MQ\left( {{C_0} - {C_t}} \right){{10}^{ - 6}}}}{{22.4m}}} {\rm{d}}t$ |
where Sc is sulfur capacity (mg·g-1), M the SO2 molecular weight, Q the gas flow (mL·min-1), t the working time, C0 the inlet SO2 concentration, Ct the outlet SO2 concentration at working time of t, and m the sample mass.
The used K10 (referred to as K10-S) was regenerated in a tube furnace at 400, 500, 600 and 700 ℃ for 2 h in a pure N2 (Flow rate: 50 mL·min-1). The heating rate was 5 ℃·min-1. Then the sample was cooled to room temperature in N2 atmosphere. The thermal-regenerated sample was denoted as K10-R-T, where T is the regeneration temperature.
X-ray photoelectron spectroscopy (XPS) was applied to determine the surface chemical composition and functional groups, using an XSAM-800 spectro-meter (KRATOS Co., UK) with Al (1 486.6 eV) under ultrahigh vacuum (UHV) at 12 kV and 15 mA. Scann-ing electron microscopy (SEM) was used to obtain the surface morphology of the samples. It was taken in Sigma scanning electron microscope (Carl Zeiss AG, Germany) with a voltage of 20 kV. X-ray powder diffraction (XRD) was performed in a multifunctional X-ray diffractometer using Cu Kα radiation (λ=0.154 06 nm) at a rate of 10°·min-1 from 5° to 90° (2θ) and operated at 30 kV and 30 mA. The structure parameters of the samples were measured at -196 ℃ using ASAP 2020 analyzer. The specific surface areas (SBET) was calculated using the BET equation by N2 adsorption. The micropore volume (Vmicro) was calculated by a t-plot method. The Fourier transform infrared spectros-copy (FTIR) spectra were recorded using the KBr pellet technique on a Thermo spectrometer in the 4 000~400 cm-1 spectral range.
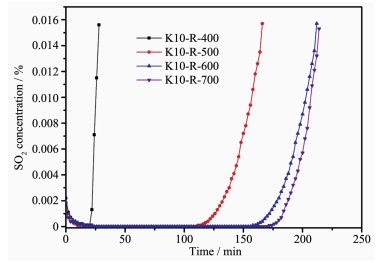
The relationship between outlet concentration of SO2 and working time of all samples is presented in Fig. 2. The corresponding sulfur capacity and breakthrough time are summarized in Table 1.
 下载:
导出CSV
下载:
导出CSV
| Sample | Sulfur capacity / (mg·g-1) | Breakthrough time / min |
| SC | 1.5 | 5 |
| ASC | 23.8 | 102 |
| K2.5 | 28.5 | 124 |
| K5 | 35.3 | 136 |
| K7.5 | 40.9 | 162 |
| K10 | 55.4 | 188 |
| K15 | 56.2 | 190 |
ASC exhibited better SO2 removal ability compared to SC, showing that nitric acid pretreatment can improve the SO2 removal ability. This might be due to an increase of oxygen containing functional groups on the surface of activated semi-coke after nitric acid treatment[13]. The sulfur capacity of K/ASC samples was significantly improved when K2CO3 species were blended into activated semi-coke, indicating that K2CO3 species plays a key role in the SO2 removal process. As the ratio of K2CO3 on activated semi-coke was increased from 2.5% to 15%, the sulfur capacity and breakthrough time increased gradually. K15 exhibited the best SO2 removal ability with the breakthrough sulfur capacity of 56.2 mg·g-1 and the breakthrough time of 190 min. The SO2 removal ability of K10 was similar to K15 and corresponded to breakthrough sulfur capacity of 55.4 mg·g-1 and breakthrough time of 188 min, which means that when the ratio of K2CO3 was higher than 10%, the desulfurization capacity was not obviously increased. In Fig. 2, it shows that the desulfurization activity of K10 is improved significantly with increasing of the regeneration temperature from 400 to 600 ℃. However, the breakthrough time of K10 basically unchanged when the regeneration temperature exceeded 600 ℃. According to the results in Table 1 and Fig. 2, the SO2 removal ability of the samples is in the order: AC < ASC < K2.5 < K5 < K7.5 < K15≈K10, and K10-R-400 < K10-R-500 < K10-R-700≈K10-R-600.
In order to study their regeneration performance, K10 was selected for thermal regeneration test. The samples after regeneration were denoted as K10-R-600-n, where n is the number of regeneration cycle. The desulfurization performance of K10-R-600-n expressed as sulfur capacity and breakthrough time is shown in Table 2.
下载:
导出CSV
| Sample | Sulfur capacity / (mg·g-1) | Breakthrough time / min |
| K10 | 55.4 | 188 |
| K10-600-1 | 56.0 | 190 |
| K10-600-2 | 62.5 | 212 |
| K10-600-3 | 66.6 | 226 |
| K10-600-4 | 68.9 | 242 |
| K10-600-5 | 61.3 | 208 |
| K10-600-6 | 52.5 | 178 |
| K10-600-7 | 51.9 | 176 |
| K10-600-8 | 48.3 | 164 |
| K10-600-9 | 47.2 | 160 |
| K10-600-10 | 38.9 | 132 |
| K10-600-11 | 36.6 | 124 |
As shown above, the desulfurization performance of the K10-R-600-n can be divided into two stages: one is the increasing stage from the 1st to the 4th regeneration cycle; the other is the decreasing stage from the 5th to the 11th regeneration cycle respectively. In the increasing stage, the desulfurization performance of K10-R-600-n showed a certain degree of improvement with increasing regeneration cycles. The regeneration treatment can significantly increase the oxygen functional groups on surface of K10, especially the basic functional groups, which contributed more to the desulfurization performance[15]. The sulfur capacity reached its maximum after four regeneration cycles, the sulfur capacity of K10-R-600-4 was 68.9 mg·g-1, 24.37% much higher than that of K10. From the fifth regeneration cycle, the desulfurization activity of K10-R-600-n entered declining phase and lower than that of K10, except K10-R-600-5. The reduction of desulfurization performance became slow from the sixth to the ninth regeneration cycle. The sulfur capacity of K10-R-600-9 was 47.2 mg·g-1, which was 85.20% of K10. K10-R-600-10 showed a clear reduction of the sulfur capacity, which decreased from 47.2 to 38.9 mg·g-1 and was 70.22% of K10. Jiang et al.[16] studied cyclic regeneration of pyrolusite-modified activated coke (ACP) for flue gas desulfuriza-tion, and the results showed that the sulfur capacity was less than 50% of the ACP after ten regeneration cycles. In this study, the desulfurization performance of K10 increases from the first to the fourth regeneration cycle and maintains relatively better desulfurization capacity even after ten regeneration cycles. It is worth noting that the catalyst is a high-activity and low-cost SC desulfurizer, and has industrial application prospects.
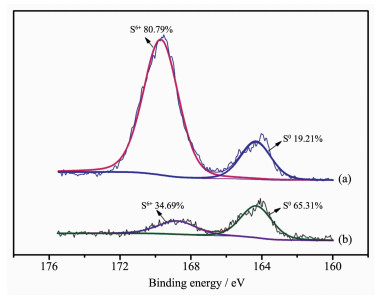
In order to study the changes of surface species after SO2 removal, K10 and K10-S were characterized by XPS, XRD, N2 adsorption-desorption, FTIR and SEM. In Fig. 3 (XPS spectra), the S2p spectra of the catalysts before and after desulfurization are fitting into two peaks. S6+ binding energy of K10 and K10-S were 168.78 and 169.71 eV, respectively, and they correspond to SO42- [17-18]. It is proved that SO42- is derived from the oxidation reaction of SO2 and O2 on the surface of catalysts. S0 binding energy of K10 and K10-S were 164.31 and 164.34 eV[19-20], respectively, which correspond to original species of catalysts. This result shows that the absorbed SO2 is basically oxidized to SO42-.
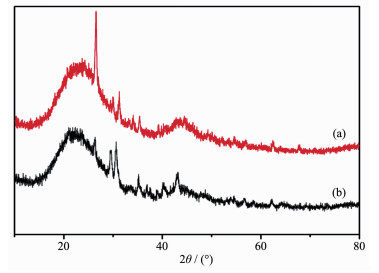
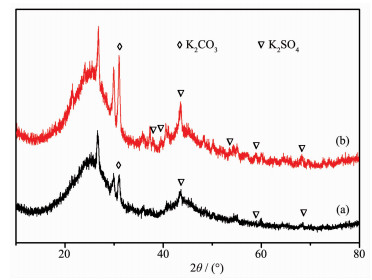
In Fig. 4(a), the diffraction peaks observed at 2θ=31.03°, 38.78°, 49.21° and 57.56° are attributed to K2CO3 (PDF No.27-1348). In Fig. 4(b), some peaks of K10-S disappear or change compared to that of K10. The diffraction peaks of K2SO4 at 2θ=29.75°, 30.78°, 40.42°, 43.02°, 43.28°, 43.43°, 53.51°, 58.70° (PDF No.05-0613) were observed. It means that K2CO3 is transformed into K2SO4 after desulfurization. As shown in Fig. 5, the intensity of K2CO3 is recovered relatively after regenerating. In Fig. 5(b), the peaks belonging to K2SO4 become more intense comparing to that in Fig. 5(a). This means that K2SO4 would accumulate gradually in the K10 with an increase of desulfurization-regeneration cycles.
The structure parameters listed in Table 3 show that the SBET linearly increased as the regeneration cycle increased. The change reveals that the regeneration of K10 acts as a further activation, which improve the pore structure of catalyst effectively. The Vmicro changed irregularly after seven regeneration cycles, because the excessive activation could cause the collapse of the adjacent wall structures between the micropores. Similar observations have also been reported by Yang et al[15, 21]. The desulfurization perfor-mance of the K10-600-n gradually decreased after the forth regeneration cycle. It means that the structure parameters are not the key factor for the desulfuriza-tion of K10. In Table 4, the mass loss rate linearly decreases as the regeneration cycle increases, showing that the carbon has been partially consumed during the regeneration process.
下载:
导出CSV
| Sample | SBET / (m2·g-1) | Vmicro / (cm3·g-1) |
| ASC | 70 | 0.028 |
| K10 | 167 | 0.062 |
| K10-600-1 | 173 | 0.066 |
| K10-600-2 | 178 | 0.069 |
| K10-600-3 | 182 | 0.073 |
| K10-600-4 | 190 | 0.075 |
| K10-600-5 | 207 | 0.083 |
| K10-600-6 | 213 | 0.087 |
| K10-600-7 | 218 | 0.091 |
| K10-600-8 | 221 | 0.086 |
| K10-600-9 | 229 | 0.083 |
| K10-600-10 | 237 | 0.084 |
| K10-600-11 | 241 | 0.078 |
下载:
导出CSV
| Sample | K10-600-4 | K10-600-6 | K10-600-8 | K10-600-10 |
| Mass loss rate / % | 2.74 | 4.94 | 7.32 | 9.58 |
| SBET / (m2·g-1) | 190 | 213 | 221 | 237 |
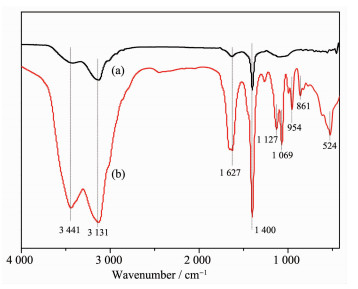
As shown in Fig. 6 (IR spectra), the bands at 3 441 and 3 131 cm-1 correspond to the -OH stretching vibration. The bands at 1 627 and 1 400 cm-1 can be identified as the anti-symmetrical and symmetrical vibrations of carbonyl groups. After desulfurization, for K10-S, some new bands were detected at 1 127 and 524 cm-1 (Fig. 6b), which are assigned to the S-O or S=O stretching mode adsorbed sulfate ions and sulfate, showing the formation of H2SO4 and K2SO4. The C-O stretching at 1 069 cm-1 of carbonyl groups in alcohols, ethers, or phenols and the out-of-plane bending vibration of C-H groups in aromatic at 861 cm-1 and in olefin at 954 cm-1 were observed. These results indicate that the surface functional groups are constantly updated in desulfurization process[12, 22].
SEM images of the samples and element mapping image of K are shown in Fig. 7. A large number of pores, cracks and few impurities were presented on the surface of K10 (Fig. 7a). The spheroidal particles were also presented on the surface of K10 after desulfurization (Fig. 7b) and a few of them would remain on the surface of K10 after regeneration (Fig. 7c). It can be better illustrated that the sulfate is deposited in pore or on the surface of the samples before and after regeneration. The mapping result shows potassium is evenly distributed on the semi-coke surface (Fig. 7d).
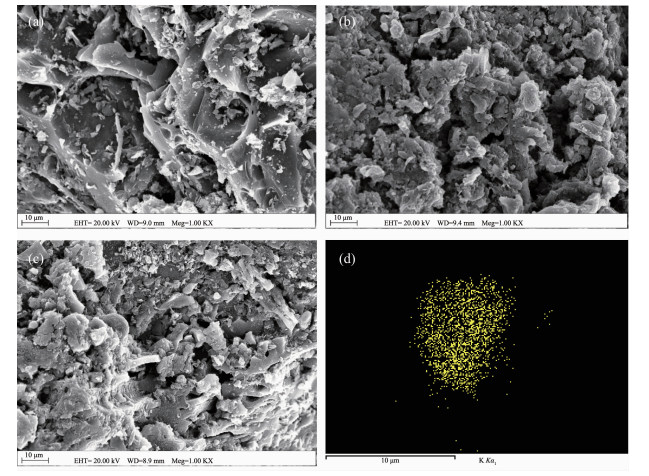
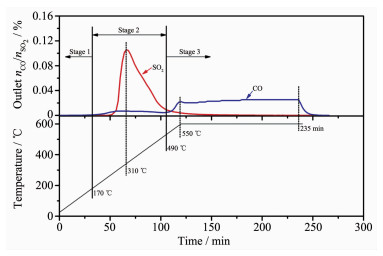
Fig. 8 shows the outlet gas components of K10-S during the regeneration process. The regeneration process of K10-S could be divided into three stages: at the first stage, the temperature was lower than 170 ℃; the second stage was in the temperature range of 170~490 ℃; the temperature from 490 ℃ to the isothermal stage was the last stage. For the metal-modified AC, there are three kinds of sulfur species (i.e., adsorbed SO2, sulfur acid, and metal sulfate) coexisting in the pore structure after desulfurization[3, 23-24]. During the regeneration process, the adsorbed SO2 could be desorbed easily when the temperature reached 150 ℃, and this stage is called desorption. When the temperature was increased to 200 ℃, the sulfur acid could react with the carbon to release SO2, which is called reaction[25]. With the temperature was further increased, the sulfur acid was completely removed and the metal sulfate began to decompose when the temperature was high enough, which is called decomposition.
At the first stage, there was no CO, or SO2 detected even though the temperature was increased to 170 ℃. This result indicates the amount of adsorbed SO2 is very low on the surface of K10. In the second stage, the outlet concentration of SO2 began to increase profoundly then gradually decreased. The outlet concentration of SO2 reached the maximum value at 310 ℃. However, the concentration of CO increased gradually at first and then remained basically unchanged. In the third stage, the concentration of SO2 was very low and gradually reduced with the increasing of temperature. It could be due to the residuals of SO2 in the previous stage. It worth noting that the CO showed the second increase and reached the new vertex at 550 ℃, then remained basically stable and decreased rapidly before cooling. A slight increase of the CO in the third stage may be contributed to the pyrolysis and gasification of oxygen-containing functional groups in the presence of metals on the carbon matrix, which serve as further surface modification[15].
On the basis of the experimental results above, all of the potential reactions are as follows:
|
${\rm{S}}{{\rm{O}}_{\rm{2}}}\left( {{\rm{ads}}} \right) \to {\rm{S}}{{\rm{O}}_{\rm{2}}}\left( {\rm{g}} \right)$ |
(1) |
|
${\rm{C + }}{{\rm{H}}_2}{\rm{S}}{{\rm{O}}_4} \to {\rm{CO}}\left( {\rm{g}} \right){\rm{ + S}}{{\rm{O}}_{\rm{2}}}\left( {\rm{g}} \right){\rm{ + }}{{\rm{H}}_{\rm{2}}}{\rm{O}}\left( {\rm{g}} \right)$ |
(2) |
|
$\begin{array}{l} {\rm{C + }}{{\rm{K}}_2}{\rm{S}}{{\rm{O}}_4} \to {\rm{K - X + S + CO}}\left( {\rm{g}} \right)\\ \;\;\;\;\;\;\;\;\;\;\;\;\;\;\;\;\;\;\;\;\;\;\;\;\;\;\;\;\left( {{\rm{K - X:active}}\;{\rm{K}}\;{\rm{species}}} \right) \end{array}$ |
(3) |
|
${\rm{C - }}\left( {{\rm{CO}}} \right) \to {\rm{CO}}\left( {\rm{g}} \right)$ |
(4) |
|
${\rm{C + S}}{{\rm{O}}_{\rm{2}}} \to {\rm{S + CO}}\left( {\rm{g}} \right)$ |
(5) |
The results show that activated semi-coke (ASC) modified by K2CO3 have higher desulfurization activity than ASC at 120 ℃ for SO2 removal. ASC modified by different ratios of K2CO3 exhibits different SO2 removal ability. SO2 removal ability of the catalysts ranks as follows: K2.5 < K5 < K7.5 < K15≈K10. The used K10 can be fully regenerated in N2 at 600 ℃. Cyclic regeneration of K10 shows that the K10 is a good desulfurizer, since its regeneration efficiency begins to increase and then decrease. After four regeneration cycles, the sample(K10-R-600-4) has the highest sulfur capacity (68.9 mg·g-1), which is 24.37% higher than that of K10 (55.4 mg·g-1). The desulfurization products are divided into physisorbed SO2, H2SO4 and sulfate. Some sulfate could not be decomposed, which deposited in a pore or on the surface of the samples after regeneration. The outlet gas analysis of K10-S during the regeneration process shows that there is a reaction between carbon and H2SO4 or sulfate as the regeneration temperature increases. The deposition of sulfate leads to the decrease in the sulfur capacity of catalyst after five regeneration cycles. However, the desulfurization activity of catalyst remains relatively stable upon further reuse. Based on the high efficient of regeneration cycles, the catalyst can be used to absorb SO2 from flue gas. The work opens up possibilities for using K/ASC as a promising agent for flue-gas desulfurization catalysis.
Cui X X, Yi H H, Tang X L, et al. J. Chem. Technol. Biotechnol., 2018, 93(3):720-729 doi: 10.1002/jctb.5421
Mathieu, Y, Tzanis, L, Soulard, M, et al. Fuel Process. Technol., 2013, 114(3):81-100 https://www.sciencedirect.com/science/article/pii/S0378382013001239
Ma J, Liu Z, Liu S, et al. Appl. Catal. B, 2003, 45(4):301-309 doi: 10.1016/S0926-3373(03)00176-0
Jastrzb K. Fuel Process. Technol., 2012, 104:371-377 doi: 10.1016/j.fuproc.2012.06.011
Liu Q Y, Li C H, Li Y X. Carbon, 2003, 41(12):2217-2223 doi: 10.1016/S0008-6223(03)00205-7
Liu X L, Guo J X, Chu Y H, et al. Fuel, 2014, 123(1):93100 http://www.sciencedirect.com/science/article/pii/S0016236114000787
Gao X, Liu S, Zhang Y, et al. J. Hazard. Mater., 2011, 188(1/2/3):58-66 http://www.sciencedirect.com/science/article/pii/S0304389411000872
Davini P. Carbon, 2001, 39(3):419-424 doi: 10.1016/S0008-6223(00)00134-2
Guo Y, Liu Z, Liu Q, et al. Catal. Today, 2008, 131(1/2/3/4):322-329 https://www.sciencedirect.com/science/article/abs/pii/S0920586107006384
Zhang C, Yang D, Jiang X, et al. Environ. Technol., 2016, 37(15):1895-1905 doi: 10.1080/09593330.2015.1135991
Yang L, Jiang X, Yang Z S, et al. Ind. Eng. Chem. Res., 2015, 54(5):1689-1696 doi: 10.1021/ie503729a
Guo J X, Luo H D, Shu S, et al. Energy Fuels, 2018, 32(1):765-776
Guo J X, Liang J, Chu Y H, et al. Chin. J. Catal., 2010, 31(3):278-282 doi: 10.1016/S1872-2067(09)60049-8
窦冠雄, 龙跃, 张良进, 等.钢铁, 2018, 853(6):26-30 http://www.cnki.com.cn/Article/CJFDTotal-GANT201806006.htmDOU Guang-Xiong, LONG Yue, ZHANG Liang-Jin, et al. Iron Steel, 2018, 853(6):26-30 http://www.cnki.com.cn/Article/CJFDTotal-GANT201806006.htm
Yang L, Jiang X, Jiang W J. Energy Fuels, 2017, 31(4):4556-4564 doi: 10.1021/acs.energyfuels.7b00125
Rodriguez-Reinoso F. Carbon, 1998, 36(3):159-175 doi: 10.1016/S0008-6223(97)00173-5
Qu Y, Guo J, Chu Y, et al. Appl. Surf. Sci., 2013, 282(5):425-431 http://www.sciencedirect.com/science/article/pii/S0169433213010866
Smirnov M Y, Kalinkin A V, Pashis A V, et al. Kinet. Catal., 2003, 44(4):575582
Liu F D, Asakur K, He H, et al. Appl. Catal. B, 2011, 103(3/4):369-377
Liu L, Liao L H, Meng Q H, et al. Carbon, 2015, 90:75-84 doi: 10.1016/j.carbon.2015.04.009
Jung S, Oh S, Choi G, et al. J. Anal. Appl. Pyrolysis, 2014, 109:123-131 doi: 10.1016/j.jaap.2014.07.003
Zhao L, Li X Y, Hao C, et al. Appl. Catal. B, 2012, 117-118:339-345 doi: 10.1016/j.apcatb.2012.01.034
Collins J, Zheng D, Ngo T, et al. Carbon, 2014, 79:500-517 doi: 10.1016/j.carbon.2014.08.009
Gao X, Liu S, Zhang Y, et al. J. Hazard. Mater., 2011, 188(1/2/3):58-66
Yan Z, Liu L L, Zhang Y L, et al. Energy Fuels, 2013, 27(6):3080-3089 doi: 10.1021/ef400351a

Figure 7 SEM images of the samples: K10 (a), K10-S (b), K10-R-600-1 (c), and element mapping image of K (d)
Table 1. Breakthrough sulfur capacity and breakthrough time of the catalysts at 120 ℃
| Sample | Sulfur capacity / (mg·g-1) | Breakthrough time / min |
| SC | 1.5 | 5 |
| ASC | 23.8 | 102 |
| K2.5 | 28.5 | 124 |
| K5 | 35.3 | 136 |
| K7.5 | 40.9 | 162 |
| K10 | 55.4 | 188 |
| K15 | 56.2 | 190 |
 下载: 导出CSV
Table 2. Sulfur capacity and breakthrough time of the regenerated K10
| Sample | Sulfur capacity / (mg·g-1) | Breakthrough time / min |
| K10 | 55.4 | 188 |
| K10-600-1 | 56.0 | 190 |
| K10-600-2 | 62.5 | 212 |
| K10-600-3 | 66.6 | 226 |
| K10-600-4 | 68.9 | 242 |
| K10-600-5 | 61.3 | 208 |
| K10-600-6 | 52.5 | 178 |
| K10-600-7 | 51.9 | 176 |
| K10-600-8 | 48.3 | 164 |
| K10-600-9 | 47.2 | 160 |
| K10-600-10 | 38.9 | 132 |
| K10-600-11 | 36.6 | 124 |
下载: 导出CSV
Table 3. Structure parameters calculated from nitrogen adsorption isotherms
| Sample | SBET / (m2·g-1) | Vmicro / (cm3·g-1) |
| ASC | 70 | 0.028 |
| K10 | 167 | 0.062 |
| K10-600-1 | 173 | 0.066 |
| K10-600-2 | 178 | 0.069 |
| K10-600-3 | 182 | 0.073 |
| K10-600-4 | 190 | 0.075 |
| K10-600-5 | 207 | 0.083 |
| K10-600-6 | 213 | 0.087 |
| K10-600-7 | 218 | 0.091 |
| K10-600-8 | 221 | 0.086 |
| K10-600-9 | 229 | 0.083 |
| K10-600-10 | 237 | 0.084 |
| K10-600-11 | 241 | 0.078 |
下载: 导出CSV
Table 4. Mass loss rate of the sample after regeneration
| Sample | K10-600-4 | K10-600-6 | K10-600-8 | K10-600-10 |
| Mass loss rate / % | 2.74 | 4.94 | 7.32 | 9.58 |
| SBET / (m2·g-1) | 190 | 213 | 221 | 237 |
下载: 导出CSV

 扫一扫看文章

扫一扫关注我们