Table 1.
Crystallographic data for compounds 1 and 2
Citation:
Qi QI, LI Xing. Highly Selective Recognition to Cu2+ Based on Fluorinated Calix[4]arene Derivatives in Cone Conformation[J]. Chinese Journal of Inorganic Chemistry,
2019, 35(7): 1301-1311.
doi:
10.11862/CJIC.2019.160

锥形构象含氟杯芳烃衍生物对铜离子的高选择性识别
English
Highly Selective Recognition to Cu2+ Based on Fluorinated Calix[4]arene Derivatives in Cone Conformation
Abstract:
The fluorine derivatives of calix[4]arene, C64H52F12O4 (1), C60H52F4O4 (2), C68H48F24O4 (3), were synthesized, and their cone conformations were proved by single crystal X-ray diffraction and 1H NMR spectroscopy. Their recognition behaviors were evaluated towards a variety of metal ions in mixed solvent. The UV-Vis absorption and fluorescence spectroscopy were measured and confirmed that copper ions resulted in fluorescence quenching of compounds 1~3, while other ions such as Na+, K+, Cs+, Mg2+, Ca2+, Ba2+, Fe3+, Cd2+, Mn2+, Co2+, Ni2+, Zn2+ exerted hardly significant impact on the UV-Vis absorption and fluorescence intensity of 1~3, exhibiting high selectivity of compounds 1~3 to copper ions.
-
Key words:
- calix[4]arene
- / recognition
- / selectivity
- / fluorinated derivatives
-
0. Introduction
During the past few years, the development of efficient sensors detecting metal ions has attracted wide attention. Some metal ions are strong toxic to the human body at very low concentration, such as mercury ions and palladium ions. Although some metal ions play a central part in our daily life and are widely used in industry, excessive uptake can also have harmful effects. Therefore, it is meaningful to selectively identify related ions for human health. At present, many ion detection sensor materials have been developed, such as ion recognition responsive materials based crown ether[1], ion recognition materials based coordination compounds[2-3], ion recognition materials based calix[4]arene[4].
Calix[4]arenes are highly applied into many fields, such as recognition, sensors, biomedicine[5-9], because of their adjustable conformation and easy derivatization. Calix[4]arenes are especially prominent in sensors and selective receptors due to their func-tionalized structures and complexation possibilities[10-12]. In the field of reco-gnition of ions, the design of highly selective and multifunctional calix[4]arene derivatives has become an important branch and is also an interesting aspect of supramolecular chemistry[13-18]. Chemical modification of calix[4]arenes is one of the methods to prepare derivatives[19-20]. Calix[4]arene derivatives modified by different functional moieties are obtained by introd-ucing characteristic groups, such as optical active groups and electrical active groups. Wong et al.[21] investigated the property dependence of phenyl-calix[4]crown-4 on the upper rim substituent of methyl, fluorine or trimethylsilyl. Chawla et al.[22] synthesized a series of para-substituted receptors which show selectivity to Cs+ and Rb+ ions by introducing arylazo, thiazolylazo, pyridylazo and β-naphthylazo groups into tetrathiacalix[4]arene. However, it was rarely reported that fluorine groups were introduced on the upper rim of calix[4]arene. It is due to the special properties of fluorine groups[23-24] that few researchers synthesize fluorinated calix[4]arene derivatives. Herein, we synthesized fluorinated calix[4]arene derivatives by using Suzuki coupling reaction to modify the up-rim of calix[4]arenes and introduce fluorine and trifluoro-methyl groups into calix[4]arenes, and we studied their recognition properties.
1. Experimental
1.1 General
1H NMR spectra in CDCl3 were detected on a Bruker 400 MHz spectrometer. FT-IR spectra were obtained by a Nicollet 6700 FT-IR spectrometer. UV-Vis spectral studies were carried out by using a TU-1901 spectrophotometer (Beijing Purkinje General Instrument). Fluorescence spectra were recorded on a Hitachi F-4600 fluorescence spectrometer. All the reagents and chemicals were commercially available and analytical pure.
1.2 Synthesis of compound 1
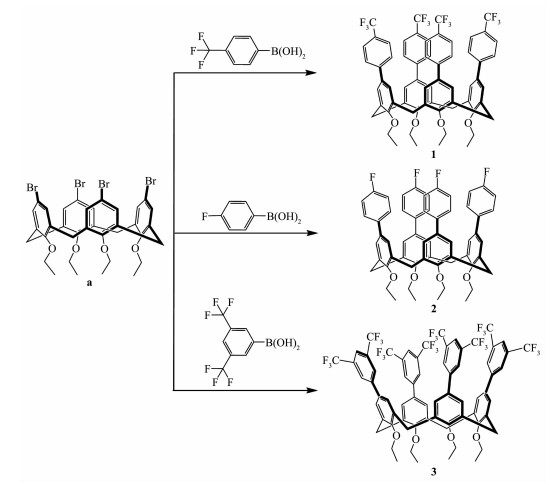
5, 11, 17, 23-Tetrabromo-25, 26, 27, 28-tetraethoxycalix[4]arene (a, 0.425 7 g, 0.5 mmol), 4-(trifluoromethyl)phenylboronic acid (0.372 5 g, 2.0 mmol) and sodium carbonate (0.424 0 g, 4 mmol) were mixed in the mixed solvent of toluene/ethanol/water (20 mL/10 mL/2 mL). The mixture was added tetrakis(triphenylphosphine)palladium((β-4)-platinum) after pumping vacuum and purging with nitrogen gas for three times. Subsequently, the mixture was heated at 80 ℃ to reflux under nitrogen protection and stirred for 24 h. The solution was stratified statically after the reaction completed. The inorganic layer was extracted with dichloromethane (6 mL×3), and the organic layer was washed with saturated salt water (6 mL×3). Successively, organic phases merged into one phase, which was dried with anhydrous sodium sulfate and concentrated by rotary evaporator. The raw solid was obtained. After the purification process by a silica gel column, the white solids of 5, 11, 17, 23-tetra(4-trifluoromethylphenyl)-25, 26, 27, 28-tetraethoxycalix[4]arene were obtained (0.110 g, Yield: 19.8%). Elemental Anal. Calcd. C64H52F12O4(%): C, 69.06; H, 4.70. Found(%): C, 70.20; H, 4.94. IR (KBr, cm-1): νmax 1 328(CF3). 1H NMR (400 MHz, CDCl3): δ 7.39 (d, J=7.9 Hz, 4H, ArH), 7.27~7.18 (m, 5H, ArH), 6.95 (s, 4H, ArH), 4.59 (d, J=13.1 Hz, 2H, ArCH2Ar), 4.12 (q, J=6.8 Hz, 4H, CH2), 3.31 (d, J=13.2 Hz, 2H, ArCH2Ar), 1.55 (t, J=6.7 Hz, 7H, CH3).
1.3 Synthesis of compound 2
Compound a (0.426 7 g, 0.5 mmol) and 4-fluorophenylboronic acid (0.826 9 g, 2 mmol) were stirred in 32 mL of mixed solvents (Vtoluene:Vethanol:Vwater=10:5:1) at ambient temperature. The sodium carbonate solution (2 mL, 2 mol·L-1) was added to the mixture. Then the mixture was added (β-4)-platinum after vacuuming and sparging nitrogen gas several times and heated at 80 ℃ to reflux for 24 h. Finally, the reaction mixture was extracted with CH2Cl2 and washed with saturated salt water. The product was purified by a silica gel column to give compound 2 as a white solid (0.100 g, yield 21.92%). Elemental Anal. Calcd. for C60H52F4O4(%): C, 78.93; H, 5.74. Found(%): C, 79.95; H, 6.56. IR (KBr, cm-1): νmax 1 227 (Ar-F). 1H NMR (400 MHz, CDCl3): δ 7.04 (dd, J=8.5, 5.4 Hz, 2H, ArH), 6.86 (s, 2H, ArH), 6.80 (t, J=8.7 Hz, 2H, ArH), 4.55 (d, J=13.1 Hz, 1H, ArCH2Ar), 4.08 (q, J=7.0 Hz, 2H, CH2), 3.26 (d, J=13.2 Hz, 1H, ArCH2Ar), 1.53 (dd, J=13.5, 6.4 Hz, 6H, CH3).
1.4 Synthesis of compound 3
A mixture of a (0.851 2 g, 1.0 mmol) and 3, 5-bis(trifluoromethyl)benzeneboronic acid (1.038 8 g, 4 mmol) in the presence of Na2CO3 (2.218 9 g) as the templating base under nitrogen in mixed solvent was stirred. (β-4)-Platinum was added in the solution after vacuuming three times. After all reagents were added, the resulting mixture was refluxed at 90 ℃ under the protection of nitrogen for 24 h. The solution was extracted with CH2Cl2 and washed with saturated salt water three times after reaction. The solution was dried with anhydrous sodium sulfate. Then, the crude product was obtained by concentrating with rotary evaporator. Compound 3 was obtained by the purifica-tion process (0.130 g, Yield: 9.40%). Elemental Anal. Calcd. for C68H48F24O4(%): C, 58.97; H, 3.49. Found(%): C, 59.03; H, 3.51. IR (KBr, cm-1): νmax 1 272 (CF3). 1H NMR (400 MHz, CDCl3): δ 7.58 (s, 1H, ArH), 7.43 (s, 2H, ArH), 6.94 (s, 2H, ArH), 4.60 (d, J=13.2 Hz, 1H, ArCH2Ar), 4.12 (q, J=7.0 Hz, 2H, CH2), 3.35 (d, J=13.3 Hz, 1H, ArCH2Ar), 1.63~1.50 (m, 8H, CH3).
1.5 General procedure for UV-Vis study and fluorescence study
Standard stock solutions (0.01 mol·L-1) of metal acetate salts and chloride salts (NaCl, KCl, CsCl, Cu(Ac)2·H2O, BaCl2·2H2O, Zn(Ac)2, Mg(Ac)2·4H2O, Cd(Ac)2·2H2O, Mn(Ac)2·4H2O, Co(Ac)2·4H2O, Ni(Ac)2 ·4H2O, FeCl3, CaCl2) were prepared in CH3OH. The stock solutions (0.1 mmol·L-1) of compounds 1~3 were prepared with CH2Cl2. The solution concentration of compounds 1~3 is 5 μmol·L-1 with different concen-trations of metal ions in the mixed solvent (VCH2Cl2: VCH3OH=1:1) in the titration experiments for UV-Vis and fluorescent studies.
1.6 X-ray diffraction data collection and refinement
Crystallographic data for 1 and 2 were collected at room temperature on a Bruker Smart CCD area detector diffractometer equipped with a graphite monochromated Mo Kα radiation (λ=0.071 073 nm) by ω-2θ scan mode. All absorption corrections were applied using the SADABS program[25]. The Lp factor and empirical absorption were performed to correct the data, and to restore the data and correct the unit cell parameters by using SANIT and SMART software. The structures were solved by direct method and refined on F2 by full-matrix least-squares using the SHELXTL-97 program package[26]. All non-hydrogen atoms were refined with anisotropic displacement parameters. All hydrogen atoms were placed geometrically and were refined in a riding-model approximation. The crystallographic data of compound 1 and 2 are summarized in Table 1.
Table 1

 下载:
导出CSV
下载:
导出CSV
Compound 1 2 Empirical formula C64H52F12O4 C60H52F4O4 Formula weight 1 113.06 913.02 Temperature / K 293(2) 293(2) Crystal system Triclinic Monoclinic Space group P1 C2/c a / nm 1.293 25(L) 1.371 7(3) b / nm 1.534 64(9) 1.835 8(4) c / nm 1.859 67(11) 1.899 4(4) α /(°) 83.141(2) β /(°) 86.122(2) 95.660(7) γ /(°) 71.506(2) Volume / nm3 3.473 4(4) 4.759 8(17) Z 2 4 Dc / (g·cm-3) 1.064 1.274 F(000) 1 152 1 920 Absorption coefficient / mm-1 0.087 0.089 θ range for data collection / (°) 1.10~27.56 2.07~27.89 Reflection collected 54 847 24 449 Unique reflection 15 893 5 497 Rint 0.044 4 0.049 3 Data, restraint, parameter 15 893, 2, 726 5 497, 0, 300 Goodness-of-fit on F2 1.346 1.047 R1 indices [I>2σ(I)] 0.128 5 0.066 3 wR2 indices (all data) 0.4142 0.210 2 Largest diff. peak and hole / (e·nm-3) 949 and -527 544 and -355 2. Results and discussion
2.1 Synthesis of compounds 1~3
Modifying up-rim of calix[4]arene was imple-mented according to the Scheme 1. Compound a as raw materials can be prepared by published procedure[27]. Thus, the Suzuki coupling reaction of tetrabromocalix[4]arene with fluorine-containing phenylboronic acid produced fluorine-containing calix[4]arene derivatives. The structures of compounds 1~3 were proved by respective IR, X-ray diffraction and 1HNMR spectra.
Scheme 1
1H NMR spectroscopy can be used as a marker to identify the conformation of calix[4]arene deriva-tives because there are different characteristics with different conformations in 1H NMR spectra[28-30]. The conical conformation of the compound 1 can be confirmed by the presence of doublets at δ of 3.31 and 4.59 as an AB type proton signal of ArCH2Ar in the 1H NMR spectra. In the 1H NMR spectra of compound 2, there were two doublets at δ of 3.26 and 4.45 for ArCH2Ar, which confirmed the compound 2 is in the cone conformation. Compound 3 adopts the cone conformation due to the proton signal of methylene bridges at δ of 3.35 and 4.60 in 1H NMR spectra. The IR spectra of compounds 1~3 show characteristic bands at 1 328 cm-1(CF3), 1 227 cm-1 (Ar-F) and 1 272 cm-1 (CF3), respectively.
2.2 Single crystal structure
We successfully obtained colorless single crystals of compounds 1 and 2 from the mixed solvent (ethyl acetate/petroleum ether) and collected their structure data by single crystal X-ray diffractometer. As shown in Fig. 1 and 2, X-ray diffraction analysis revealed that compound 1 and 2 adopts conical conformations. Single crystals suitable for X-ray diffraction analysis of 3 were not obtained presently.
Figure 1
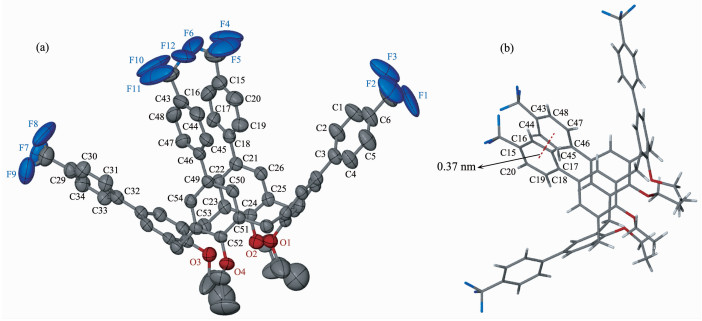
 Figure 1. Crystal structure (a) and π-π stacking interaction (b) of compound 1
50% thermal ellipsoids
Figure 2
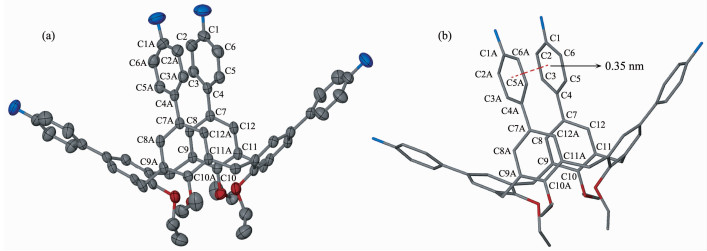
 Figure 2. Crystal structure (a) and π-π stacking interaction (b) of compound 2
All hydrogen atoms are omitted for clarity; 50% thermal ellipsoids; Symmetry codes: A: 2-x, y, 1/2-z
Compound 1 shows an asymmetric distorted cone conformation, in which the relatively long distance between the aromatic ring C1…C6 and C29…C34 is about 1.44 nm, and the short distance between the aromatic ring C15…C20 and C43…C48 is about 0.37 nm (Fig. 1). The nearest distance (0.37 nm) is attributed to the strong π-π stacking interactions in 1. The distance about 0.49 nm between the aromatic ring C21…C26 and C49…C54 displays hardly the π-π stacking interactions. The aromatic ring C21…C26 are rotated relative to the aromatic ring C15…C20, and torsion angle of C19-C18-C21-C26 is 37.2°. Similarly, torsion angle of C45-C46-C49-C50 is 40.5°.
Compound 2 with a cone conformation was obtained through substituents of 4-fluorophenyl groups on upper rim, similar to compound 1. The distance between the aromatic rings C1…C6 and C1A…C6A is about 0.35 nm, which results from strong π-π interactions in 2 (Fig. 2). Torsion occurs between fluorophenyl-substituted aromatic rings C1…C6 and C7…C12, and torsion angle of C3-C4-C7-C8 is about 45.3°.
2.3 UV-Vis spectroscopic studies
Calix[4]arenes are considered to be perfect compounds for forming stable complexation with metal ions, such as Fe3+, Ni2+, Cu2+. Therefore, we studied and explored the fluorinated calix[4]arene for binding ability. The titration experiments were implemented to explore the interplay of compounds 1~3 with various metal ions and investigate its selectivity.
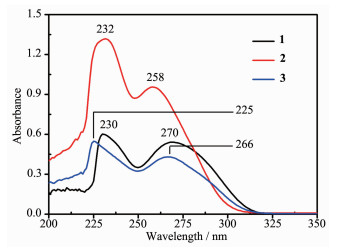
As shown in Fig. 3, it can be found that the maximum ultraviolet absorption wavelength of comp-ounds 1~3 are in a range of 220~270 nm in the mixed solvent (VCH2Cl2: VCH3OH=1:1). The ultraviolet spectrum of compound 1 displayed strong peaks at 230 and 270 nm owing to π→π* and n→π* transitions. There were two peaks at 232 and 2 nm in the ultraviolet spectrum of compound 2, and the UV-Vis spectrum of 3 exhibited strong peaks at 225 and 266 nm.
Figure 3
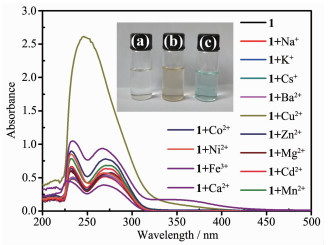
The selectivity of 1~3 in mixed solvent (5 μmol·L-1) to different metal ions (0.5 mmol·L-1, excepted Fe3+) was preliminarily measured by UV-Vis spectros-copy. The wavelength with maximum absorbance upon the metal ion addition was listed in Table 2. On the basis of titration experiments, compound 1 exhibited a new band at 361 nm after adding Fe3+ (10 equiv.) (Fig. 4). After adding copper ions (100 equiv.), the new band appeared at 246 nm while the original peaks disappeared as shown in Fig. 4. Compared with the compound 1 in the absence of metal ions, the absorbance of the band enhanced greatly. Other metal ions, unlike iron or copper ions, only caused slight changes in absorption bands. Moreover, the color of compound 1 changed to yellow green after adding Cu2+ for 24 h (Fig. 4). The result reflects that 1 is more selective for Cu2+ ions.
Table 2
Table 2. Maximum absorbance wavelength of compounds 1~3 after titration with metals ions下载:
导出CSV
Compound λmax / nm Blank Na+ K+ Cs+ Ba2+ Cu2+ Zn2+ Mg2++ Cd2+ Mn2+ Co2+ Ni+ Fe3+ Ca2+ 1 230 234 234 234 234 246 232 232 232 232 232 232 234 229 270 270 270 270 270 277 276 271 271 274 270 267 268 361 2 232 228 230 227 229 237 230 230 230 229 228 228 229 229 258 258 258 258 258 240 258 258 258 258 258 258 257 258 3 225 227 227 227 229 246 230 230 230 230 226 226 226 230 266 267 267 267 267 268 267 267 266 266 266 262 267 362 *c1~c3=5 μmol·L-1, cFe3+=50 μmol·L-1, concentration of other metal ions: 0.5 mmol·L-1 Figure 4
 Figure 4. UV-Vis spectra of 1 with different metal ions (100 equiv. excepted Fe3+) in the mixed solvent CH2Cl2/CH3OH
VCH2Cl2: VCH3OH; Inset: color changes: (a) 1, (b) 1 with Cu2+, (c) Cu2+ (0.5 mmol·L-1)
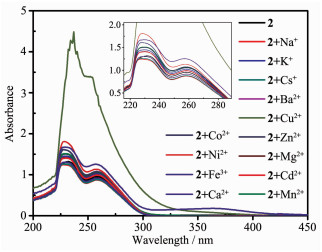
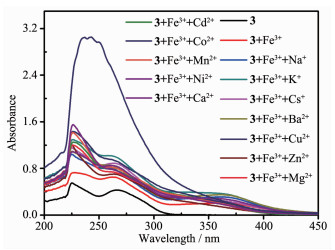
The UV-Vis spectrum of compound 2 exhibited a significant increase of absorbance with the addition of Cu2+ (Fig. 5), and the bands shifted to 237 nm. The change of bands indicates that compound 2 has the ability to interact with copper ions. With the addition of nickel ions, the absorbance of compound 3 enhanced remarkably at 226 nm and decreased at 266 nm, although the absorption bands did not shift significantly (Fig. 6). In the presence of iron ions, the spectra showed gentle absorption peaks. In addition, it was visible that the new absorption band appeared at 246 and 362 nm, respectively, after copper and iron ions were added in the solution of compound 3 as shown in Fig. 6. The results show that copper ions, iron ions and nickel ions can interact with compound 3, especially copper ions have the most pronounced response.
Figure 5
 Figure 5. UV-Vis spectra of compound 2 with different metal ions (100 equiv., excepted Fe3+) in the mixed solvent CH2Cl2/CH3OH
VCH2Cl2: VCH3OH=1:1; Inset: enlarged drawing of wavelength range of 200~350 nm
Figure 6
 Figure 6. UV-Vis spectra of compound 3 with different metal ions (100 equiv., excepted Fe3+) in the mixed solvent CH2Cl2/CH3OH
VCH2Cl2: VCH3OH=1:1; Inset: UV-Vis spectra of 3 alone, 3 with Cu2+, 3 with Ni2+, 3 with Fe3+
Compounds 1~3 show different binding abilities to metal ions, which possibly result from the following two factors: different substituents and substitution sites on the upper edge of calix[4]arenes. It can be seen that the factors affecting the selectivity of ligands to metal ions are not only the hard or soft properties of metal ions, but also the radius of ions, the size of holes and even the conformation of compounds. Many factors lead to the selectivity of different compounds to specific ions[31-35].
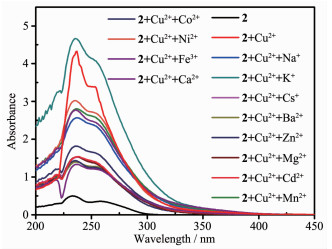
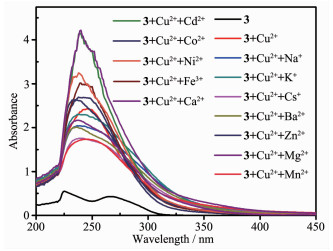
The selectivity of compounds 1~3 to copper ions was tested in existence of interfering ions by experi-ments adding Cu2+ ions and the other ions (1:1) (Fig. 7~9). It was found that other ions did not obviously interfere absorption spectra of the compounds with Cu2+. In addition, the interference of other ions on the binding of compound 3 to iron ions was also examined (Fig. 10). Other ions except Cu2+ did not affect the absorption spectra of compound 3 with iron ions. Adding copper ions broke down the binding of compound 3 to iron ions, which may be due to the higher binding efficiency of compound 3 to copper ions.
Figure 7
 Figure 7. Interference test of other ions on compound 1 with Cu2+ in the mixed solvent CH2Cl2/CH3OH
VCH2Cl2: VCH3OH=1:1
Figure 8
 Figure 8. Interference test of other ions on compound 2 with Cu2+ in the mixed solvent CH2Cl2/CH3OH
VCH2Cl2: VCH3OH=1:1
Figure 9
 Figure 9. Interference test of other ions on compound 3 with Cu2+ in the mixed solvent CH2Cl2/CH3OH
VCH2Cl2: VCH3OH=1:1
Figure 10
 Figure 10. Interference test of other ions on compound 3 with Fe3+ in the mixed solvent CH2Cl2/CH3OH
VCH2Cl2: VCH3OH=1:1
2.4 Fluorescence studies
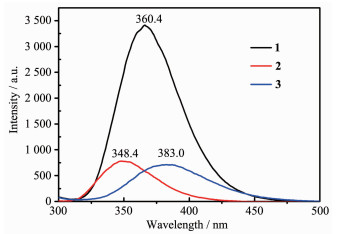
The fluorescence spectra of compounds 1~3 (5 μmol·L-1) were measured as shown in Fig. 11. The emission peak of 1 was 360.4 nm under the excitation of 294 nm, and there was a fluorescence peak of 2 at 348.4 nm when the exciting wavelength is 289 nm, while that of 3 was at 383.0 nm with excitation at 292 nm. The results from the fluorescence spectroscopy show that there is similarity in the optimum excitation wavelengths of the compounds.
Figure 11
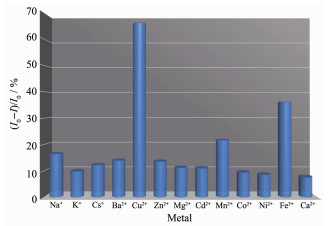
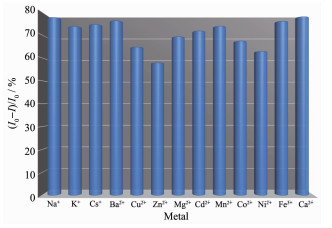
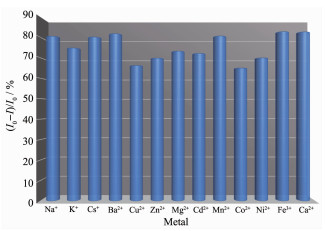
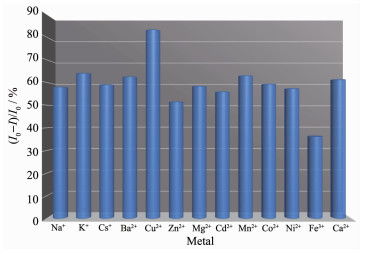
The binding of compounds 1~3 (5 μmol·L-1) towards various ions (100 equiv., excepted Fe3+) was tested by fluorescence spectroscopy as showed in Fig. 12~14. The results of tests are consistent with those of ultraviolet spectra. The fluorescence intensity of compound 1 decreased sharply after adding copper ions, and there was obvious quenching in emission. The intensity of compound 2 decreased obviously in the existence of Cu2+ ions, while the other ions did not lead to remarkable changes. In the existence of copper and iron ions, the fluorescence intensity of compound 3 decreased. The intensity of compound 3 towards Cu2+ showed stronger quenching than that of compound 3 to Fe3+. Compound 3 is more compatible to Cu2+ than Fe3+. Upon addition of metal ions (100 equiv., except Fe3+), all metal ions more or less affect the emission intensity of compounds 1~3 despite no changing in the band of compound 1~3. In particular, the addition of copper and iron ions causes remarkable quenching in emission intensity. These results indicate that 1 and 2 only show high selectivity to Cu2+, and 3 is highly selective to iron and copper ions due to their different groups.
Figure 12
Figure 13
Figure 14
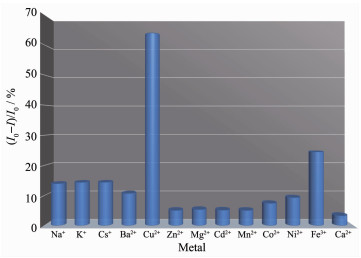
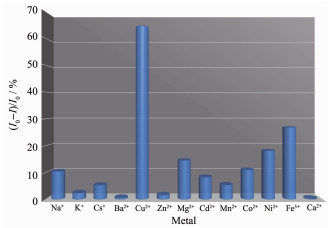
 Figure 14. Selectivity of compound 3 towards Cu2+ and Fe3+ upon addition of various metal ions
The selectivity of compounds 1~3 towards Cu2+ is further studied. The fluorescence quenching of compound 2 is more prominent, i.e. "Off state" (Fig. 13), compared to "On state" (Fig. 11), which has the highest selectivity to copper ions among compounds 1~3. Quenching of fluorescence in emission caused by Cu2+ is owing to reverse photo-induced electron transfer (reverse PET)[36-37].
In order to further observe the practical applicability of compounds 1~3 as fluorescent sensors for Cu2+ or Fe3+, we explored the interference of other ions. The competitive experiments were carried out on compounds 1~3 in the presence of copper ions (100 equiv.) or iron ions (10 equiv.) with an equal proportion of co-existing ions (Fig. 15~18). The results show that the fluorescence responses of compounds 1~3 to copper ions do not change significantly in the existence of other ions, and the fluorescence response of compound 3 to iron ions except copper ions shows small changes.
Figure 15
 Figure 15. Competitive selectivity of compound 1 towards Cu2+ in the presence of different cations in the mixed solvent CH2Cl2/CH3OH
c1=5 μmol·L-1, VCH2Cl2: VCH3OH=1:1
Figure 16
 Figure 16. Competitive selectivity of compound 2 towards Cu2+ in the presence of different cations in the mixed solvent CH2Cl2/CH3OH
c2=5 μmol·L-1, VCH2Cl2: VCH3OH=1:1
Figure 17
 Figure 17. Competitive selectivity of compound 3 towards Cu2+ in the presence of different cations in the mixed solvent CH2Cl2/CH3OH
c3=5 μmol·L-1, VCH2Cl2: VCH3OH=1:1
Figure 18
 Figure 18. Competitive selectivity of compound 3 towards Fe3+ in the presence of different cations in the mixed solvent CH2Cl2/CH3OH
c3=5 μmol·L-1, VCH2Cl2: VCH3OH=1:1
3. Conclusions
In conclusion, we synthesized fluorinated calix[4]arene derivatives 1~3 in the cone conformation. The calix[4]arene derivatives were characterized by 1H NMR, FT-IR, UV-Vis, fluorescence spectra analysis and so on. Compounds 1~3 show high significant selective nature to copper ions, which is indicated by UV-Vis and fluorescence techniques. The ultraviolet intensity of compounds 1~3 increased, new bands appeared and fluorescence quenching occurred in the presence of copper ions. At the same time, compound 3 exhibits higher selectivity to copper ions than iron ions. This kind of molecular switch may be utilized as a Cu2+ selective sensor.
-
-
[1]
Schmittel M, Lin H. Inorg. Chem., 2007, 46:9139-9145 doi: 10.1021/ic700413v
-
[2]
Lv R, Chen Z, Fu X, et al. J. Solid State Chem., 2018, 259:67-72 doi: 10.1016/j.jssc.2017.12.033
-
[3]
Li Y, Chang Z, Huang F, et al. Dalton Trans., 2018, 47:9267-9273 doi: 10.1039/C8DT01145A
-
[4]
Li G K, Xu Z X, Chen C F, et al. Chem. Commun., 2008, 15:1774-1776 https://www.ncbi.nlm.nih.gov/pubmed/18379689
-
[5]
Park S Y, Yoon J H, Hong C S, et al. J. Org. Chem., 2008, 73:8212-8218 doi: 10.1021/jo8012918
-
[6]
Othman A B, Lee J W, Kim J S, et al. J. Org. Chem., 2007, 72:7634-7640 doi: 10.1021/jo071226o
-
[7]
Lee J Y, Kim S K, Jung J H, et al. J. Org. Chem., 2005, 70:1463-1466 doi: 10.1021/jo048228i
-
[8]
Angela F D D N, Al N M, Villanueva Salas J A, et al. Eur. J. Pharm. Sci., 2017, 100:1-8 doi: 10.1016/j.ejps.2016.12.027
-
[9]
Panchal M, Athar M, Jha P C, et al. RSC Adv., 2016, 6:53573-53577 doi: 10.1039/C6RA05707A
-
[10]
Joseph R, Rao C P. Chem. Rev., 2011, 42:4658-4702 https://www.ncbi.nlm.nih.gov/pubmed/21513269
-
[11]
Métivier R, Leray I, Valeur B. Chem. Commun., 2003, 9:996-997 https://www.ncbi.nlm.nih.gov/pubmed/12744337
-
[12]
Lo P K, Wong M S. Sensors-Basel, 2008, 8:5313-5335 doi: 10.3390/s8095313
-
[13]
Arora V, Chawla H M, Singh S P. Arkivoc, 2007, 2:172-200
-
[14]
Chawla H M, Shukla R, Pandey S. Tetrahedron Lett., 2013, 54:2063-2066 doi: 10.1016/j.tetlet.2013.02.017
-
[15]
Pathak R K, Dessingou J, Rao C P. Anal. Chem., 2012, 84:8294-8300 doi: 10.1021/ac301821c
-
[16]
李佳佳, 汪茂灿, 张晓梅, 等.安徽化工, 2017, 43(2):37-40 doi: 10.3969/j.issn.1008-553X.2017.02.012LI Jia-Jia, WANG Mao-Can, ZHANG Xiao -Mei, et al. Anhui Chemical Industry, 2017, 43(2):37-40 doi: 10.3969/j.issn.1008-553X.2017.02.012
-
[17]
张玲菲, 郑相勇, 曾晞, 等.无机化学学报, 2010, 26(7):1183-1188 http://www.wjhxxb.cn/wjhxxbcn/ch/reader/view_abstract.aspx?flag=1&file_no=20100709&journal_id=wjhxxbcnZHANG Ling-Fei, ZHENG Xiang-Yong, ZENG Xi, et al. Chinese J. Inorg. Chem., 2010, 26(7):1183-1188 http://www.wjhxxb.cn/wjhxxbcn/ch/reader/view_abstract.aspx?flag=1&file_no=20100709&journal_id=wjhxxbcn
-
[18]
张玲菲, 赵江林, 曾晞, 等.无机化学学报, 2010, 26(10):1796-1803 http://www.wjhxxb.cn/wjhxxbcn/ch/reader/view_abstract.aspx?flag=1&file_no=20101012&journal_id=wjhxxbcnZHANG Ling-Fei, ZHAO Jiang-Lin, ZENG Xi, et al. Chinese J. Inorg. Chem., 2010, 26(10):1796-1803 http://www.wjhxxb.cn/wjhxxbcn/ch/reader/view_abstract.aspx?flag=1&file_no=20101012&journal_id=wjhxxbcn
-
[19]
Chen Y J, Chung W S. Eur. J. Org. Chem., 2009, 28:4770-4776
-
[20]
Joseph R, Chinta J P, Rao C P. J. Org. Chem., 2010, 75:3387-3395 doi: 10.1021/jo1004247
-
[21]
Wong M S, Xia P F, Lo P K, et al. J. Org. Chem., 2006, 71:940-946 doi: 10.1021/jo051896z
-
[22]
Charkrabarti A, Chawla H M, Francis T, et al. Tetrahedron, 2006, 62:1150-1157 doi: 10.1016/j.tet.2005.10.073
-
[23]
Priimagi A, Cavallo G, Metrangolo P, et al. Acc. Chem. Res., 2013, 46:2686-2695 doi: 10.1021/ar400103r
-
[24]
Pelizzi N, Casnati A, Ungaro R. Chem. Commun., 1998, 23:2607-2608 https://www.researchgate.net/publication/239234119_Calix4arenes_with_perfluorinated_alcoholic_functions_at_the_upper_rim_A_new_class_of_neutral_anion_receptors
-
[25]
Sheldrick G M. SADABS, University of Göttingen, Germany, 1997.
-
[26]
Sheldrick G M. SHELXL 97, Program for the Solution of Crystal Structures, University of Göttingen, Germany, 1997.
-
[27]
Ruban A V, Rozhenko A B, Pirozhenko V V, et al. Tetrahedron Lett., 2013, 54:3496-3499 doi: 10.1016/j.tetlet.2013.04.083
-
[28]
Qazi M A, Qureshi I, Memon S. J. Mol. Struct., 2010, 975:69-77 doi: 10.1016/j.molstruc.2010.03.088
-
[29]
Wang H, Feng Y, Xue J. Lett. Org. Chem., 2009, 6:409-411 doi: 10.2174/157017809788681329
-
[30]
Kim T H, Kim S H, Tan L V, et al. Talanta, 2007, 71:1294-1297 doi: 10.1016/j.talanta.2006.06.035
-
[31]
Qazi M A, Qureshi I, Memon S. J. Fluoresc., 2011, 21:1703-1711 doi: 10.1007/s10895-011-0865-8
-
[32]
Qureshi I, Qazi M A, Memon S. Sens. Actuators B, 2009, 141:45-49 doi: 10.1016/j.snb.2009.06.010
-
[33]
Qazi M A, Qureshi I, Memon S. J. Fluoresc., 2011, 21:1231-1238 doi: 10.1007/s10895-010-0802-2
-
[34]
Lee S H, Kim J Y, Ko J, et al. J. Org. Chem., 2004, 69:2902-2905 doi: 10.1021/jo049954o
-
[35]
Maamar S B, Jadambaa N, Vocanson F, et al. Supramol. Chem., 2009, 21:450-454 doi: 10.1080/10610270802195586
-
[36]
Kumar M, Bhalla V, Dhir A, et al. Dalton Trans., 2010, 39:10116-10121 doi: 10.1039/c0dt00804d
-
[37]
Kumar M, Kumar R, Bhalla V, et al. Dalton Trans., 2011, 41:408-412 http://med.wanfangdata.com.cn/Paper/Detail/PeriodicalPaper_PM22095026
-
[1]
-
Figure 1 Crystal structure (a) and π-π stacking interaction (b) of compound 1
50% thermal ellipsoids
Figure 2 Crystal structure (a) and π-π stacking interaction (b) of compound 2
All hydrogen atoms are omitted for clarity; 50% thermal ellipsoids; Symmetry codes: A: 2-x, y, 1/2-z
Figure 4 UV-Vis spectra of 1 with different metal ions (100 equiv. excepted Fe3+) in the mixed solvent CH2Cl2/CH3OH
VCH2Cl2: VCH3OH; Inset: color changes: (a) 1, (b) 1 with Cu2+, (c) Cu2+ (0.5 mmol·L-1)
Figure 5 UV-Vis spectra of compound 2 with different metal ions (100 equiv., excepted Fe3+) in the mixed solvent CH2Cl2/CH3OH
VCH2Cl2: VCH3OH=1:1; Inset: enlarged drawing of wavelength range of 200~350 nm
Figure 6 UV-Vis spectra of compound 3 with different metal ions (100 equiv., excepted Fe3+) in the mixed solvent CH2Cl2/CH3OH
VCH2Cl2: VCH3OH=1:1; Inset: UV-Vis spectra of 3 alone, 3 with Cu2+, 3 with Ni2+, 3 with Fe3+
Figure 7 Interference test of other ions on compound 1 with Cu2+ in the mixed solvent CH2Cl2/CH3OH
VCH2Cl2: VCH3OH=1:1
Figure 8 Interference test of other ions on compound 2 with Cu2+ in the mixed solvent CH2Cl2/CH3OH
VCH2Cl2: VCH3OH=1:1
Figure 9 Interference test of other ions on compound 3 with Cu2+ in the mixed solvent CH2Cl2/CH3OH
VCH2Cl2: VCH3OH=1:1
Figure 10 Interference test of other ions on compound 3 with Fe3+ in the mixed solvent CH2Cl2/CH3OH
VCH2Cl2: VCH3OH=1:1
Figure 14 Selectivity of compound 3 towards Cu2+ and Fe3+ upon addition of various metal ions
Figure 15 Competitive selectivity of compound 1 towards Cu2+ in the presence of different cations in the mixed solvent CH2Cl2/CH3OH
c1=5 μmol·L-1, VCH2Cl2: VCH3OH=1:1
Figure 16 Competitive selectivity of compound 2 towards Cu2+ in the presence of different cations in the mixed solvent CH2Cl2/CH3OH
c2=5 μmol·L-1, VCH2Cl2: VCH3OH=1:1
Figure 17 Competitive selectivity of compound 3 towards Cu2+ in the presence of different cations in the mixed solvent CH2Cl2/CH3OH
c3=5 μmol·L-1, VCH2Cl2: VCH3OH=1:1
Figure 18 Competitive selectivity of compound 3 towards Fe3+ in the presence of different cations in the mixed solvent CH2Cl2/CH3OH
c3=5 μmol·L-1, VCH2Cl2: VCH3OH=1:1
Table 1. Crystallographic data for compounds 1 and 2
Compound 1 2 Empirical formula C64H52F12O4 C60H52F4O4 Formula weight 1 113.06 913.02 Temperature / K 293(2) 293(2) Crystal system Triclinic Monoclinic Space group P1 C2/c a / nm 1.293 25(L) 1.371 7(3) b / nm 1.534 64(9) 1.835 8(4) c / nm 1.859 67(11) 1.899 4(4) α /(°) 83.141(2) β /(°) 86.122(2) 95.660(7) γ /(°) 71.506(2) Volume / nm3 3.473 4(4) 4.759 8(17) Z 2 4 Dc / (g·cm-3) 1.064 1.274 F(000) 1 152 1 920 Absorption coefficient / mm-1 0.087 0.089 θ range for data collection / (°) 1.10~27.56 2.07~27.89 Reflection collected 54 847 24 449 Unique reflection 15 893 5 497 Rint 0.044 4 0.049 3 Data, restraint, parameter 15 893, 2, 726 5 497, 0, 300 Goodness-of-fit on F2 1.346 1.047 R1 indices [I>2σ(I)] 0.128 5 0.066 3 wR2 indices (all data) 0.4142 0.210 2 Largest diff. peak and hole / (e·nm-3) 949 and -527 544 and -355  下载: 导出CSV
Table 2. Maximum absorbance wavelength of compounds 1~3 after titration with metals ions
Compound λmax / nm Blank Na+ K+ Cs+ Ba2+ Cu2+ Zn2+ Mg2++ Cd2+ Mn2+ Co2+ Ni+ Fe3+ Ca2+ 1 230 234 234 234 234 246 232 232 232 232 232 232 234 229 270 270 270 270 270 277 276 271 271 274 270 267 268 361 2 232 228 230 227 229 237 230 230 230 229 228 228 229 229 258 258 258 258 258 240 258 258 258 258 258 258 257 258 3 225 227 227 227 229 246 230 230 230 230 226 226 226 230 266 267 267 267 267 268 267 267 266 266 266 262 267 362 *c1~c3=5 μmol·L-1, cFe3+=50 μmol·L-1, concentration of other metal ions: 0.5 mmol·L-1
下载: 导出CSV
-


 扫一扫看文章
计量
- PDF下载量: 2
- 文章访问数: 323
- HTML全文浏览量: 57
