Table 1.
Metal loading determined by ICP-AES and physical property of prepared catalysts

Catalytic Oxidation of Toluene with Low Loading Bimetallic Au@Pt Core-Shell Catalyst
Si-Han LI , Xiao-Qing LI , Feng-Teng HU , Chao ZHANG , Xin-Huan YAN


Volatile organic compounds (VOCs) are the major component of environmental pollution from a larger variety of sources, such as transport, industrial process and household products[1-3]. VOCs are also important precursors for the formation of particulate matter (PM), ozone and photochemical smog, which greatly threaten to the environment and human health due to their toxic, mutagenic and teratogenic characteristics[4-6]. The development of efficient and low-energy methods for removing VOCs is one of the important means to ease the world′s energy and environmental problems. Until now, the main approaches[7] for removing VOCs include adsorption, absorption, photocatalysis, biodegradation, pulse corona, catalytic oxidation, etc. Among these methods, catalytic oxidation is considered to be one of the most effective and commonly used methods for eliminating VOCs, which can remove VOCs with low energy consumption, no secondary pollution is found as only CO2 and H2O.
Currently, gold nanoparticles (NPs) have tradi-tionally been utilized as catalytically active centers for noble metal deposition to prepare bimetallic core-shell structures. Among the various noble metals, bimetallic Au@Pt core-shell nanoparticles are considered a typical example and have been extensively studied and used, which can increase the activity, stability and selectivity in specific chemical reactions compared to monometallic Pt or Au. The improvement of perfor-mance is attributed to the synergy of the electronic and geometric effects between the two metals[8]. In addition, the bimetallic Au@Pt core-shell also can reduce the amount of Pt loading and improve the utilization of Pt compared with alloyed structures[9].
Recently, many approaches have been applied to synthesize Au@Pt core-shell nanoparticles including electrodeposition[10-11], chemical reduction[12-13] and galvanic displacement[14-15]. The procedures of electro-deposition and galvanic displacement are complicated and cumbersome. The reaction often occurs under the harsh conditions, such as the use of poisonous and stubborn surfactant agents, high temperature, strong acid and alkali solvents. On the basis of economic and environmental considerations, the preparation of core-shell nanoparticles by a simple method remains still a challenge.
Herein, we developed a new and environmentally friendly method for the preparation of Au@Pt core-shell nanoparticles: the Au nanoparticles were firstly prepared by liquid-phase hydrogen reduction, then small Pt particles were deposited onto the Au nano-particles to obtain Au@Pt core-shell nanostructures. Compared with the conventional method, this method can effectively control the particle size and crystal structure. Moreover, it can regulate the dispersion of the active components on the carrier. The low loading Au@Pt core-shell catalyst showed higher activity for toluene oxidation at low temperature.
HAuCl4·4H2O and H2PtCl6·6H2O (AR) were pur-chased from Shanghai Tuosi Chemical Co., Ltd. Prop-ylene carbonate(AR) was purchased from Dongguan Youte environmental protection materials Co., Ltd. γ-Al2O3 was purchased from Shanghai Lüqiang New Material Co., Ltd. Toluene (AR) was purchased from Aladdin.
Au nanoparticles were synthesized by using HAuCl4·4H2O as a precursor. The measured amount of HAuCl4·4H2O was sufficiently dissolved in 100 mL of propylene carbonate and added to the autoclave. The reaction was carried out at 40 ℃ under hydrogen pressure of 4 MPa for 2 h to obtain Au nanoparticles solution. γ-Al2O3 was added into the above solution, stirred for 24 h and calcined at 400 ℃ for 4 h after filtrating and drying. The combined catalyst with low Au loading 0.04% (mass fraction) was obtained and recorded as Au/γ-Al2O3.
The calculated amount (nAu:nPt=1:0, 3:1, 2:1, 1:1, 1:2, 1:3, 0:1) of H2PtCl6·6H2O was added in the above-prepared Au nanoparticles solution. Then the mixed solution was added to the autoclave with 4 MPa H2. The solution was vigorously stirred for 3 h at 40 ℃ to obtain Au@Pt core-shell nanoparticles. To deposit the sol on the support, a certain amount of the pretreated γ-Al2O3 carrier was added to the above nanoparticle solution. After stirring and impregnating 24 h, the sample was filtered, dried and then calcined in the muffle furnace at 400 ℃ for 4 h to obtain combined core-shell Au@Pt catalysts (the loading amount was shown in Table 1).
 下载:
导出CSV
下载:
导出CSV
| Sample | Theoretical loada of Au/% (w/w) | Theoretical loada of Pt/% (w/w) | Actual loadb of Au / % (w/w) | Actual loadb of Pt / % (w/w) | Actual atomic ratiob | SBETc / (m2·g-1) | DPd / nm | VPe / (cm3·g-1) |
| Al2O3 | — | — | — | — | — | 357 | 15.1 | 1.50 |
| Au/Al2O3 | 0.040 | 0 | 0.035 | 0 | Au | 322 | 11.9 | 1.10 |
| Au3Pt1/Al2O3 | 0.040 | 0.013 | 0.032 | 0.011 | Au2.88Pt1 | 331 | 12.8 | 1.12 |
| Au2Pt1/Al2O3 | 0.040 | 0.020 | 0.036 | 0.017 | Au2.01Pt1 | 333 | 13.0 | 1.20 |
| Au1Pt1/Al2O3 | 0.040 | 0.040 | 0.030 | 0.035 | Au0.84Pt1 | 338 | 13.7 | 1.14 |
| Au1Pt2/Al2O3 | 0.040 | 0.079 | 0.038 | 0.070 | Au1.08Pt2 | 342 | 14.7 | 1.26 |
| Au1Pt3/Al2O3 | 0.040 | 0.118 | 0.037 | 0.109 | Au1.01Pt3 | 341 | 14.5 | 1.24 |
| Pt/Al2O3 | 0 | 0.080 | 0 | 0.074 | Pt | 333 | 13.2 | 1.21 |
| a Loading content of Pt and Au was calculated on the assumption that none loss of catalyst during the preparation process; b Determined by the ICP-AES technique; c specific surface area; d pore diameter; e pore volume. | ||||||||
The XRD patterns of the materials were performed on a Rigaku D/Max-2500 X-ray diffractometer, which used a Cu Kα radiation(λ=0.154 nm) in the 2θ scan range (40 kV and 100 mA) from 10° to 80° with a step of 0.05°. Transmission electron microscopy (TEM) was taken on a JEOL JEM-1200EX with an accelerating voltage of 60 kV equipped with energy dispersive spectroscopy (EDS). The X-ray photoelectron spectro-meter (XPS) was carried on non-monochromatic Al Kα (1 486.6 eV) radiation. The N2 adsorption-desorption experiments were measured at liquid nitrogen temper-ature (77 K). The specific surface area of the material was calculated from the desorption isotherm by Brunauer-Emmett-Teller (BET) theory. The different H2 reduction temperature and hydrogen consumption of different oxidation state substances was measured using H2-TPR (temperature programmed reduction) method with online thermal conductivity detector (TCD) recording the temperature dependence of H2 concentration.
The catalytic activity of the catalyst was evaluated in the self-made atmospheric fixed bed catalytic reaction device. The catalyst (0.5 g) was placed in the middle of the reaction tube. The saturated toluene vapor of 0 ℃ was introduced into the reaction tube by bubbling method. In the feed stream, the concentration (volume fraction) was 1×10⁻³ and gas hourly space velocity (GHSV) of VOCs was 18 000~54 000 mL·g-1·h-1. The toluene and oxide content in the tail gas was monitored online by gas chromatography with a flame ionization detector (FID) and a TCD to determine toluene conversion and CO2 selectivity at different temperatures, and the tempera-ture at which toluene achieved 98% conversion was recorded as T98.
The conversion of toluene and selectivity of CO2 are calculated as follows:
|
$ {{\rm{C}}_7}{{\rm{H}}_8}\;{\rm{conversion}} = \frac{{{\varphi _{{{\rm{C}}_7}{{\rm{H}}_8},{\rm{in}}}} - {\varphi _{{{\rm{C}}_7}{{\rm{H}}_8},{\rm{out}}}}}}{{{\varphi _{{{\rm{C}}_7}{{\rm{H}}_8},{\rm{in}}}}}} \times 100\% $ |
|
$ {\rm{C}}{{\rm{O}}_2}\;{\rm{selectivity}} = \frac{{{\varphi _{{\rm{C}}{{\rm{O}}_2}}}}}{{{\varphi _{{\rm{C}}{{\rm{O}}_2}}} + {\varphi _{{\rm{CO}}}}}} \times 100\% $ |
where φC7H8, in and φC7H8, out represent the volume fraction of toluene before and after reaction, respectively; φCO2 and φCO represent the volume fraction of CO2 and CO.
The metal loading of different Au-Pt molar ratio catalysts were determined by ICP-AES (Table 1). It can be seen that the actual loading is slightly lower than the theoretical calculation, indicating that a loss of some metal might occur during the synthesis or calcination step. However, it has little influence on the catalyst within the margin of error, which can be neglected basically. Therefore, the actual atomic ratio of the catalyst can be replaced by the theoretical value.
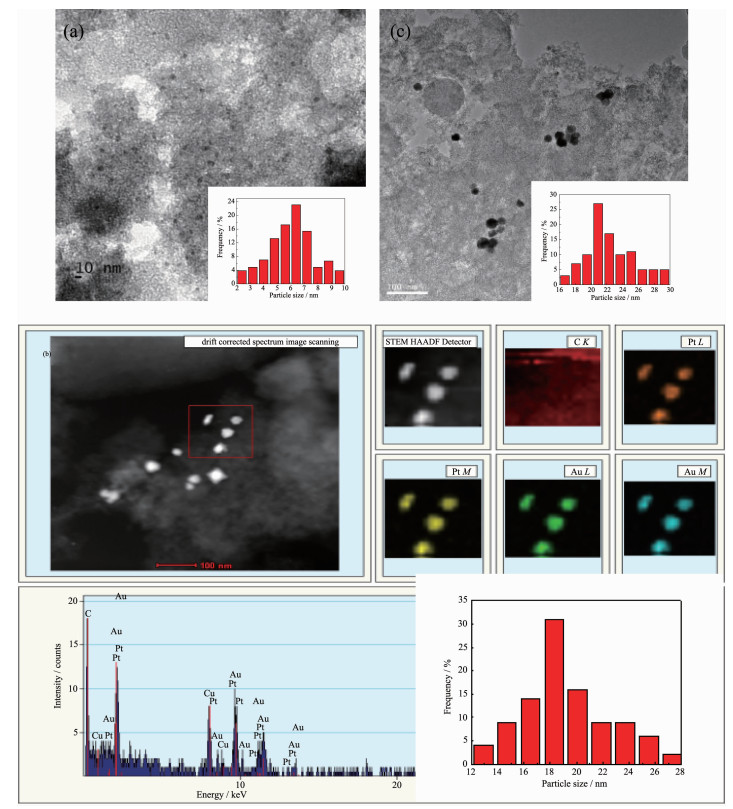
Fig. 1 shows the TEM images and particle size distributions of Au and Au-Pt nanoparticles. The monometallic Au nanoparticles were uniformly dispersed with wide particle size distribution in a range of 3.75~10.61 nm and the average size was 6.57 nm (Fig. 1a). Due to the effect of propylene carbonate as dispersant and stabilizer, nanoparticles are directly adsorbed on the surface of the support, which effectively inhibits the growth of nanoparticles and hinders the penetration of nanoparticles into the pores of the support[16]. Thus Au nanoparticles have smaller size of the active phase and finer dispersion. The bimetallic Au-Pt nanoparticles were significantly larger than the monometallic Au. The sizes (Fig. 1b) were between 12.5 and 29.1 nm, and the average size was 18.3 nm. This indicates that Au nanoparticles gradually grow, which results from the deposition of Pt on the surface of Au or the agglomeration of Au(Pt) nanoparticles. As can be seen from Fig. 1c, the catalyst after reaction showed partial agglomeration and the overall particle size increased, but the amplitude of variation was not significant, demonstrating that the catalyst remain stable and is consistent with XRD characterization. However, the TEM images of bimetallic Au-Pt do not allow us to distinguish between Au and Pt particles because Au and Pt exhibit almost the same imaging contrast and similar crystal structure[17]. From the elemental mapping images of bimetallic Au-Pt NPs (Fig. 1b), Au-L (M) and Pt-L (M) which are represented by different colors corres-ponded to each other, that is, the regions with Au must have the presence of Pt. This indicates that Pt grows on the surface of Au instead of forming its own nucleus or that Au and Pt are physically mixed together, which may form core-shell or alloy structure.
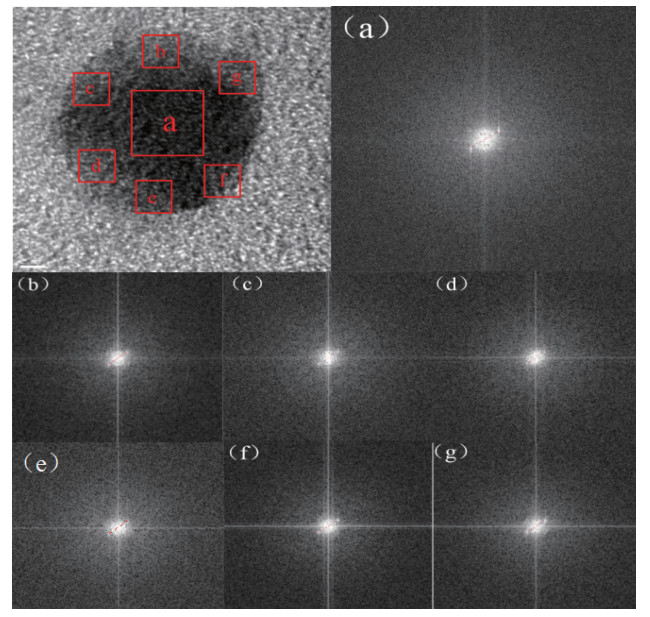
High-resolution TEM (HRTEM) images of Au-Pt nanoparticles are shown in Fig. 2. In order to verify the core-shell structure of nanoparticles, we performed Fourier transform on the high-resolution structures to obtain the corresponding diffraction patterns. The lattice spacing was calculated by using digital photo-micrography software. From the diffraction pattern (Fig. 2), the lattice spacing at the center position of the nanoparticles (1#) was 0.235 nm for the (111) lattice planes of fcc metallic Au[18]. The lattice spacing of the diffraction fringes in the b~g region (Fig. 2) was 0.224, 0.225, 0.226, 0.225, 0.224 and 0.225 nm for the (111) lattice planes of fcc metallic Pt[19]. The HRTEM image of the Au-Pt nanoparticles revealed that the d-spacings of adjacent fringes for metal cores and metal surroun-ding were (0.235±0.002) nm and (0.225±0.002) nm[20], respectively, corresponding to the (111) planes of face-centered cubic Au and Pt, which indicates that bime-tallic Au@Pt NPs are core/shell structures. In order to verify the universality of this conclusion, we selected two more points (Fig.S1 and S2), and the lattice spacings of a~g and b~g regions was shown in Table S1, which matches well with the (111) planes of the Au and Pt, respectively. We can draw the same conclusion that the nanoparticle must be core-shell structure, which accords with elemental mapping of Au@Pt nanoparticles.
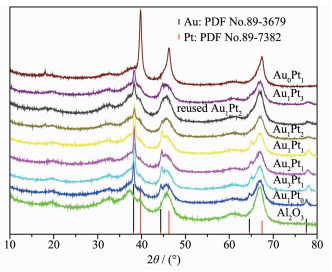
The XRD patterns of γ-Al2O3, supported catalysts and the standard diffraction peaks of Au and Pt are shown in Fig. 3. The diffraction pattern for mono-metallic Pt had several peaks at 39.8°, 46.2° and 67.4°, corresponding to (111), (200) and (220) planes(PDF No.89-7382), respectively. Wide-angle X-ray diffraction showed broad peaks at 38.2°, 44.4°, 64.6°, 77.5°, which are characteristic of (111), (200), (220) and (311) planes of monometallic Au (PDF No.89-3697), respectively. The XRD patterns of the bimetallic Au@Pt core-shell catalysts matched quite well with the (111), (200), (220) and (311) peaks in the Au pattern and no diffraction peaks of Pt can be observed. This indicates that only a monolayer of Pt is deposited on Au without forming individual Pt particles[21] or there exist small size Pt particles (1~2 nm, which can be undetected by XRD technique) or the loading of Pt on the Au surface is very low[22], otherwise the Au and Pt peaks of physical mixture would appear in the XRD pattern. From Fig. 3, it can be seen that the XRD peak of Au (220) and (311) tended to be flat with the increase of Pt content in the bimetallic catalysts. The Au@Pt particle size on the support become smaller with increasing Pt content. Among the prepared Au@Pt/γ-Al2O3 catalyst, the maximum dispersion was obtained by Au1@Pt2 catalyst, which leads to high catalytic activity. As can be seen from the XRD pattern of Au1@Pt2/γ-Al2O3 catalyst after reaction, the number of diffraction peaks did not change and the structure did not change significantly, indicating that the catalyst has good stability.
Table 1 shows the physical structure properties of the supported catalyst and support γ-Al2O3. Compared with support γ-Al2O3, the specific surface area, pore size and pore volume of the supported catalyst were reduced, which may be due to the blockage of γ-Al2O3 pores by some nanoparticles during the preparation process. However, the specific surface area and pore volume of Au1@Pt2/γ-Al2O3 were relatively larger than other catalysts. The Au1@Pt2 nanoparticles are mainly distributed on the surface of the support and have relatively less influence on the support structure. It is well known that the distribu-tion of active components is one of the most important factors to affect the activity of the catalyst, especially for the gas-solid reactions. The more active compon-ents are located on the surface of the support, the more effective active sites are provided for the reaction. What′s more, the time for the reactant to enter the inner pore and the product to diffuse out from the inner pores is shortened, thereby greatly improving the activity of the catalyst[23].
It is known to all that the reducibility of catalysts can play an important role in the redox reactions. For metal oxide catalysts, H2-TPR measurement can reflect the reduction of high-valent metal ions to low-valent metal ions or metal-atom, as well as the potential to remove or absorb oxygen[24]. The H2-TPR profiles of Au@Pt catalysts are shown in Fig. 4. For Au/Al2O3, there were two reduction peaks. The first weak peak around 324 ℃ is attributed to the reduction of AuxOy[25], which coincides with the results of XRD with the presence of oxides. And the second peak obtained at 598 ℃ can correspond to the reduction of gold ions (Au+) in the subsurface of support[26]. For Pt/Al2O3, the first peak at 93 ℃ can be assigned to the reduction of PtOx, which contains the contribution of the surface oxygen adjacent to Pt species due to the spillover effect induced by the metal-support interac-tion. The second peak at 502 ℃ is ascribed to the reduction of the surface oxygen far away from Pt particles and the reduction of subsurface oxygen[27]. The third peak around 680 ℃ observed in all the samples may be ascribed to the reduction of surface A13+ on γ-Al2O3[28].
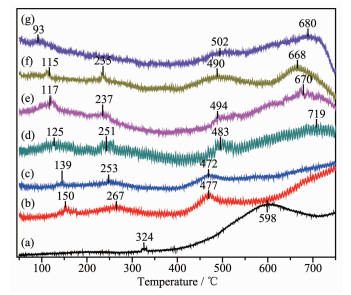
(a) Au/Al2O3, (b) Au3Pt1/Al2O3, (c) Au2Pt1/Al2O3, (d) Au1Pt1/Al2O3, (e) Au1Pt2/Al2O3, (f) Au1Pt3/Al2O3, (g) Pt/Al2O3
For bimetallic Au@Pt catalyst, the reduction peak between 115 and 150 ℃ is attributed to the reduction of PtOx, and the reduction peak between 235 and 275 ℃ belongs to the reduction of AuxOy. In the high temperature (477~490 ℃), the reduction peak was basically similar to metal Pt. Because the amount of metal oxides in the catalyst account for a small part, which is in line with the results of XPS, various reduction peaks were weak. In addition, the reduction peaks in the low-temperature region gradually shifted to lower temperatures as the Pt content increased, showing Au and Pt mutually exerts positive influence on their respective reductions. In particular, both Au1@Pt2 and Au1@Pt3 reduction peaks were slightly lower than other bimetallic catalysts, indicating the surface oxygen species has a faster migration rate and oxygen vacancies are easier to generate. The position of the reduction peak of the bimetallic Au@Pt catalyst depends on the degree of interaction between Au and Pt. These results demon-strate that there is a strong interaction between Au, Pt and support[29], which improves catalytic activity.
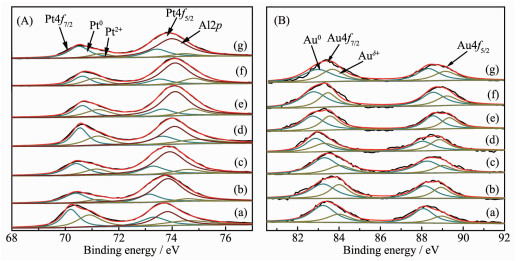
The Pt4f and Au4f orbital XPS spectra of Au@Pt catalysts are shown in Fig. 5. Because the Al2p peak overlapped with the Pt4f peak in a range of 68~80 eV, it is necessary to separate the Al2p peak from the spectra. For Pt/Al2O3, when the Al2p was used at 73.9 eV, the Pt4f7/2 spectra can be deconvoluted into two peaks at 70.1 and 71.0 eV, and the Pt4f5/2 spectra can be also divided into two peaks at 73.4 and 74.3 eV, corresponding to Pt0 and Pt2+ [30], respectively. In bime-tallic system, the Al2p needed to be separated from Pt4f. The Pt4f and Au4f fine spectra of bimetallic Au@Pt can be fitted into two sets of peaks, corres-ponding to the 4f7/2 and 4f5/2 orbitals of Pt0 and Pt2+, Au0 and Auδ+, respectively. The binding energy of Au shifted slightly to lower value (Fig. 5B), and the binding energy of Pt increased (Fig. 5A) compared to pure Au and Pt with the increase of Pt content, which demonstrates that electronic structure has significantly changed in bimetallic Au@Pt catalysts, and the inter- and intra-atomic charges transfers between Au and Pt[31]. In addition, the difference in electronegativity of Au and Pt (2.54 and 2.28) may imply potential electron-withdrawing effect from Au to neighboring Pt[32], which suggests that the oxidation state of Pt shell is affected by the Au core. Table 2 shows the binding energy and relative content of Au4f and Pt4f for bimetallic Au@Pt catalysts, and it can be seen that the Au0 and Pt0 contents occupy the majority of the catalyst, indicating that Au0 and Pt0 are the main active species on the catalyst surface. According to the XPS data of Au1@Pt2 after the reaction, the Au0/Auδ+ and Pt0/Pt2+ proportion were slightly lower than that before the reaction, indicating that the number of main active centers with Au0 and Pt0 decrease as the reaction proceeds. However, the range of variation is small, which indicates that the catalyst has good stability and conforms to the characterization results of XRD and TEM. So the modified electronic structure and active species would improve their catalytic properties.
(A-a) Pt/Al2O3, (B-a) Au/Al2O3, (b) Au3Pt1/Al2O3, (c) Au2Pt1/Al2O3, (d) Au1Pt1/Al2O3, (e) Au1Pt2/Al2O3, (f) reused Au1Pt2/Al2O3, (g) Au1Pt3/Al2O3
下载:
导出CSV
| Catalyst | Binding energy/ eV | Relative proportions/% | ||||||
| Au4f7/2 | Pt4f7/2 | |||||||
| Au0 | Auδ+ | Pt0 | Pt2+ | Au0/Auδ+ | Pt0/Pt2+ | |||
| Au/Al2O3 | 83.38 | 84.20 | — | — | 68/32 | — | ||
| Au3Pt1/Al2O3 | 83.29 | 84.03 | 70.39 | 71.10 | 58/42 | 74/26 | ||
| Au2Pt1/Al2O3 | 83.25 | 83.97 | 70.41 | 71.16 | 69/31 | 64/36 | ||
| Au1Pt1/Al2O3 | 82.85 | 83.56 | 70.55 | 71.23 | 58/42 | 55/45 | ||
| Au1Pt2/Al2O3 | 82.72 | 83.55 | 70.60 | 71.25 | 57/43 | 53/47 | ||
| Au1Pt3/Al2O3 | 82.70 | 83.52 | 70.61 | 71.32 | 57/43 | 74/26 | ||
| Pt/Al2O3 | — | — | 70.20 | 70.90 | — | 59/41 | ||
| Au1Pt2/Al2O3 reused | 82.80 | 83.49 | 70.53 | 71.19 | 53/47 | 51/49 | ||
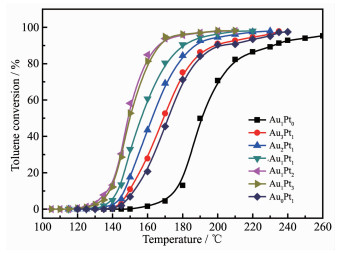
Fig. 6 shows catalytic oxidation of toluene by Au@Pt catalysts prepared with different molar ratios of Au and Pt. In the reaction, the products were only CO2 and water, and CO and other organic small molecules were not detected. The catalytic activity for 98% oxidation of toluene were given in the order of Au1Pt2≥Au1Pt3>Au1Pt1>Au2Pt1>Au3Pt1>Pt>Au. And the T98 corresponding to the above-mentioned sequen-tial catalyst is 195, 195, 210, 215, 230, 230 and 270 ℃, respectively. However, the Au1Pt2 catalyst exhibited excellent catalytic activity, which might be due to that it has smaller particle size and better dispersibility. And it also illustrates that the coexistence of Au and Pt in the bimetallic Au1Pt2 catalyst has higher activity for toluene oxidation compared with monometallic Au or Pt.
VOC concentration: 1×10⁻³ (V/V), GHSV of toluene: 18 L·g-1·h-1
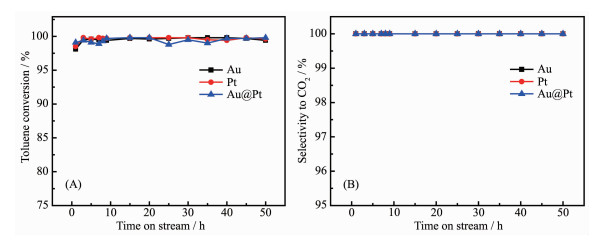
To examine the stability of Au, Pt and Au1@Pt2 catalysts and maintain the reaction temperature at their respective T98 under GHSV at 18 L·g-1·h-1 with 1×10⁻³ (V/V) toluene, the catalysts were taken at regular intervals and analyzed on-line. Fig. 7 shows the relation-ship between toluene conversion, selectivity of carbon dioxide and reaction time. It could be seen that the removal rate of toluene is over 98% and the sele-ctivity of CO2 is 100% within 0~50 h, which indicates the catalysts have high stability and selectivity.
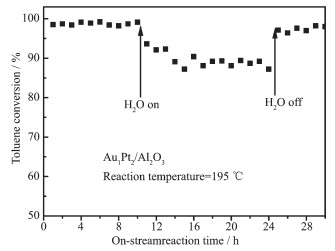
In order to examine the effect of water vapor over the Au1@Pt2/Al2O3 catalytic activity, we performed toluene oxidation in the presence of water vapor (volume fraction: 5.0%) over the Au1@Pt2/Al2O3 and the result is shown in Fig. 8. The results showed that the addition of water vapor decreased the toluene conversion by 9%. When the water vapor was cut off, the toluene conversion rate gradually increased. This phenomenon indicates that there is strong competitive adsorption on the surface of the catalyst in the three components of water vapor, toluene and oxygen[33].
Toluene concentration=1×10⁻³ (V/V), Water vapor concentration=5.0% (V/V), GHSV=18 L·g-1·h-1
In summary, the bimetallic Au@Pt core-shell nanoparticles prepared by two-step reduction method have been loaded on the surface of Al2O3 in a highly dispersed state. The Au@Pt core-shell structure prepared by this method is not only simple but also controllable, which showed higher activity than monometallic Pt or Au catalyst for the oxidation of toluene. The catalytic activity for toluene was given in the order of Au1Pt2≥Au1Pt3>Au1Pt1>Au2Pt1>Au3Pt1>Pt>Au. Among the catalysts, the Au1@Pt2/Al2O3 exhi-bited higher catalytic activity (T98=195 ℃) and better stability. These results suggest that the enhancement effect of Au may arise from the electron transfer from Au to Pt, thereby increasing the reactive oxygen species on the surface of Pt. The core-shell structure may find potential applications in the catalytic combustion of VOCs.
Supporting information is available at http://www.wjhxxb.cn
Salar-García M J, Ortiz-Martínez V M, Hernández-Fernández F J, et al. J. Hazard. Mater., 2017, 321:484-499 doi: 10.1016/j.jhazmat.2016.09.040
Scirè S, Liotta L F. Appl. Catal. B:Environ., 2012, 125:222-246 doi: 10.1016/j.apcatb.2012.05.047
Kamal M S, Razzak S A, Hossain M M. Atmos. Environ., 2016, 140:117-134 doi: 10.1016/j.atmosenv.2016.05.031
Huang H, Xu Y, Feng Q. Catal. Sci. Technol., 2015, 5:2649-2669 doi: 10.1039/C4CY01733A
Zhang Z X, Jiang Z, Weng F S. Catal. Today, 2016, 264:270-278 doi: 10.1016/j.cattod.2015.10.040
Son Y S. Chem. Eng. J., 2017, 316:609-622 doi: 10.1016/j.cej.2017.01.063
Finocchio E, Busca G, Notaro M. Appl. Catal. B:Environ., 2006, 62:12-20 doi: 10.1016/j.apcatb.2005.06.010
Wang A Q, Liu X Y, Mou C Y, et al. J. Catal., 2013, 308:258-271 doi: 10.1016/j.jcat.2013.08.023
Zhang Y L, Li X K, Li K, et al. ACS Appl. Mater. Interfaces, 2017, 38:3268832697
Jeong H, Kim J. Electrochim. Acta, 2018, 283:11-17 doi: 10.1016/j.electacta.2018.06.128
Fedorczyk A, Pomorski R, Chmielewski M, et al. Electrochim. Acta, 2017, 246:1029-1041 doi: 10.1016/j.electacta.2017.06.138
刘晓宇, 张东杰, 张慧娟, 等.无机化学学报, 2018, 34:712-718 http://www.wjhxxb.cn/wjhxxbcn/ch/reader/view_abstract.aspx?flag=1&file_no=20180414&journal_id=wjhxxbcnLIU Xiao-Yu, ZHANG Dong-Jie, ZHANG Hui-Juan, et al. Chinese J. Inorg. Chem., 2018, 34:712-718 http://www.wjhxxb.cn/wjhxxbcn/ch/reader/view_abstract.aspx?flag=1&file_no=20180414&journal_id=wjhxxbcn
Xu H, Yan B, Li S M, et al. Chem. Eng. J., 2018, 334:2638-2646 doi: 10.1016/j.cej.2017.10.175
Guo S J, Fang Y X, Dong S J, et al. J. Phys. Chem. C, 200, 111:17104-17109
Park H Y, Park J H, Kim P, et al. Appl. Catal. B:Environ., 2017, 225:84-90
李加衡, 敖平, 李小青, 等.物理化学学报, 2015, 31:173-180 doi: 10.3866/PKU.WHXB201411131LI Jia-Heng, AO Ping, LI Xiao-Qing, et al. Acta Phys.-Chim. Sin., 2015, 31:173-180 doi: 10.3866/PKU.WHXB201411131
Kristian N, Wang X. Electrochem. Commun., 2008, 10:12-15 doi: 10.1016/j.elecom.2007.10.011
Cao R B, Xia T T, Zhu R Z, et al. Appl. Surf. Sci., 2018, 433:840-846 doi: 10.1016/j.apsusc.2017.10.104
Kang S W, Lee Y W, Park Y S, et al. ACS Nano, 2013, 7:7945-7955 doi: 10.1021/nn403027j
Guo S J, Li J, Dong S J, et al. J. Phys. Chem. C, 2010, 114:15337-15342 doi: 10.1021/jp104942d
Liao M Y, Li W P, Xi X P, et al. J. Electroanal. Chem., 2017, 791:124-130 doi: 10.1016/j.jelechem.2017.03.024
Fedorczyk A, Pomorski R, Chmielewski M, et al. Electrochim. Acta, 2017, 246:1029-1041 doi: 10.1016/j.electacta.2017.06.138
Peng R S, Sun X B, Li S J, et al. Chem. Eng. J., 2016, 306:1234-1246 doi: 10.1016/j.cej.2016.08.056
Jin B F, Wei Y C, Zhao Z, et al. Chin. J. Catal., 2016, 37:923-933 doi: 10.1016/S1872-2067(15)61094-4
Wei Y C, Liu J, Zhao Z, et al. J. Catal., 2012, 287:13-29 doi: 10.1016/j.jcat.2011.11.006
Chang C K, Chen Y J, Yeh C T. Appl. Catal. A:Gen., 1998, 174:13-23 doi: 10.1016/S0926-860X(98)00188-4
Peng R S, Sun X B, Li S J, et al. Chem. Eng. J., 2016, 306:1234-1246 doi: 10.1016/j.cej.2016.08.056
Jia J F, Shen J Y, Lin L W, et al. J. Mol. Catal. A:Chem., 1999, 138:177-184 doi: 10.1016/S1381-1169(98)00147-2
Kim K J, Boo S I, Ahn H G. J. Ind. Eng. Chem., 2009, 15:92-97 doi: 10.1016/j.jiec.2008.09.005
Chen C Y, Zhu J, Chen F, et al. Appl. Catal. B:Environ., 2013, 140:199-205
Wang R, Wang A J, Liu W D, et al. Biosens. Bioelectron., 2017, 102:276-281
Feng R J, Li M, Liu J X. Colloids Surf. A, 2012, 406:6-12 doi: 10.1016/j.colsurfa.2012.04.030
Yang H G, Deng J G, Xie H H. Appl. Catal. A:Gen., 2015, 507:139-148 doi: 10.1016/j.apcata.2015.09.043

Figure 1 TEM image of Au nanoparticles (a), elemental mapping of bimetallic Au1Pt2 nanoparticles (b), TEM image of bimetallic Au1Pt2 nanoparticles after reaction (c) and the corresponding particle size distributions

Figure 2 HRTEM image of Au-Pt nanoparticles corresponding to the first point in Fig. 1b and FFT patterns of each area (a~g)

Figure 4 H2-TPR profiles of Au@Pt catalysts
(a) Au/Al2O3, (b) Au3Pt1/Al2O3, (c) Au2Pt1/Al2O3, (d) Au1Pt1/Al2O3, (e) Au1Pt2/Al2O3, (f) Au1Pt3/Al2O3, (g) Pt/Al2O3

Figure 5 Pt4f (A) and Au4f (B) XPS spectra of prepared catalysts
(A-a) Pt/Al2O3, (B-a) Au/Al2O3, (b) Au3Pt1/Al2O3, (c) Au2Pt1/Al2O3, (d) Au1Pt1/Al2O3, (e) Au1Pt2/Al2O3, (f) reused Au1Pt2/Al2O3, (g) Au1Pt3/Al2O3

Figure 6 Catalytic oxidation of toluene with by Au@Pt catalysts prepared with different molar ratios of Au and Pt
VOC concentration: 1×10⁻³ (V/V), GHSV of toluene: 18 L·g-1·h-1

Figure 7 Stability test of toluene oxidation (A) and selectivity to CO2 (B) with time-on-stream over Au/Al2O3, Pt/Al2O3, Au1@Pt2/Al2O3 catalysts

Figure 8 Effect of water vapor on toluene conversion over Au1Pt2 /Al2O3 catalyst
Toluene concentration=1×10⁻³ (V/V), Water vapor concentration=5.0% (V/V), GHSV=18 L·g-1·h-1
Table 1. Metal loading determined by ICP-AES and physical property of prepared catalysts
| Sample | Theoretical loada of Au/% (w/w) | Theoretical loada of Pt/% (w/w) | Actual loadb of Au / % (w/w) | Actual loadb of Pt / % (w/w) | Actual atomic ratiob | SBETc / (m2·g-1) | DPd / nm | VPe / (cm3·g-1) |
| Al2O3 | — | — | — | — | — | 357 | 15.1 | 1.50 |
| Au/Al2O3 | 0.040 | 0 | 0.035 | 0 | Au | 322 | 11.9 | 1.10 |
| Au3Pt1/Al2O3 | 0.040 | 0.013 | 0.032 | 0.011 | Au2.88Pt1 | 331 | 12.8 | 1.12 |
| Au2Pt1/Al2O3 | 0.040 | 0.020 | 0.036 | 0.017 | Au2.01Pt1 | 333 | 13.0 | 1.20 |
| Au1Pt1/Al2O3 | 0.040 | 0.040 | 0.030 | 0.035 | Au0.84Pt1 | 338 | 13.7 | 1.14 |
| Au1Pt2/Al2O3 | 0.040 | 0.079 | 0.038 | 0.070 | Au1.08Pt2 | 342 | 14.7 | 1.26 |
| Au1Pt3/Al2O3 | 0.040 | 0.118 | 0.037 | 0.109 | Au1.01Pt3 | 341 | 14.5 | 1.24 |
| Pt/Al2O3 | 0 | 0.080 | 0 | 0.074 | Pt | 333 | 13.2 | 1.21 |
| a Loading content of Pt and Au was calculated on the assumption that none loss of catalyst during the preparation process; b Determined by the ICP-AES technique; c specific surface area; d pore diameter; e pore volume. | ||||||||
 下载: 导出CSV
Table 2. Binding energies and proportion of Au4f and Pt4f of prepared catalyst
| Catalyst | Binding energy/ eV | Relative proportions/% | ||||||
| Au4f7/2 | Pt4f7/2 | |||||||
| Au0 | Auδ+ | Pt0 | Pt2+ | Au0/Auδ+ | Pt0/Pt2+ | |||
| Au/Al2O3 | 83.38 | 84.20 | — | — | 68/32 | — | ||
| Au3Pt1/Al2O3 | 83.29 | 84.03 | 70.39 | 71.10 | 58/42 | 74/26 | ||
| Au2Pt1/Al2O3 | 83.25 | 83.97 | 70.41 | 71.16 | 69/31 | 64/36 | ||
| Au1Pt1/Al2O3 | 82.85 | 83.56 | 70.55 | 71.23 | 58/42 | 55/45 | ||
| Au1Pt2/Al2O3 | 82.72 | 83.55 | 70.60 | 71.25 | 57/43 | 53/47 | ||
| Au1Pt3/Al2O3 | 82.70 | 83.52 | 70.61 | 71.32 | 57/43 | 74/26 | ||
| Pt/Al2O3 | — | — | 70.20 | 70.90 | — | 59/41 | ||
| Au1Pt2/Al2O3 reused | 82.80 | 83.49 | 70.53 | 71.19 | 53/47 | 51/49 | ||
下载: 导出CSV

 扫一扫看文章


扫一扫关注我们