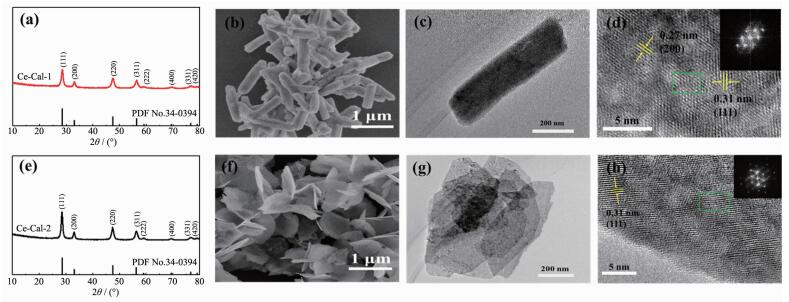
Figure 1.
XRD patterns (a, e), SEM images (b, f), TEM images (c, g), HRTEM images (d, h) with the corresponding SAED (inset) of Ce-Cal-1 and Ce-Cal-2, respectively

CeO2 in Different Morphologies with 2, 4-Dihydroxybenzonic Acid as Auxiliary: Synthesis and Application in NH3-SCR
Hang SU , Man XU , Shi-Jian ZHOU , Fu YANG , Yan KONG


In recent decades, metal oxides have been intensely applied in the fields of catalysis[1-2], sensor[3-4], lithium-ion battery[5-6], etc. Particularly, metal oxides with controlled shapes have positive effect in hetero-geneous catalysis system. Some related properties, such as the specific architecture and high surface area have important influence on the anchoring of the active sites and controlling the diffusion of reactants. With the well-defined morphologies, the researchers can not only adjust the required physicochemical properties but also improve the catalytic performance[7]. Therefore, it is of great significance to explore facile and controllable routes for designing the desired structures.
As well known, nitrogen oxides remain the major pollution source in the air, which could result in the formation of photochemical smog, ozone depletion and acid rain[8]. These situations are directly harmful to ecological environment and human health. In order to address this dilemma, some effective approaches are expected. Fortunately, selective catalytic reduction of NO with NH3 has been regarded as one of the considerable technologies for the abatement of NO (NH3-SCR), and the process can be described by the following equation:
4NO+4NH3+O2 → 4N2+6H2O
Besides, as one of the metal oxides, ceria (CeO2) has been continually focused owing to the highly oxygen storage capacity, enhanced metal dispersion and facile stabilization of the support[9-10]. Meantime, CeO2 can also serve as an outstanding component in the field of selective catalytic reduction of NO with NH3[11]. However, the CeO2-based materials have been significantly demonstrated that the morphologies are closely associated with the physicochemical properties. Typically, for the pure CeO2, hollow ceria nanosphere with multiple shells exhibited distinguishable photo-catalytic activity in water oxidation[12]. With regard to the hybrid CeO2-based materials, core-shell Pd@CeO2 nanostructures were found to exhibit excellent catalytic activity in NO reduction[13]. Recently, in the system of NH3-SCR, Li et al. reported that the novel MnOx-CeO2 nanosphere showed superior activity than the non-structured MnOx-CeO2 catalyst[14]. Hybrid multi -shell hollow structured CeO2-MnOx was designed and found that this material displayed excellent catalytic activity compared to the traditional CeO2-MnOx nano-particles or single-shell hollow spheres[15]. Although great efforts have been achieved, there is still room for controllable synthesis of CeO2 with specific morpholo-gies and apply to NH3-SCR.
To control the morphology of CeO2, some efficient methods, such as hydrothermal[16], polyol method[17], template method[18] and colloidal solution combustion[19] have been adopted. While, in consideration of the tunable reaction parameters, such as different temp-eratures and additives, the hydrothermal method could be considered as a promising route. Notably, benzoic acid compounds have been achieved to prepare various polymers, pharmaceuticals and metal-organic framework particles (MOFs). Especially, Fan et al.[20] reported CuFe2O4@HKUST-1 heterostructures with MOFs shell were constructed by 1, 3, 5-benzenetri-carboxylic acid. Korpany et al.[21] explored a series of benzoic acid derivatives to fabricate surface func-tionalized iron oxide nanoparticles. Plentiful functional materials have opened a door to discover the relationship between benzoic acid derivatives and nanomaterials. Therefore, choosing the appropriate method as well as the suitable benzoic acid compounds play an important role in the synthesis of desirable nanoparticles. Whereas, to the best of our knowledge, it is still lack the research in controlling synthesis of nanocrystallines including CeO2 by using benzoic acid derivatives.
Herein, the rod-like and sheet-like CeO2 were successfully synthesized with the assistant of 2, 4-dihydroxybenzonic acid. The selected 2, 4-dihydroxy-benzonic acid could be completely dissolved in the reaction system to form a homogeneous solution. Time-dependent and temperature-dependent experiments were carried out to study the growth mechanism of the CeO2. Besides, the physicochemical properties of the CeO2 were investigated. In addition, the catalytic activity of the as-prepared CeO2 was evaluated in the system of NH3-SCR.
The rod-like CeO2 was synthesized via the hydro-thermal method and the calcination procedure. Typically, 2 mmol of Ce(NO3)3·6H2O and 3.5 mmol of 2, 4-dihydroxybenzoic acid (DHBA) were dissolved in the mixed solution of 15.0 mL ethanol and 30.0 mL deionized water. Then 5.0 mL of sodium acetate solution (0.5 mol·L-1) was added dropwise into the mixed solution with stirring. The obtained homo-geneous solution was transferred into a Teflon-lined autoclave and heated at 180 ℃ for 24 h in an electric oven. Moreover, the autoclave was cooled to room temperature, the precipitate was centrifuged and washed with deionized water for four times and dried at 60 ℃ for 6 h. Then the precursor (Ce-Pre-1) was calcined in air atmosphere at 500 ℃ with a heat ramp rate of 2 ℃·min-1 for 4 h, and the calcined products were named as Ce-Cal-1.
Instead, the sheet-like CeO2 was obtained accor-ding to the similar process of rod-like CeO2 by increasing the amount of DHBA to 5 mmol, and the hydrothermal products and the calcined products were labeled as Ce-Pre-2 and Ce-Cal-2, respectively.
Time-dependent experiments for the precursors of Ce-Cal-1 and Ce-Cal-2 were carried out at different hydrothermal intervals of 3, 6, 10 and 21 h without changing other reaction parameters. The temperature-dependent experiments of Ce-Cal-2 were performed at 120, 140 and 160 ℃, respectively.
X-ray diffraction patterns (XRD) was used for characterizing the phase purity with a monochromatic Cu Kα radiation source (λ=0.154 178 nm) and operated at 40 kV and 100 mA in the range of 10°~80°. Field-emission scanning electron microscopy (FE-SEM) was performed on a Hitachi S4800 Field-Emission Scanning Electron Microscope and operated at 5 kV. High-resolution transmission electron micros-copy (HRTEM) images were recorded on an EM-2010 EX microscope with the accelerating voltage at 200 kV. The N2 adsorption-desorption isotherms were carried out in the relative pressure (P/P0) range from 0.01 to 0.99, and the surface area of samples were calculated by Brunauer-Emmet-Teller equation (BET). Temperature-programmed reduction under H2 environ-ment (H2-TPR) was carried out on a TP-5000 instru-ment. 50 mg CeO2 was pretreated under He-O2 stream at 500 ℃ for 1 h. After cooling down to room temp-erature, the catalyst was purged with 30 mL·min-1 of He for 30 min to remove the excess O2. Then the flow of 5% H2-He was introduced into the sample with a flow rate of 30 mL·min-1 and the temperature was raised to 950 ℃ at a rate of 10 ℃·min-1. The acidity of the CeO2 was measured by NH3 temperature progra-mmed desorption (NH3-TPD) in the same instrument as the H2-TPR. Prior to TPD experiment, 100 mg CeO2 was pretreated at 300 ℃ for 30 min and cooling to 50 ℃ under argon flow. The sample was exposed to a flow of 2.500 g·L-1 NH3/Ar (50 mL·min-1) at 100 ℃ for 1 h, followed by argon purging for another 1 h. Then, the temperature was raised to 950 ℃ in argon flow at the rate of 10 ℃·min-1. Thermogravimetry and differential scanning calorimetry (TG-DSC) was measured by a NETZSCH STA 409 instrument with a heating rate of 10 ℃·min-1 under nitrogen atmos-phere. Fourier transform infrared (FT-IR) spectra of the samples were obtained in the range of 4 000~500 cm-1 with powders dispersed in KBr on Bruker VECTOR22 resolution.
The catalytic conversion of NO was measured via a fixed-bed reactor with 0.2 g pure CeO2 (40~60 mesh) as catalyst. The feed gas contained 500 mg·L-1 NH3, 500 mg·L-1 NO, 5%(V/V) O2, 5%(V/V) H2O, with N2 as the balance gas. The total flow rate of the feed gas was 200 mL·min-1, corresponding to a space velocity of 60 L·g-1·h-1. The concentration of NO was detected by an online Thermo fisher IS10 FTIR spectrometer equipped with a 2 m path-length gas cell (250 mL). The NO conversion can be calculated by NO conversion=(cNO, in-cNO, out)/cNO, in×100%.
Fig. 1(a) and Fig. 1(e) show the X-ray diffraction patterns (XRD) of Ce-Cal-1 and Ce-Cal-2. The diffrac-tion peaks at ca. 28.5°, 32.9°, 47.3°, 56.2°, 59.1°, 69.4°, 76.5°, 78.7° are well indexed to the face-centered cubic CeO2 (fcc-CeO2, PDF No.34-0394), implying the samples are not amorphous. Fig. 1(b) depicts the typical rod-morphology of Ce-Cal-1 with the average width of 100~300 nm and the average length of 500 nm~1.5 μm. The TEM image in Fig. 1(c) also reveals the rod-like profile of CeO2. Fig. 1(d) presents the corresponding HRTEM image of Ce-Cal-1. As shown in Fig. 1(d), the lattice fringe spacing of 0.27 and 0.31 nm correspond to (200) and (111) diffraction planes of CeO2, respectively. On the other hand, Ce-Cal-2 displays the sheet morphology with the thickness below 80 nm and the length can reach to 700 nm (Fig. 1(f) and Fig. 1(g)). The obvious lattice fringe spacing of 0.31 nm in Fig. 1(h) matches well with (111) diffraction plane of CeO2. In addition, the SAED profiles manifest the typical single crystal, and some defects of the resulted CeO2 could be discovered (marked as green rectangles). Therefore, the rod-like and sheet-like CeO2 are successfully synthesized in this case.
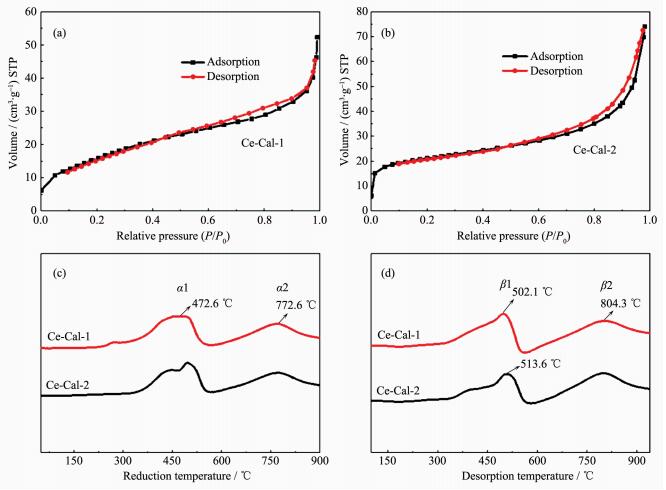
The N2 adsorption-desorption isotherms of CeO2 were measured and shown in Fig. 2(a) and Fig. 2(b). The BET surface areas of the Ce-Cal-1 and Ce-Cal-2 are calculated as about 61 m2·g-1 and 68 m2·g-1, respectively. Temperature-programmed reduction under H2 environment (H2-TPR) was tested to detect the redox property of the resulted CeO2 (Fig. 2(c)). Both the samples manifest the similar reduction peak positions, which are in good agreement with the pure ceria in other reports[22-23]. To be specific, the α1 peak at the lower temperature between 250~600 ℃ could be attributed to the reduction of the absorbed surface oxygen species and the surface oxygen species of CeO2. The α2 peak in the range of 750~800 ℃ could be ascribed to the reduction of bulk oxygen. The H2 consumption amount of Ce-Cal-1 at α1 is higher than that of Ce-Cal-2, which could be attributable to the abundant surface oxygen species in Ce-Cal-1 (Table 1). Meantime, some differences of the bulk oxygen are also presented (α2), which may be connected with the different structures. Temperature-programmed desorp-tion experiments of NH3 (NH3-TPD) were examined to understand the acidity strength, and the results are presented in Fig. 2(d). The desorbed β1 peak presents at the lower temperature of 300~570 ℃, correspon-ding to the desorption of physisorbed NH3 and NH3 at the weak acid sites[24]. While the desorbed β2 peak ranging between 570 and 940 ℃ is assigned to NH3 absorbed at the strong acid sites[25]. The desorbed peak positions of the acid sites are analogous with each other; however, the NH3 amount of β1 and β2 in Ce-Cal-1 are higher than those in Ce-Cal-2, indicating that the Ce-Cal-1 could possess of more acid sites. Moreover, the acid amount of the strong acid sites in both Ce-Cal-1 and Ce-Cal-2 are higher than those in the weak acid sites. Therefore, the H2 consumption and NH3 desorption amount of Ce-Cal-1 are higher than those of Ce-Cal-2, possibly associating with the diverse shapes and different exposed crystalline facets[26-27]. Distinguishable physicochemical properties of the as-prepared rod-like and sheet-like CeO2 can be discovered.

 DownLoad:
CSV
DownLoad:
CSV
| Catalyst | H2-TPR | NH3-TPD | |||||
| H2 consumption / a.u.a | NH3 amount / a.u.b | ||||||
| α1 | α2 | α1+α2 | β1 | β2 | β1+β2 | ||
| Ce-Cal-1 | 1 090 | 946 | 2 036 | 8 187 | 9 385 | 17 572 | |
| Ce-Cal-2 | 849 | 864 | 1 713 | 5 999 | 7 941 | 13 940 | |
| a, b H2 consumption and NH3 amount are calculated from the corresponding peak area, respectively. | |||||||
To reveal the crystal phase and morphology evolution for the precursors of Ce-Cal-1 and Ce-Cal-2, time-dependent experiments were investigated. As displayed for the precursors of Ce-Cal-1 (Fig. 3(a)), the diffraction peaks of the samples can be well indexed to pure orthorhombic phase of CeOHCO3 (PDF No.41-0013). However, with regard to the precursors of Ce-Cal-2 (Fig. 3(b)), the resulted precursors show the gradual phase transformation behaviors from orthorho-mbic phase (initial period) to hexagonal phase (final period). As expected, those products can be comp-letely transformed into hexagonal phase of CeOHCO3 (PDF No.32-0189) with the longer reaction time (21 and 24 h). It is noticeable that the mixed phases of orthorhombic and hexagonal are involved in the intermediate stages.
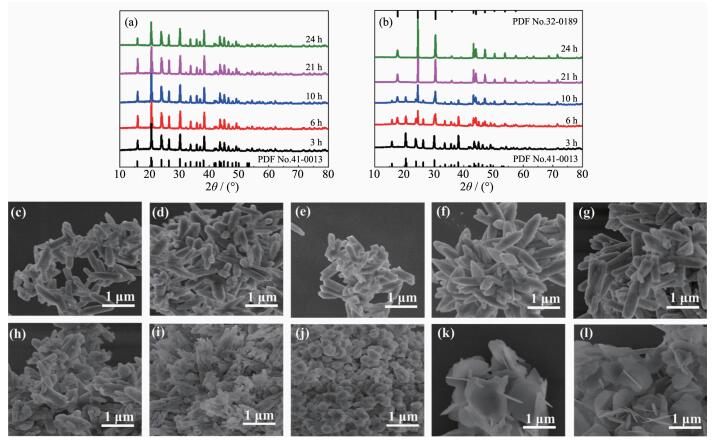
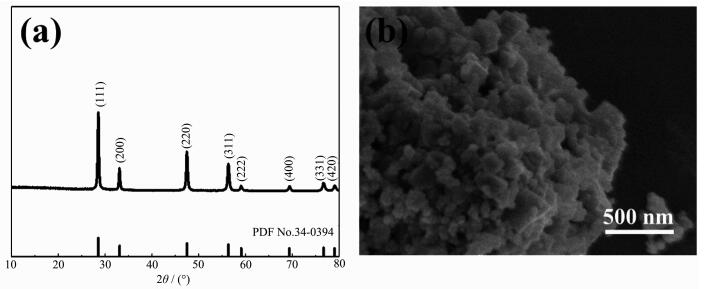
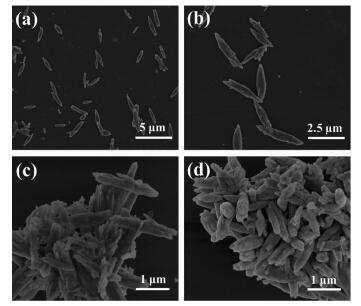
Besides, representative SEM images of the precu-rsors at different reaction intervals were examined. For the precursors of Ce-Cal-1, the SEM images display the simplex rod-like morphology from Fig. 3(c) to Fig. 3(g) without obvious morphology transformation. How-ever, as depicted from Fig. 3(h) to Fig. 3(l), the product affords rod-like structure at initial 3 h, and then the rod particles partially dissolve and accompany with the presence of some apparently granular particles (6 and 10 h). Finally, more sheet-like particles emerge as the dominant state (21 and 24 h). It should be noted that when the reaction system is absence of DHBA, the hydrothermal product presents the pure phase of CeO2 with irregular morphology (Fig. 4). Those results indicate that the CeOHCO3 with specific morphology fails to be obtained in this condition.
Temperature-dependent experiments based on Ce-Cal-2 were carried out and the SEM images are shown in Fig. 5. The sample obtained at 120 ℃ exhibits the rod-like structure with the average width of 300~500 nm and the length below 3 μm. Moreover, those particles present the highly decentralized state without significant aggregation. However, as the temperature up to 140 and 160 ℃, the products exhibit the rod-like morphology with the state of aggregation. Obviously, the typical sheet-like morph-ology of the product can be observed as the temperature reaching to 180 ℃ (Ce-Pre-2). This pheno-menon indicates that a morphology reconstruction process could be triggered with the high temperature.
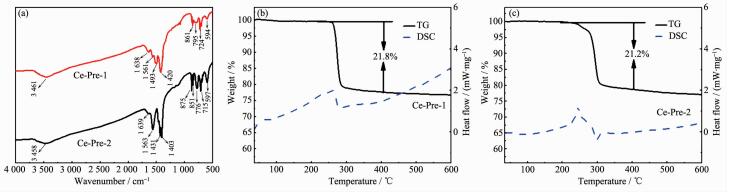
For investigating the inorganic species of Ce-Pre-1 and Ce-Pre-2, FT-IR was recorded and the results are displayed in Fig. 6(a). The Ce-Pre-1 is taken as an example to illustrate. The peak at ca. 3 461 cm-1 could be due to the stretching vibration of O-H groups in the adsorbed water, and the bending mode of O-H at ca. 1 638 cm-1 could also be observed. The band at ca. 1 561 cm-1 should be attributable to the asymmetric stretching of CO2. Another sharp peak at ca. 1 420 cm-1 may be assigned to the stretching vibration of CO32-. Besides, in the region of 700~900 cm-1, the bands at ca. 861 and ca. 724 cm-1 are correspondingly attri-buted to the deformation of CO32- and asymmetric vibration of CO2 species, respectively. The peak at ca. 594 cm-1 could be ascribed to the Ce-O stretching band[28]. Some of the characteristic peaks including the stretching vibration and bending mode of O-H, the asymmetric stretching of CO2 and the stretching band of Ce-O in Ce-Pre-2 are similar to Ce-Pre-1, indicating the same component of the two samples (CeOHCO3). However, some difference can be found in the range of 1 400~1 500 cm-1 and 700~900 cm-1, which could be due to the different crystal phases and morpholo-gies of the CeOHCO3. In addition, the thermostability of Ce-Pre-1 and Ce-Pre-2 were analyzed by thermo-gravimetry and differential scanning calorimetry (TG-DSC). As can be seen from Fig. 6(b) and Fig. 6(c), the curves manifest the weight loss between 240 and 300 ℃ with the major exothermic peak. The weight loss of Ce-Pre-1 and Ce-Pre-2 are approximately 21.8% and 21.2%, respectively, which are close to the theoretical decomposition value of CeOHCO3 to CeO2 (20.7%).
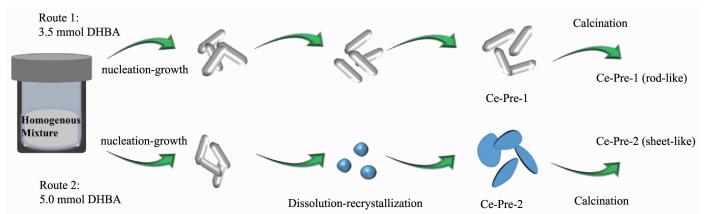
Based on the above-mentioned characterization and analysis, we tentatively propose that the DHBA could decompose into carbon species (CO32-). The OH- could also be produced by the hydrolysis of CO32-, CH3COO- under the hydrothermal condition. Thus, Ce3+ could combine with OH- and CO32- to generate small granules with high surface energy. Meantime, the sustaining nucleation could be favorable to the growth of rod-like orthorhombic phase of CeOHCO3. It is noticeable that the rod-like CeOHCO3 could exist as the stable product with 3.5 mmol of DHBA (Fig. 7, Route 1). While the process of dissolution and recrystallization could be triggered with 5.0 mmol of DHBA, and rod-like CeOHCO3 could dissolve and reconstruct to form the sheet-like hexagonal phase of CeOHCO3 ultimately (Fig. 7, Route 2). As reported, the defects of the crystals could induce the dissolution and recrystallization process for the formation of CeO2 with nanosheet morphologies[29-30]. However, in consi-deration of the different experiment conditions, the high content of the DHBA and high hydrothermal temperature could also play the important roles in this process. Furthermore, the as-prepared CeO2 could preserve the rod-like and sheet-like morphologies after calcination.
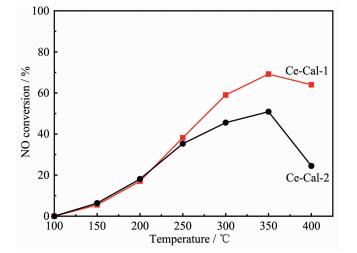
In this work, Ce-Cal-1 and Ce-Cal-2 are used as catalysts for eliminating NO with NH3. As shown in Fig. 8, both of the samples present the similar trend of NO conversion from 100 to 400 ℃. With increasing the temperature to 350 ℃, Ce-Cal-1 shows the higher conversion about 69.2% compared with Ce-Cal-2 (50.9%). According to the results of H2-TPR and NH3-TPD, this phenomenon could be due to that Ce-Cal-1 possesses of the higher redox ability and more acid amount. The obtained CeO2 particles exhibit structure-dependent catalytic activity for the catalytic reduction of NO. Besides, both the NO conversion of Ce-Cal-1 and Ce-Cal-2 are higher than the reported pure CeO2, indicating high catalytic activity of Ce-Cal-1[31]. On the account of the catalytic results, the rod-like CeO2 could be viewed as the optimized structure for the reaction.
In summary, the rod-like and sheet-like CeOHCO3 were successfully synthesized with the assistant of 2, 4-dihydroxybenzonic acid. The rod-like orthorhombic phase of CeOHCO3 was proposed as the stable product via the nucleation growth process, and the dissolution and recrystallization accompanied with the morphology evolution and phase transformation were supposed to the generation of sheet-like hexagonal phase of CeOHCO3. The highly dispersed rod-like CeOHCO3 could be obtained under the low hydrothermal temp-erature, while the state of aggregation and the trans-formation of morphology could be triggered by the high temperature. The obtained CeO2 presented distinguishable structure-dependent properties, and the rod-like CeO2 exhibited higher redox ability and more acid amount. Moreover, the rod-like CeO2 manifested the better catalytic activity in NH3-SCR. Furthermore, it is proposed that more benzoic acid compounds can be expected to fabricate metal oxides with desirable morphologies.
Mitsudome T, Yamamoto M, Maeno Z, et al. J. Am. Chem. Soc., 2015, 137(42):13452-13455 doi: 10.1021/jacs.5b07521
Yen H, Seo Y, Kaliaguine S, et al. Angew. Chem. Int. Ed., 2012, 51(48):12032-12035 doi: 10.1002/anie.201206505
Li Y, Luo W, Qin N, et al. Angew. Chem. Int. Ed., 2014, 53(34):9035-9040 doi: 10.1002/anie.201403817
彭娟, 李晔, 季鹏宇, 等.无机化学学报, 2012, 28(6):1251-1258 http://www.wanfangdata.com.cn/details/detail.do?_type=perio&id=wjhxxb201206029PENG Juan, LI Ye, JI Peng-Yu, et al. Chinese J. Inorg. Chem., 2012, 28(6):1251-1258 http://www.wanfangdata.com.cn/details/detail.do?_type=perio&id=wjhxxb201206029
Bai J, Li X, Liu G, et al. Adv. Funct. Mater., 2014, 24(20):3012-3020 doi: 10.1002/adfm.v24.20
Cai D P, Wang D D, Huang H, et al. J. Mater. Chem. A, 2015, 3(21):11430-11436 doi: 10.1039/C5TA00539F
Florea I, Feral-Martin C, Majimel J, et al. Cryst. Growth Des., 2013, 13(3):1110-1121 doi: 10.1021/cg301445h
Qi G S, Yang R T, Chang R. Appl. Catal. B:Environ., 2004, 51(2):93-106 doi: 10.1016/j.apcatb.2004.01.023
Sayle D C, Maicaneanu S A, Watson G W. J. Am. Chem. Soc., 2002, 124(38):11429-11439 doi: 10.1021/ja020657f
Premkumar T, Govindarajan S, Coles A E, et al. J. Phys. Chem. B, 2005, 109(13):6126-6129 doi: 10.1021/jp0445223
Tang C J, Zhang H L, Dong L. Catal. Sci. Technol., 2016, 6(5):1248-1264 doi: 10.1039/C5CY01487E
Qi J, Zhao K, Li G, et al. Nanoscale, 2014, 6(8):4072-4077 doi: 10.1039/C3NR06822F
Wang X, Zhang Y, Song S, et al. Angew. Chem. Int. Ed., 2016, 55(14):4542-4546 doi: 10.1002/anie.201600625
Li L, Sun B, Sun J, et al. Catal. Commun., 2017, 100:98-102 doi: 10.1016/j.catcom.2017.06.019
Ma K, Zou W, Zhang L, et al. RSC Adv., 2017, 7(10):5989-5999 doi: 10.1039/C6RA25863H
位忠斌, 崔育倩, 郭培志, 等.无机化学学报, 2011, 27(7):1399-1404 http://kns.cnki.net/KCMS/detail/detail.aspx?filename=wjhx201107032&dbname=CJFD&dbcode=CJFQWEI Zhong-Bin, CUI Yu-Qian, GUO Pei-Zhi, et al. Chinese J. Inorg. Chem., 2011, 27(7):1399-1404 http://kns.cnki.net/KCMS/detail/detail.aspx?filename=wjhx201107032&dbname=CJFD&dbcode=CJFQ
Ho C, Yu J C, Kwong T, et al. Chem. Mater., 2005, 17(17):4514-4522 doi: 10.1021/cm0507967
乐琳, 张晓鸣.无机化学学报, 2008, 24(5):715-722 http://kns.cnki.net/KCMS/detail/detail.aspx?filename=wjhx200805009&dbname=CJFD&dbcode=CJFQYUE Lin, ZHANG Xiao-Ming. Chinese J. Inorg. Chem., 2008, 24(5):715-722 http://kns.cnki.net/KCMS/detail/detail.aspx?filename=wjhx200805009&dbname=CJFD&dbcode=CJFQ
Voskanyan A A, Chan K Y, Li C Y V. Chem. Mater., 2016, 28(8):2768-2775 doi: 10.1021/acs.chemmater.6b00505
Fan S, Dong W, Huang X, et al. ACS Catal., 2017, 7(1):243-249 doi: 10.1021/acscatal.6b02614
Korpany K V, Majewski D D, Chiu C T, et al. Langmuir, 2017, 33(12):3000-3013 doi: 10.1021/acs.langmuir.6b03491
Liu W, Feng L, Zhang C, et al. J. Mater. Chem. A, 2013, 1(23):6942-6948 doi: 10.1039/c3ta10487g
Zhang L, Li L, Cao Y, et al. Catal. Sci. Technol., 2015, 5(4):2188-2196 doi: 10.1039/C4CY01412J
Yao X, Zhang L, Li L, et al. Appl. Cata. B:Environ., 2014, 150:315-329 http://www.sciencedirect.com/science/article/pii/S0926337313007522
Zhang D, Zhang L, Shi L, et al. Nanoscale, 2013, 5(3):1127-1136 doi: 10.1039/c2nr33006g
Aneggi E, Wiater D, de Leitenburg C, et al. ACS Catal., 2014, 4(1):172-181 doi: 10.1021/cs400850r
Sayle T X T, Cantoni M, Bhatta U M, et al. Chem. Mater., 2012, 24(10):1811-1821 doi: 10.1021/cm3003436
Sun C W, Sun J, Xiao G L, et al. J. Phys. Chem. B, 2006, 110(27):13445-13452 doi: 10.1021/jp062179r
Li C R, Sun Q T, Lu N P, et al. J. Cryst. Growth, 2012, 343(1):95-100 doi: 10.1016/j.jcrysgro.2012.01.041
Gong J, Meng F, Yang X, et al. J. Alloys Compd., 2016, 689:606-616 doi: 10.1016/j.jallcom.2016.08.030
Yao X, Ma K, Zou W, et al. Chin. J. Catal., 2017, 38(1):146-159 doi: 10.1016/S1872-2067(16)62572-X

Figure 1 XRD patterns (a, e), SEM images (b, f), TEM images (c, g), HRTEM images (d, h) with the corresponding SAED (inset) of Ce-Cal-1 and Ce-Cal-2, respectively

Figure 2 N2 adsorption-desorption isotherms (a, b), H2-TPR (c) and NH3-TPD profiles (d) of Ce-Cal-1 and Ce-Cal-2

Figure 3 XRD patterns of the precursors Ce-Cal-1 (a) and Ce-Cal-2(b) at different hydrothermal intervals; SEM images for the precursors of Ce-Cal-1 (c~g) and Ce-Cal-2 (h~l) at different reaction intervals of 3, 6, 10, 21 and 24 h, respectively

Figure 4 XRD pattern(a) and SEM image(b) of the hydrothermal product synthesized without DHBA

Figure 5 SEM images of the hydrothermal products at 120 ℃ (a, b), 140 ℃ (c) and 160 ℃ (d)

Figure 7 Illustration for the possible morphology evolution process for the Ce-Cal-1 and Ce-Cal-2
Table 1. Quantitative analysis of H2-TPR and NH3-TPD
| Catalyst | H2-TPR | NH3-TPD | |||||
| H2 consumption / a.u.a | NH3 amount / a.u.b | ||||||
| α1 | α2 | α1+α2 | β1 | β2 | β1+β2 | ||
| Ce-Cal-1 | 1 090 | 946 | 2 036 | 8 187 | 9 385 | 17 572 | |
| Ce-Cal-2 | 849 | 864 | 1 713 | 5 999 | 7 941 | 13 940 | |
| a, b H2 consumption and NH3 amount are calculated from the corresponding peak area, respectively. | |||||||
 下载: 导出CSV

 扫一扫看文章


扫一扫关注我们

