Received Date:
26 December 2017 Revised Date:
16 April 2018 Available Online:
10 June 2018
Abstract:
A novel one-dimensional structured (1D) TiO2-coated CdTe@C nanowires support for Au nanoparticles (CdTe@C@TiO2-Au) is synthesized for photocatalysis application. The structure and properties of the prepared photocatalysts are investigated by X-ray powder diffraction (XRD), scanning transmission electron microscopy (SEM), transmission electron microscopy (TEM), X-ray photoelectron spectra (XPS), and UV-Vis instruments (DRS). As an example of applications, the photodegradation of rhodamine B (RhB) is investigated under the simulated sunlight irradiation. It is found that the photocatalytic activities of these catalysts are 1D CdTe@C@TiO2-Au heteronanowires > CdTe@C@TiO2 nanowires > pure TiO2. Moreover, the degradation rates can reach 95.3% for CdTe@C@TiO2-Au with 270 min of irradiation time. This outcome is attributed to the localized surface plasmon resonance (LSPR) of Au nanoparticles largely enhanced visible light absorption, the efficient photogenerated electron separation of the prepared catalyst and CdTe@C nanowires photosensitized TiO2 structures.
In the past two decades, titanium dioxide (TiO2), as an excellent photocatalyst, has been widely studied in various degradation of environmental pollutants. In spite of its high chemical stability, nontoxicity, low cost, and excellent degradation for organic pollutants, it can′t effectively utilize visible light in solar energy due to its large band gap (about 3.2 eV). In order to improve utilization rate of visible-light region and the photocatalytic activity of TiO2, many studies have been performed by photosensitizing TiO2 structures with narrow band gap semiconductors such as CdS, CdSe, CdTe et al.[1-5], carbonaceous materials and deposition of noble metals on the surface of TiO2[6-9]. Among various small band gap semiconductors, CdTe (Eg=1.5 eV) is considered to be one of the most likely candidates due to its unique electrochemical properties, and has been used in photo-electronchemical process. For example, Li has reported an efficient way to synthesize the CdTe quantum dots (QDs)-doped TiO2 photocatalysts, which exhibits much higher photocatalytic activities than both controlled TiO2 (without doped CdTe QDs) and P25 (TiO2, Degussa)[4]. Liu has reported an efficient way to synthesize the samenvatting reduced graphene oxide and CdTe nanoparticles co-decorated TiO2 nanotube array as a visible light photocatalyst[10]. On the other hand, the noble metal nanoparticle based on photocatalysts can assist the electrons transfer and the efficient harvesting of visible-light[11-12]. In addition, carbonaceous materials, due to their wide visible light absorption and high adsorption of organic pollutants, which facilitate the interface reaction of photocataly-sis, have received particular attention[13-14]. But so far, there are limited reports about using CdTe-Carbon-TiO2-Noble metal system as photocatalyst for degrada-tion of dye. In particular, the CdTe nanowires based on plasmonic photocatalysts has not been reported. Therefore, it is critical to develop a novel one-dimensional structured CdTe@C@TiO2-Au heteronano-wires for enhanced photocatalytic properties.
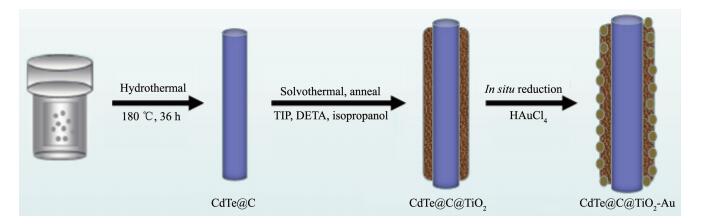
In the present study, efficient strategy for the synthesis of 1D CdTe@C@TiO2-Au heteronanowires for enhanced photocatalytic properties by a facile, efficient and controllable approach is proposed. The preparation procedure is shown in Scheme 1. First, CdTe@C nanowires are synthesized by one-step hydro-thermal process. Next, the CdTe@C@TiO2 nanowires are prepared by the solvothermal method using TIP as titanium source. Finally, Au nanoparticles, which are dispersed on the CdTe@C@TiO2 nanowires by in situ reduction of HAuCl4. Then, this prepared photo-catalyst is studied for the photocatalytic degradation rate of RhB under the simulated sunlight irradiation.
Scheme 1
图 Scheme 1
Preparation procedure of the CdTe@C@TiO2-Au core-shell heteronanowires
Scheme 1.
Preparation procedure of the CdTe@C@TiO2-Au core-shell heteronanowires
Ascorbic acid (C6H8O6), cetyltrimethy-lammoniu-mbromide (CTAB), sodium tellurite (Na2TeO3), cadmiu-mchloride (CdCl2·2.5H2O), anhydrous ethanol, and isopropanol were purchased from Guangfu Fine Chem-ical Research Institute (Tianjin, China); Titanium isopropoxide (TIP, 97%), diethylenetriamine (DETA) and chloroauric acid (HAuCl4·4H2O) were purchased from Sigma-Aldrich.
1.2
Instruments
TEM images were obtained on a JEM-2100 TEM (JEOL Ltd., Tokyo, Japan, 200 kV). XRD analysis was performed using a Dmax-2500 (Rigaku Corporation, Tokyo, Japan, Cu Kα, λ=0.154 06 nm, U=40 kV, I=40 mA), analyzed samples were scanned from 10° to 80° at a scanning rate of 10 ℃·min-1. SEM was carried out on a Philips XL30 microscope (Philips, Amsterdam, Netherlands) coupled to an EDAX DX4i analyzer for energy-dispersive X-ray analysis at 20 kV. XPS analysis was recorded by Thermo ESCALAB 250XI X-ray photoelectron spectrometer (Thermo Fisher Scien-tific Inc., Waltham, MA, USA) with a monochro-matized Al Kα X-ray source (1 486.6 eV) at a cons-tant dwell time of 50 ms and a pass-energy of 50 eV. The UV-Vis absor-ption spectra of all the samples were obtained using a U-4100 spectro-photometer (Shimadzu, Tokyo, Japan).
1.3
Synthesis and preparation
1.3.1
Synthesis of CdTe@C core-shell nanowires
The core-shell CdTe@C nanowires were synthe-sised according to previously reported[15]. 1.0 g ascorbic acid (C6H8O6) and 0.3 g CTAB were dissolved in 70 mL of deionized water, 0.5 g Na2TeO3 and 0.52 g CdCl2·2.5H2O were added to the above solution in order; a white TeO2 was precipitated immediately upon the addition of the Na2TeO3 then, the above solution was transferred into a 100 mL Teflon-lined stainless steel autoclave. Finally, the reaction was maintained at 180 ℃ for 36 h in a preheated electric oven. The black products were collected and washed repeatedly with deionized water and ethanol, then dried at 60 ℃ for 12 h.
1.3.2
Synthesis of CdTe@C@TiO2 one-dimensional nanowires
First, 0.1 g CdTe@C nanowires were dispersed into 70 mL isopropanol, and then 0.03 mL DETA and 1.5 mL TIP were added into the obtained solution. The above solution was subsequently transferred into a 100 mL Teflon-lined stainless steel autoclave and kept in an electric oven at 200 ℃ for 24 h. When the reaction kettle was left to cool down to room temperature, the black products were collected after washing, centrifugation, and drying. Finally, the prepared CdTe@C@TiO2 was treated at 450 ℃ in N2 for 2 h with a heating rate of 1 ℃·min-1 to obtain highly crystalline phase.
1.3.3
Synthesis of CdTe@C@TiO2-Au one- dimensional heteronanowires
0.1 g CdTe@C@TiO2 heteronanowires and 1 mL (0.01 g·mL-1) HAuCl4 were dispersed into 100 mL deionized water, the solution was heated and kept boiling under vigorous stirring for 10 minutes. Then 5 mL (0.01 g·mL-1) aqueous solution of sodium citrate were injected into the above solution, the reaction proc-eeded for 15 min. Finally, the CdTe@C@TiO2-Au heteronanowires were collected after washing, centri-fugation and drying.
Pure TiO2 nanoparticles were obtained using a similar procedure to the above without CdTe@C nanowires.
1.4
Photocatalytic activity of the CdTe@C@TiO2
-Au heteronanowires
Photocatalytic activity of the CdTe@C@TiO2-Au heteronanowires was evaluated by the degradation of RhB under the simulated sunlight irradiation by a 500 W Xe arc lamp. The experiments were as follows: 0.03 g the prepared photocatalyst was dispersed in a 150 mL (25 mg·L-1) RhB aqueous solution. After reaching the adsorption-desorption equilibrium among the photocatalyst, RhB, and water, the reaction began under light irradiation, the RhB solution was filtrated to measure for every 30 min. The absorption of RhB was determined by an UV-Visible spectrophotometer (UV-4510, Shimadzu, Japan). Total organic carbon (TOC) of the RhB solution was measured with a Shimadzu TOC-VCPH analyzer.
2.
Results and discussion
2.1
Characterization of CdTe@C@TiO2-Au heteronanowires
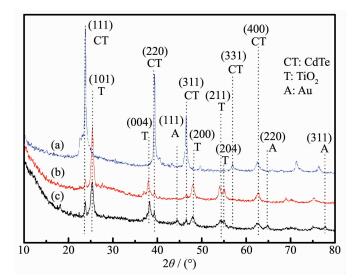
XRD patterns of the synthesized CdTe@C@TiO2-Au, CdTe@C, CdTe@C@TiO2 nanowires are shown in Fig. 1. As shown in Fig. 1, the five diffraction peaks of CdTe are clearly seen at 23.9°, 39.5°, 46.5°, 57.1° and 62.6° of all the samples, which are indexed to the (111), (220), (311), (331) and (400) planes of the zinc-blende CdTe (PDF No.15-0770). As shown in Fig. 1b, after deposition of TiO2 nanoparticles onto the CdTe@ C nanowires, the additional diffraction peaks at 2θ=25.5°, 38.1°, 48.2°, 54.3°, and 55.0° assigned to the (101), (004), (200), (211) and (204) planes (PDF No.89-4921) are obviously observed[16]. In comparison with the CdTe@C@TiO2 nanowires, after grafting of Au nanoparticles on the surface, the typical diffraction peaks of Au nanoparticles can be detected (Fig. 1c), which are in agreement with the standard values of gold (PDF No.04-0784).
图 1
图 1
XRD patterns of (a) CdTe@C, (b) CdTe@C@TiO2 and (c) CdTe@C@TiO2-Au
Figure 1.
XRD patterns of (a) CdTe@C, (b) CdTe@C@TiO2 and (c) CdTe@C@TiO2-Au
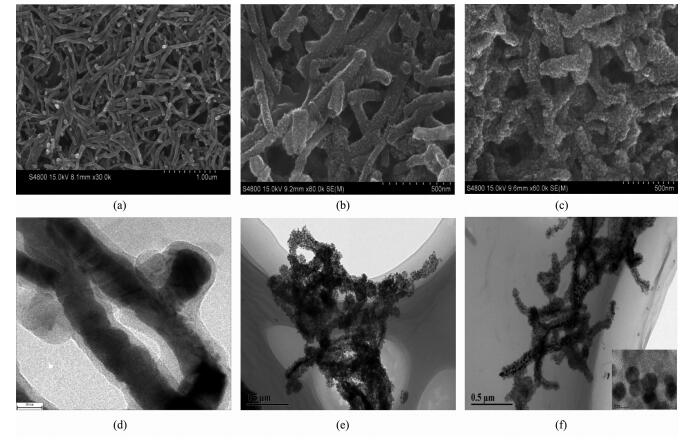
The morphology of synthesized CdTe@C, CdTe@ C@TiO2, and CdTe@C@TiO2-Au nanowires are chara-cterized by SEM and TEM. As can be seen in Fig. 2(a, d), the as-prepared CdTe@C nanowires exhibit the average diameter of one-dimensional morphology is about 50 nm and the lengths is longer than 1 μm, which is consistent with the previous reports[15, 17]. Moreover, it is obvious that the carbon shell of CdTe@ C nanowires is about 10 nm. As can be seen in Fig. 2(b, e), after deposition of TiO2 nanoparticles onto the CdTe@C nanowires, the average diameter of the CdTe@C@TiO2 is about 150 nm. It is obvious that the uniformly TiO2 nanoparticles are densely coated on the surface of CdTe@C nanowires forming the one-dimensional CdTe@C@TiO2 nanowires. As can be seen in Fig. 2(c, f), after loading Au nanoparticles on the surface of CdTe@C@TiO2 nanowires, the average diameter of Au nanoparticles (10 nm) (inset of Fig. 2f) is successfully coated on the surface of CdTe@C@TiO2 nanowires.
图 2
图 2
SEM and TEM images of (a, d) CdTe@C nanowires, (b, e) CdTe@C@TiO2 nanowires and (c, f) CdTe@C@TiO2-Au nanowires
Figure 2.
SEM and TEM images of (a, d) CdTe@C nanowires, (b, e) CdTe@C@TiO2 nanowires and (c, f) CdTe@C@TiO2-Au nanowires
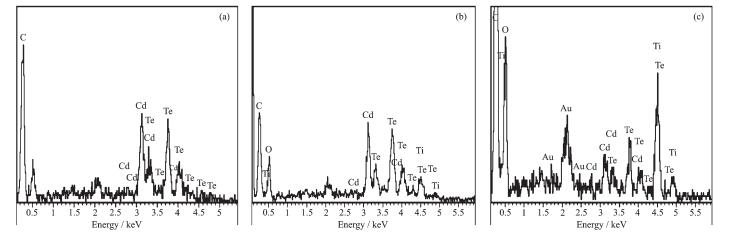
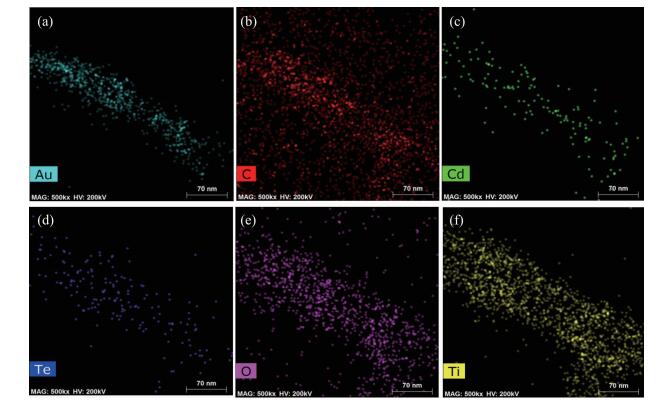
In order to analyze the chemical composition of the synthesized CdTe@C, CdTe@C@TiO2, and CdTe@ C@TiO2-Au nanowires, the EDX spectrum was obtained for the above one-dimensional structure. As can be seen in Fig. 3a, the spectrum reveals the presence of Cd, Te, and C peaks in the CdTe@C nanowires struc-ture. After deposition of TiO2 onto the CdTe@C nano-wires, the presence of Cd, Te, C, Ti and O peaks in the CdTe@C@TiO2 nanowires structure is confirmed (Fig. 3b). After loading Au nanoparticles on the surface of CdTe@C@TiO2 nanowires, it is clearly seen that the additional Au element appears (Fig. 3c), which indi-cates that the Au nanoparticles have been loaded successfully. Furthermore, the spatial distribution of each element in these structures is investigated by the electron mapping image analysis as shown in Fig. 4(a~f).
图 3
图 3
EDX spectra of (a) CdTe@C nanowires, (b) CdTe@C@TiO2 nanowires and (c) CdTe@C@TiO2-Au nanowires
Figure 3.
EDX spectra of (a) CdTe@C nanowires, (b) CdTe@C@TiO2 nanowires and (c) CdTe@C@TiO2-Au nanowires
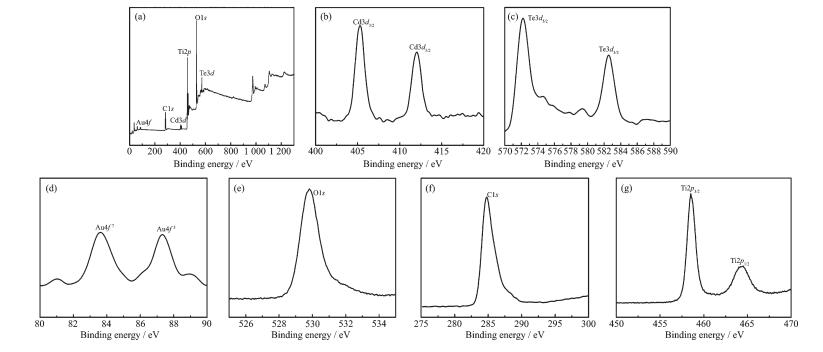
XPS spectra are collected to determine the chemical composition and identify the chemical states of the as-prepared CdTe@C@TiO2-Au samples in Fig. 5. Fig. 5a shows the fully XPS spectra, it reveals the presence of Cd, Te, C, Ti, O and Au elements in the CdTe@C@TiO2-Au, which is consistent with the analysis of EDX and elemental mappings. As shown in Fig. 5b, the Cd3d spectrum displays two peaks at 405.3 and 412.0 eV, which are attributed to the Cd in the CdTe[18]. The Te3d spectrum appears at 571.8 and 582.2 eV, which are corresponded to the Cd-Te bonding states in Fig. 5c[18]. In the Au4f spectrum (Fig. 5d), the binding energies of the peaks at 87.7 and 84.1 eV are Au4f5 and Au4f7[19], respectively. Fig 5(e, f) displays the C1s and O1s spectra, respectively. The peaks with binding energy of 284.8 and 531.7 eV are correspond to the C-C skeleton and an -OH group[18, 20]. Fig. 5g displays the Ti spectrum, the two peaks at 464.1 and 458.4 eV can be attributed to the Ti2p1/2 and Ti2p3/2, respectively, which are assigned to the Ti4+ oxidation state according to reported XPS data[21].
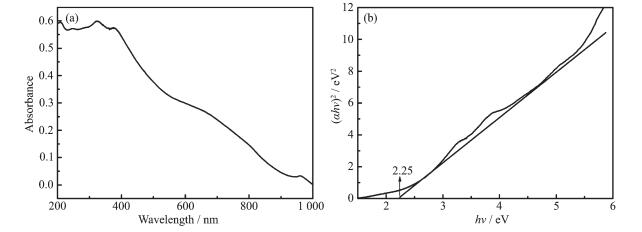
To investigate the optical property of the as-prepared CdTe@C nanowires, the samples are characterized by absorption spectra. The spectrum ((Fig. 6a) reveals that the CdTe@C nanowires have low absorption in the NIR (near infrared reflection) region, whereas the absorption is high in the UV-Vis regions. Based on their absorption spectra, the variation in the absorption coefficient as a function of photon energy for allowed direct transitions is given by:
where α is the absorption coefficient, A is a constant, h is Planck′s constant, ν is the frequency, and Eg is the band gap energy. The Eg value is obtained by extrapolating the linear part to intercept with the energy axis (Fig. 6b) and is found to be 2.25 eV.
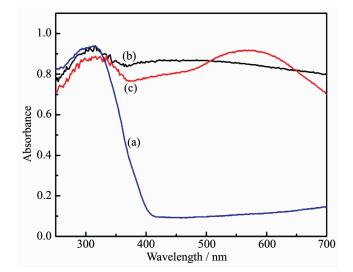
Furthermore, the optical properties of the as-prepared (a) pure TiO2 nanoparticles, (b) CdTe@C@ TiO2 nanowires and (c) CdTe@C@TiO2-Au nanowires are investigated by UV-Vis diffuse reflectance spectra (Fig. 7). As shown in Fig. 7a, the absorption peak of the pure TiO2 nanoparticles is around 315 nm, and there is almost no absorption of visible light. In contrast to the pure TiO2, after coating a layer of porous TiO2 shell on the surface of CdTe@C, the strong absorption in visible light region was appeared due to the syner-gistic effect of CdTe@C@TiO2 nanowires (Fig. 7b). As shown in Fig. 7c, it is evident that the absorption in visible light region is further improved due to the surface plasmon of Au nanoparticles.
图 7
图 7
UV-Vis spectroscopy of (a) pure TiO2 nanoparticles,
(b) CdTe@C@TiO2 nanowires and (c) CdTe@C@ TiO2-Au nanowires
Figure 7.
UV-Vis spectroscopy of (a) pure TiO2 nanoparticles,
(b) CdTe@C@TiO2 nanowires and (c) CdTe@C@ TiO2-Au nanowires
2.2
Photocatalytic activities of the CdTe@C@ TiO2-Au nanowires
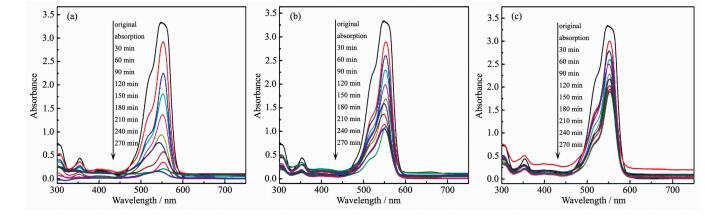
The photocatalytic activities of CdTe@C@TiO2-Au nanowires are evaluated through the RhB degrada-tion under the simulated sunlight irradiation. Fig. 8(a~c) display the absorption spectra of RhB solutions by different photocatalyst, respectively. It is clearly seen that the absorption peak at 552.5 nm diminishes gradually as time go on for all the samples. Further-more, it is also clearly seen that the degradation activities of CdTe@C@TiO2-Au nanowires are higher than CdTe@C@TiO2 nanowires and pure TiO2.
图 8
图 8
Absorption spectra of photocatalytic degradation of RhB solution under different photocatalysts of (a) CdTe@C@TiO2-Au nanowires, (b) CdTe@C@TiO2 nanowires and (c) pure TiO2
Figure 8.
Absorption spectra of photocatalytic degradation of RhB solution under different photocatalysts of (a) CdTe@C@TiO2-Au nanowires, (b) CdTe@C@TiO2 nanowires and (c) pure TiO2
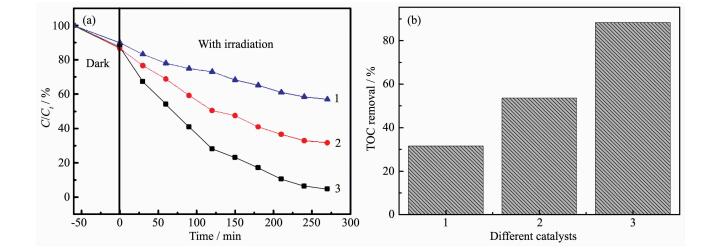
In addition, as shown in Fig. 9a, it can be clearly observed that the degradation rates reach 95.3% for CdTe@C@TiO2-Au nanowires, 68.3% for CdTe@C@ TiO2, and 43.1% for pure after 270 min of simulated sunlight illumination, where C is the initial concentra-tion before the dark reaction and Ct is a concentration of reaction time. The outstanding photocatalytic degra-dation activities of the CdTe@C@TiO2-Au nanowires are mainly due to the following advantages: (1) the LSPR of Au metals enhances plasmonic absorption in visible light region; (2) Au nanoparticles effectively improve the separation of photogenerated e-/h+ pairs in the TiO2 shell; (3) The CdTe@C nanowires offere more pronounced photon absorption due to the photosensi-tization of TiO2 structures[10]. Meanwhile, the TOC removal in the catalytic process is also measured. As shown in Fig. 9b, CdTe@C@TiO2-Au nanowires exhibit the best catalytic performance for RhB mineralization. The initial TOC value of RhB is 24.29 mg·L-1, and the results show that the TOC removal (2.85 mg·L-1) rates reach 88.3% for CdTe@C@TiO2-Au nanowires, 53.6% (11.27 mg·L-1) for CdTe@C@TiO2, and 31.49% (16.64 mg·L-1) for pure TiO2 after 270 min of simulated sunlight illumination. The results of TOC removal are consistent with Fig. 9a. However, the TOC measurements show that complete mineralization (conversion of all carbon atoms to CO or CO2) cannot be achieved. This indicates that some small organic compounds (aldehydes, carboxylic acids etc.) still remain when the chromophores (aromatic rings) are completely broken.
图 9
图 9
a) Degradation rate of RhB solution under different photocatalysts; (b) TOC removal rates under different photocatalysts after 270 min simulated sunlight illumination
Figure 9.
a) Degradation rate of RhB solution under different photocatalysts; (b) TOC removal rates under different photocatalysts after 270 min simulated sunlight illumination
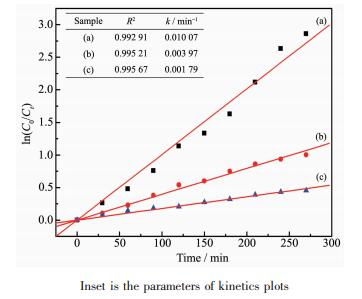
On the other hand, the kinetics of catalytic degradation of RhB in different samples is used to quantify the catalytic efficiency with the following equation:
Where C0 is the initial concentration after the dark reaction, k is a rate constant, t is time, R2 is coefficient of determination.
Linear relationships between ln(C0 /Ct) and the reaction time are displayed in Fig. 10(a~c), which matched well with the first-order reaction kinetics. When the system is performed with the CdTe@C@ TiO2-Au nanowires as catalysts, the rate constant k (Fig. 10a) is calculated to be 0.010 07 min-1, which is higher than CdTe@C@TiO2 nanowires (k=0.003 97 min-1, in Fig. 10b) and pure TiO2 (k=0.001 79 min-1, in Fig. 10c).
图 10
图 10
Kinetics of catalytic degradation of RhB under different photocatalysts of (a) CdTe@C@TiO2-Au nanowires, (b) CdTe@C@TiO2 nanowires and (c) pure TiO2
Figure 10.
Kinetics of catalytic degradation of RhB under different photocatalysts of (a) CdTe@C@TiO2-Au nanowires, (b) CdTe@C@TiO2 nanowires and (c) pure TiO2
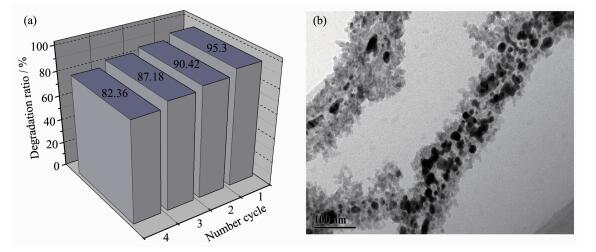
In order to investigate the stability of CdTe@C@ TiO2-Au nanowires in the photocatalytic RhB system, the CdTe@C@TiO2-Au is reused by centrifugalization. As presented in Fig. 11, the catalytic activity of CdTe@C@TiO2-Au decreases slightly obviously after recycling for four times. This may be due to the agglomeration and the loss of Au nanoparticles during repeated reuse.
图 11
图 11
(a) Degradation rate of RhB in 270 min by CdTe@C@TiO2-Au for four cycles; (b) TEM image of CdTe@C@TiO2-Au after four cycles
Figure 11.
(a) Degradation rate of RhB in 270 min by CdTe@C@TiO2-Au for four cycles; (b) TEM image of CdTe@C@TiO2-Au after four cycles
In general, the band structure of the photo-catalyst is responsible for the efficient generation and separation process of the electron-hole pairs. The band positions of CdTe@C nanowires can be calcul-ated by the following empirical formulas[22]:
where EVB is the valence band (VB) potentials, ECB is the conduction band (CB) potential, X is the electrone-gativity of the semiconductor (which is the geometric mean of the electronegativity of the constituent atoms), Ee is the energy of free electrons on the hydrogen scale (~4.5 eV), X is the electronegativity of the semicond-uctor (5.3 eV for CdTe@C). Therefore, EVB of CdTe@C is 1.93 eV, ECB of CdTe@C is -0.32 eV, EVB of TiO2 is 3.0 eV, ECB of TiO2 is -0.2 eV. In addition, the Au nano-particles decorated on the surface of semiconductor can act as electron trap to promote the separation of photogenerated charge carriers, absorb visible light and generate electrons due to the LSPR effect as well.
Based on the above discussion, we proposed a complete photocatalytic mechanism for the 1D CdTe@ C@TiO2-Au nanowires under the simulated sunlight irradiation as illustrated by formulae (5~11).
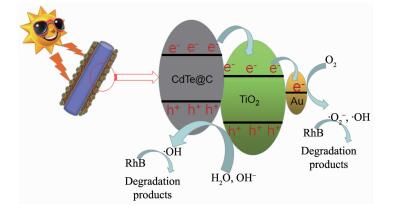
Existing literatures show that CdTe has a high optical absorption capacity for visible light as a narrow band gap energy semiconductor at room temperature[23]. By controlling the morphological parameters of CdTe from quantum dot to nanowires, a wide range of band gap energies in the visible spectrum can be formed[24-25]. In addition, CdTe nanowires with carbon can not only make itself more stable, but also improve the visible light photocatalytic activity[13]. When the CdTe@C@ TiO2-Au catalyst was exposed to an Xe lamp, the materials of CdTe nanowires and TiO2 are excited (formula 5). Then, the photoexcited electron migrates from the conduction band of CdTe (CBCdTe) to the conduction band of TiO2 (CBTiO2), leaving the photoge-nerated holes in the valence band of CdTe (CdTiO2), and the photogenerated holes of TiO2 move from the VBTiO2 to the VBCdTe, which can hinder the recombina-tion of electron and holes (formula 6)[18]. In addition, the Au nanoparticles decorated on the surface of 1D CdTe@C@TiO2 can not only act as electron trap to promote the separation of photogenerated charge carriers, but also can absorb visible light and generate electrons due to the surface plasmon resonance effect (formulae 7 and 8). At last, the photogenerated holes react with H2O to form ·OH (formula 9). Meanwhile, the photogenerated electrons react with the O2 on the surface of catalyst or in the solution to form ·O2- (formula 10). Finally, the Rhodamine B are degraded by ·OH and ·O2- radicals (formula 11). In order to intuitively understand the charge separation and transfer between CdTe@C, TiO2 and Au under the simulated sunlight irradiation, the synergetic mechan-ism of the electron-hole separation is illustrated in Scheme 2.
Scheme 2
图 Scheme 2
Mechanism of charge separation and transfer between CdTe@C, TiO2 and Au nanoparticles under the simulated sunlight irradiation
Scheme 2.
Mechanism of charge separation and transfer between CdTe@C, TiO2 and Au nanoparticles under the simulated sunlight irradiation
In conclusion, we have successfully synthesized a novel 1D structured TiO2-coated CdTe@C nanowires support for Au nanoparticles. The characterization results confirm that the 1D morphology of CdTe@C @TiO2-Au nanowires with an average diameter of about 150 nm (the lengths>1 μm) combines the strong light harvesting capability. This ternary design can not only enhance the absorption in visible region, but also promote the photogenerated electron/hole separation. Consequently, it is found that the resultant 1D CdTe@C@TiO2-Au heteronanowires have much higher photocatalytic effect of RhB than that of CdTe@C@ TiO2 nanowires and pure TiO2, and the degradation rates can reach 95.3% for CdTe@C@TiO2-Au with 270 min of irradiation time.
[1]
Banerjee S, Mohapatra S K, Das P P, et al. Chem. Mater., 2015, 20(21):6784-6791
[2]
Kim J C, Choi J, Lee Y B, et al. Chem. Commun., 2006, 48(48):5024-5026
[3]
Ho W, Yu J C. J. Mol. Catal. A:Chem., 2006, 247(1):268-274
[4]
Li Y S, Jiang F L, Xiao Q, et al. Appl. Catal., B, 2010, 101(1):118-129
Zhuang J D, Tian Q F, Zhou H, et al. J. Mater. Chem., 2012, 22(14):7036-7042 doi: 10.1039/c2jm16924j
[14]
Wang D H, Jia L, Wu X L, et al. Nanoscale, 2012, 4(2):576-584 doi: 10.1039/C1NR11353D
[15]
Hadia N M, Awad M A, Mohamed S H. Appl. Phys. A, 2016, 122(10):889-893 doi: 10.1007/s00339-016-0425-9
[16]
李亮, 柳丽芬, 杨凤林.无机化学学报, 2017, 33(4):637-643 doi: 10.11862/CJIC.2017.082LI Liang, LIU Li-Fen, YANG Feng-Lin. Chinese J. Inorg. Chem., 2017, 33(4):637-643 doi: 10.11862/CJIC.2017.082
[17]
Yong S M, Muralidharan P, Jo S H. Mater. Lett., 2014, 64(14):1551-1554
[18]
Zhu W F, Pan S G, Wang W W, et al. New J. Chem., 2013, 37(9):2751-2757 doi: 10.1039/c3nj00132f
[19]
Shen M, Chen S Q, Jia W P, et al. Gold Bull., 2016, 9(3/4):103-109
[20]
Zheng Y Z, Xu Y Y, Fang H B, et al. RSC Adv., 2015, 5(126):103790-103796 doi: 10.1039/C5RA20737A
[21]
Dong Q S, Yu H C, Jiao Z B, et al. RSC Adv., 2014, 4(103):59114-59117 doi: 10.1039/C4RA09355K
[22]
Guan M L, Ma D K, Hu S W, et al. Inorg. Chem., 2011, 50(3):800-805 doi: 10.1021/ic101961z
[23]
Zhang W G, Liu J, Guo Z Y, et al. J. Mater. Sci.:Mater. Electron., 2017, 28(13):9505-9513 doi: 10.1007/s10854-017-6694-z
[24]
Fang J, Xu L, Zhang Z Y, et al. ACS Appl. Mater. Interface, 2013, 5(16):8088-8092 doi: 10.1021/am4021654
[25]
Liang X R, Tan S S, Tang Z Y. Langmuir, 2004, 20(4):1016-1020 doi: 10.1021/la035908s
Scheme 1
Preparation procedure of the CdTe@C@TiO2-Au core-shell heteronanowires
Figure 8
Absorption spectra of photocatalytic degradation of RhB solution under different photocatalysts of (a) CdTe@C@TiO2-Au nanowires, (b) CdTe@C@TiO2 nanowires and (c) pure TiO2
Figure 9
a) Degradation rate of RhB solution under different photocatalysts; (b) TOC removal rates under different photocatalysts after 270 min simulated sunlight illumination
(1) Pure TiO2, (2) CdTe@C@TiO2 and (3) CdTe@C@TiO2-Au nanowires
Figure 10
Kinetics of catalytic degradation of RhB under different photocatalysts of (a) CdTe@C@TiO2-Au nanowires, (b) CdTe@C@TiO2 nanowires and (c) pure TiO2



 下载:
下载:

 下载:
下载:



