Citation:
YANG Yong-Sheng, CHEN Bo-Yong, JU Hai-Yan, ZUO Fen, WANG Shi-Wei, LI Yu-Guang, YAN Shi-Ping. Two Binuclear Copper(Ⅱ) Complexes Containing 1, 4, 7-Trisbenzyl-1, 4, 7-triazacyclononane (Bn3tacn) Ligand:Syntheses, Characterization and Binding with DNA[J]. Chinese Journal of Inorganic Chemistry,
2017, 33(12): 2338-2344.
doi:
10.11862/CJIC.2017.262

含有1, 4, 7-三苄基-1, 4, 7-三氮杂环壬烷的两个双核铜配合物的合成、表征及其与DNA的相互作用
摘要:
合成了2个含有1,4,7-三苄基-1,4,7-三氮杂环壬烷(Bn3tacn)的双核铜配合物:[Cu2(Bn3tacn)2(m-bdc)(CH3CN)3(H2O)2]ClO4(1)和[Cu2(Bn3tacn)2(OH)2](ClO4)2(2)。配合物1由间苯二甲酸采取单双齿方式桥连Cu(Ⅱ)离子,配合物2由OH桥连。配合物1和2晶体均属于单斜晶系,分别为P21/c空间群和C2/c空间群。分别对2个配合物进行了红外光谱、紫外-可见光谱和元素分析表征。研究了配合物1与DNA的相互作用,对配合物2进行了循环伏安测试。
-
关键词:
- 双核铜配合物
- / 1, 4, 7-三氮杂环壬烷
- / DNA相互作用
English
Two Binuclear Copper(Ⅱ) Complexes Containing 1, 4, 7-Trisbenzyl-1, 4, 7-triazacyclononane (Bn3tacn) Ligand:Syntheses, Characterization and Binding with DNA
Abstract:
Two binuclear copper(Ⅱ) complexes were prepared with ligand 1, 4, 7-tribenzyl-1, 4, 7-triazacyclononane (Bn3tacn):[Cu2(Bn3tacn)2(m-bdc)(CH3CN)3(H2O)2]ClO4 (1) and[Cu2(Bn3tacn)2(OH)2](ClO4)2 (2). The copper(Ⅱ) ion in complex 1 is bridged by the m-benedicarboxylic acid (m-bdc) adopting bis(bidentate/monodentate) coordination type and is bridged by the μ-OH in complex 2. Complexes 1 and 2 crystalize in the monoclinic system, space group P21/c and C2/c, respectively. IR, UV-Vis, element analysis, binding with DNA properties of the complex 1 and cyclic voltammogram of complex 2 have been studied.
-
Key words:
- binuclear copper(Ⅱ)
- / 1, 4, 7-triazacyclonoane
- / binding with DNA
-
1, 4, 7-Triazacyclonone (tacn) and its derivatives have been progress a rapid expansion in the area of the coordination chemistry, and a stable and wide range of metal coordination compounds have been prepared as a result of the propensity of tacn for facial coordination with metal ions[1]. It has been extensively noted that tacn and its N-substituted complexes are suitable ligands forming both mono-and bi-metallic complexes.
Hence, many of tacn and its N-substituted complexes are found to be both structural and functional models of various metalloenzyme[2-8], capable of promoting phosphate ester degradation with DNA[9-13] or RNA[14-15] cleavage and used in oxidative catalysis[16]. 1, 4, 7-Tribenzyl-1, 4, 7-triazacyclononane (Bn3tacn), as one type of their derivative, has been investigated many years[17-19]. The central role of the binding and activation of dioxygen by copper ions with a wide range of important processes in biology and catalyst areas has led to intense interest in the synthesis, characterization, and examination of the reactivity of [Cu2O2] complexes[20]. Previously, we have reported the complexes with the same ligand[21] and another N-substituted ligand further compared their structures and spectra[22-23]. Similar ligands were also reported recently[24-25]. In this work, we prepared two binuclear copper complexes containing the ligand Bn3tacn using m-bdc (1, 4-benzenedi-carboxylic) and H2O as bridged ligand: [Cu2(Bn3tacn)2(m-bdc)(CH3CN)3(H2O)2]ClO4 (1) and [Cu2(Bn3tacn)2(OH)2](ClO4)2 (2) (L=Bn3tacn); the syntheses, structures, spectroscopic properties and DNA binding properties will be described here.
1 Experimental
1.1 Materials and instrument
1, 4, 7-Triazacyclononane (tacn) was prepared according to the previous procedure[26-27] and the ligand Bn3tacn was prepared according to the literature[28]. All starting materials and solvents are analytical reagents.
Elemental analyses of C, H and N were carried out on Model 240 Perkin-Elemer instrument. IR spectra were measured using KBr disks with Bruker Tensor 27 FTIR spectrophotometer in the 400~4 000 cm-1 region. The UV-Vis spectra were measured on Jasci V-570 UV-Vis spectrophotometer within 200~2 000 nm region.
1.2 Syntheses of the complexes
[Cu2(Bn3tacn)2(m-bdc)(CH3CN)3(H2O)2]ClO4 (1). A solution of Cu(ClO4)2·6H2O (0.111 g, 0.3 mmol) in acetonitrile (10 mL) was added to a solution of Bn3tacn(0.024 g, 0.3 mmol) in acetonitrile (10 mL). The reaction mixture was stirred at room temperature for 30 min until all of the solid dissolved to afford a clear deep-blue solution, and then a solution of m-bdc piperidine hydrochloride(0.043 g, 0.15 mmol) disso-lved in water (5 mL) was slowly added to the previous solution. The reaction mixture was continuously stirred for 2 h, filtered to get rid of any insoluble particles. The light yellow rhombic crystals suitable for X-ray crystallographic analysis were obtained by slow evaporation of the filtrate (Yield: 63%). Anal. Calcd. for C65H76Cl2Cu2N8O12(%): C 57.43, H 5.64, N 8.24; Found(%): C 57.40, H 5.62, N 8.21.
[Cu2(Bn3tacn)2(OH)2](ClO4)2 (2). A suspension of Cu(ClO4)2·6H2O (0.111 g, 0.3 mmol) and the ligand Bn3tacn(0.024 g, 0.3 mmol) in acetonitrile (20 mL) was stirred for 30 min to give a blue solution, and then the pH value was adjusted to 8.5 and the solution was filtered. The deep blue crystal was obtained after one week evaporation of the solvent, filtered off, washed with ethanol and ether, and dried under vacuum (Yield: 42%). Anal. Calcd. for C54H66Cl2Cu2N6O10(%): C 56.80, H 5.69, N 7.79; Found(%): C 56.88, H 5.70, N 7.80.
Caution! Although no problems were encoun-tered in this work, perchlorate complexes containing organic ligands are potentially explosive. They should be prepared in small quantities and handled with care.
1.3 X-ray crystallography
Diffraction data for 1 and 2 were collected at 293 K, with a Bruker SMART 1000 CCD diffractometer using Mo Kα radiation (λ=0.071 073 nm) with the φ-ω scan technique. An empirical absorption correction (SADABS) was applied to raw intensities[29]. The struc-tures were solved by direct methods (SHELXS-97[30]) and refined by full-matrix least-squares procedures on F2 using SHELXL-97[30], the structure of complex 2 was further solved by SQUEEZE software. According to the elimination electronics, relevant H2O solvent was eliminated. The hydrogen atoms were added theoretically, and riding on the concerned atoms and refined with fixed thermal factors. Further details about crystal data and structure refinement are summarized in Table 1.
 Table 1.
Crystal data and structure refinements for 1 and 2
Table 1.
Crystal data and structure refinements for 1 and 2
Complex 1 2 Empirical formula C66H76Cl2Cu2N8O12 C54H66Cl2Cu2N6O10 Formula weight 1 371.32 1 157.10 Temperature / K 153(2) 294(2) Crystal system Monoclinic Monoclinic Space group P21/c C2/c a / nm 1.028 41(16) 2.787 5(16) b / nm 3.307 9(3) 1.534 3(7) c / nm 1.116 61(18) 2.967 4(13) β/(°) 113.351(2) 91.978(13) V / nm3 3.487 5(9) 12.684(11) Z 2 8 Dc / (g·cm-3) 1.306 1.218 μ / mm-1 0.75 0.809 Crystal size / mm 0.16×0.14×0.10 0.26×0.18×0.16 θ range / (°) 2.08~27.85 1.52~25.02 Limiting indices -13 ≤ h ≤13, -41 ≤ k ≤42, -11 ≤ l ≤ 14 -33≤h≤ 18, -18 ≤ k ≤ 18, -35 ≤ l ≤ 35 Reflection collected, unique 26 745, 7 536 (Rint=0.018 1) 30 996, 11 052 (Rint=0.136 3) F(000) 1 432 4 832 Goodness-of-fit on F2 1.053 0.946 Final R indices [I>2σ(I)] R1=0.040 2, wR2=0.118 7 R1=0.081 4, wR2=0.256 2 R indices (all data) R1=0.047 7, wR2=0.115 2 R1=0.175 0, wR2=0.199 2 (Δρ)max, (Δρ)min / (e ·nm-3) 866, -640 757, -714 CCDC: 609919, 1; 611963, 2.
1.4 Procedure for DNA binding experiments
By the electronic absorption spectral method, the relative binding of the two complexes to calf thymus (CT) DNA was studied in 10 mmol·L-1 Tris-HCl/NaCl buffer (pH=7.5). The solution of CT-DNA gave a ratio of UV absorbance at 260 nm and 280 nm (A260 /A280) of 1.8~1.9, indicating that the DNA was sufficiently free of protein[31]. The stock solution of CT-DNA was prepared in Tris-HCl/NaCl buffer, pH=7.5 (stored at 4 ℃ and used not more than 4 days). The concentration of CT-DNA was determined from its absorption intensity at 260 nm with a molar extinction coefficient of 6 600 L·mol-1·cm-1 [32].
2 Results and discussion
2.1 Crystal structure description
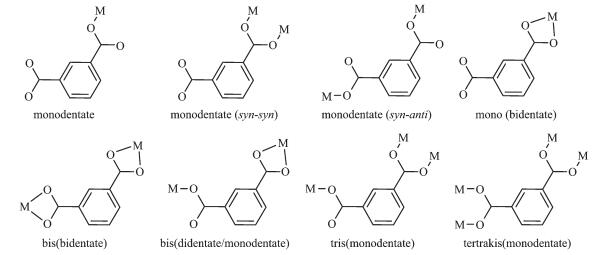
Selected bond lengths and angles of 1 and 2 are listed in Table 2. The structure of complex 1 is shown in Fig. 1a. One Cu ion was five coordinated by three N atoms from ligand Bn3tacn and two O atoms from m-bdc ligand while the other Cu ion was five coordinated by three N atoms from ligand Bn3tacn, one O atom from m-bdc ligand and the other O atom from H2O. As shown in Scheme 1, complex 1 adopts an unusual bis(bidentate/monodentate) coordination type due to the steric hindrance. The intermolecular distance of the two Cu(Ⅱ) ions is 1.004 3 nm. Three benzyl groups are flatted opposite the m-bdc ligand, which favor atom N coordinating to copper ion. The length of Cu(1)-N(1) is 0.219 17 nm, which is slightly longer than the length of Cu(1)-N(2) of 0.201 97 nm, Cu(1)-N(3) of 0.203 75 nm, Cu(1)-O(1) of 0.200 63 nm and Cu(1)-O(2) of 0.195 91 nm as show in Fig. 1a.
Table 2.
Selected bond lengths (nm) and angles (°) for 1 and 2
1 Cu(1)-O(2) 0.195 9(11) Cu(1)-O(4) 0.204 7(10) Cu(1)-O(1) 0.200 6(3) Cu(1)-N(1) 0.219 17(19) Cu(1)-N(2) 0.201 96(19) Cu(1)-N(3) 0.203 74(19) O(2)-Cu(1)-O(1) 70.69(18) N(2)-Cu(1)-N(1) 86.22(7) O(2)-Cu(1)-N(2) 101.67(17) O(2)-Cu(1)-C(28) 33.9(2) O(1)-Cu(1)-N(2) 168.78(11) O(1)-Cu(1)-C(28) 36.75(15) O(2)-Cu(1)-N(3) 167.2(2) N(2)-Cu(1)-C(28) 135.09(14) O(1)-Cu(1)-N(3) 99.35(11) N(3)-Cu(1)-C(28) 135.56(13) N(2)-Cu(1)-N(3) 86.9O(7) O(4)-Cu(1)-C(28) 47.5(2) O(2)-Cu(1)-O(4) 13.6(2) N(3)-Cu(1)-C(28) 46.8(2) O(1)-Cu(1)-O(4) 84.2(2) N(1)-Cu(1)-C(28) 106.76(13) N(2)-Cu(1)-O(4) 88.48(19) N(2)-Cu(1)-N(1) 86.22(7) N(3)-Cu(1)-O(4) 172.1(3) N(3)-Cu(1)-N(1) 86.33(7) O(2)-Cu(1)-N(1) 103.6(3) O(4)-Cu(1)-N(1) 99.7(3) O(1)-Cu(1)-N(1) 103.38(11) 2 Cu(1)-O(2) 0.196 5(5) Cu(1)-Cu(2) 0.295 7O(15) Cu(1)-O(1) 0.202 1(5) Cu(2)-O(2) 0.195 7(5) Cu(1)-N(3) 0.207 9(6) Cu(2)-O(1) 0.199 3(5) Cu(1)-N(1) 0.211 9(6) Cu(2)-N(4) 0.209 1(6) Cu(1)-N(2) 0.227 5(6) Cu(2)-N(6) 0.208 8(6) Cu(2)-N(5) 0.230 3(6) O(2)-Cu(2)-O(1) 81.3(2) O(2)-Cu(1)-N(3) 168.3(2) O(2)-Cu(2)-N(4) 96.4(2) O(1)-Cu(1)-N(3) 95.O(2) O(1)-Cu(2)-N(4) 174.2(2) O(2)-Cu(1)-N(1) 98.2(2) O(2)-Cu(2)-N(6) 168.O(2) O(1)-Cu(1)-N(1) 169.2(2) O(1)-Cu(2)-N(6) 96.O(2) N(3)-Cu(1)-N(1) 84.4(2) N(4)-Cu(2)-N(6) 85.2(2) O(2)-Cu(1)-N(2) 108.O(2) O(2)-Cu(2)-N(5) 108.5(2) O(1)-Cu(1)-N(2) 107.8(2) O(1)-Cu(2)-N(5) 102.9(2) N(3)-Cu(1)-N(2) 83.7(2) N(4)-Cu(2)-N(5) 82.9(2) N(1)-Cu(1)-N(2) 82.5(2) N(6)-Cu(2)-N(5) 83.5(2) O(2)-Cu(1)-Cu(2) 40.97(15) O(2)-Cu(2)-Cu(1) 41.18(14) O(1)-Cu(1)-Cu(2) 42.2O(15) O(1)-Cu(2)-Cu(1) 42.91(16) N(3)-Cu(1)-Cu(2) 130.78(16) N(4)-Cu(2)-Cu(1) 133.11(16) N(1)-Cu(1)-Cu(2) 132.71(16) N(6)-Cu(2)-Cu(1) 131.84(17) 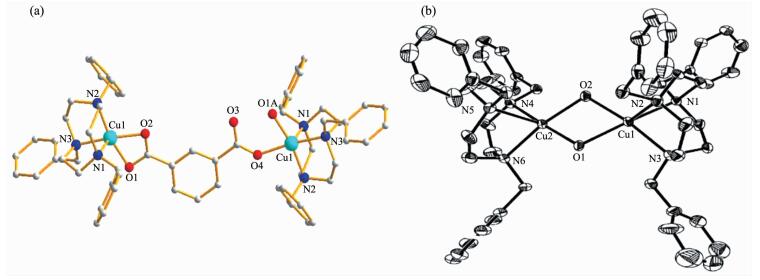 图1
(a) Molecular structure of complex 1; (b) Molecular structure of complex 2 with thermal ellipsoids at 30% probability level
Figure1.
(a) Molecular structure of complex 1; (b) Molecular structure of complex 2 with thermal ellipsoids at 30% probability level
图1
(a) Molecular structure of complex 1; (b) Molecular structure of complex 2 with thermal ellipsoids at 30% probability level
Figure1.
(a) Molecular structure of complex 1; (b) Molecular structure of complex 2 with thermal ellipsoids at 30% probability level
 图Scheme 1
Eight coordination mode of m-bdc
Scheme1.
Eight coordination mode of m-bdc
图Scheme 1
Eight coordination mode of m-bdc
Scheme1.
Eight coordination mode of m-bdc
As shown in Fig. 1b, the crystal structure is made up of [Cu2(Bn3tacn)2(μ-OH)2]2+ cation and ClO4- anions. The complex crystallizes in the monoclinic C2/c space group. An interesting feature of complex 2 is that the complex has a central [Cu2O2] coordination core where copper and hydroxo oxygen atom are alternate to each other, constituting a cyclic four-membered ring. Noteworthily, the Cu1-O1-Cu2-O2 bridging unit is not strictly coplanar, whereas a roof shape core as the complex have been reported[15] because of the hydrogen in H2O was adopted as syn-syn type. Cu1-O1-Cu2 angle is 94.91°, while the angle of Cu1-O2-Cu2 is 97.85°. The geometry around both Cu atoms can best be described as an axially elongated octahedron, with the atoms N1, N2, N3, O2 constituting the basal plane and the atom O1 occupying the axial position. The essential similarity of the two independent bridging Cu-O bond lengths of 0.195 7 and 0.199 3 nm demon-strates that the oxygen atoms are asymmetrically bound to the two copper atoms. The length of Cu-Cu is 0.295 7 nm.
2.2 IR and UV-Vis spectrum
Both the two complexes have the similar IR spectra. The broad peak at 3 600~3 300 cm-1 should be attributed to the ν(O-H) stretching frequency of water molecule in the complexes. The ν(C-H) stretching frequency of Bn3tacn is indicated by a shoulder band involving a split sharp peak at 2 980 and 2 850 cm-1. Two moderate absorption, at 1 593 and 1 548 cm-1, are ascribed to the characteristic absorption of C=O in the m-bdc. The peak at 1 121 and 625 cm-1 should be the absorption of ClO4-. Additionally, the abundant of absorption peaks in the region of 670~840 cm-1 strongly argues in favor of the presence of phenyl. All of these results are quite consistent with the crystal structures of complexes 1 and 2.
The UV-Vis spectra of complexes 1 and 2 were tested in dissolving DMSO solvent at room temperature. The wide absorption band in 656 nm was attributed to the 2B1→2B2 electronic transformation of Cu2+ in the tetragonal pyramid C4 confirmation of complex 1[33]. The absorption of 300 nm was attributed to the charges transfer of ligand Bn3tacn in complex 2, while the absorption at 656 nm was also observed due to 2B1→2B2 electronic transformation of Cu2+ (3d9) with symmetric C4 coordination environments[34].
2.3 DNA binding
In order to investigate whether DNA was the biological target of the complex, its interactions with calf thymus DNA (CT-DNA) were tested by UV-Vis, Fluorescence spectroscopy. The absorption spectra of the complex 1 in the absence and presence of CT-DNA at various concentrations are given in Fig. 2. Free Bn3tacn does not have any absorption band in the ultraviolet region because of the high energy gap between LUMO and HOMO. However, copper binding lowered the gap and thus caused the transition occurring at 256 nm. The potential CT-DNA binding ability of complexes was studied by UV spectroscopy by following the intensity changes of the intraligand π-π* transition band at 256 nm. Upon addition of an increasing amount of CT-DNA (from 1×10⁻⁵ to 1×10⁻⁴ mol·L-1) to the complex 1 (1×10⁻⁵ mol·L-1), a 20% hypochromism and a slight red shift (7~12 nm) were observed, which indicate strong binding of the complex to DNA.
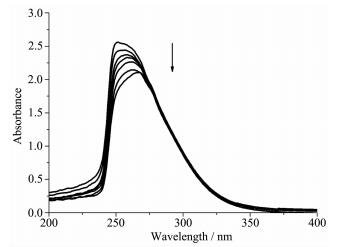 图2
UV-Vis absorption spectra of the complex in mixed solution of CH3CN and buffer with increasing concentration of CT-DNA
Figure2.
UV-Vis absorption spectra of the complex in mixed solution of CH3CN and buffer with increasing concentration of CT-DNA
图2
UV-Vis absorption spectra of the complex in mixed solution of CH3CN and buffer with increasing concentration of CT-DNA
Figure2.
UV-Vis absorption spectra of the complex in mixed solution of CH3CN and buffer with increasing concentration of CT-DNA
The DNA-EB system was used to further probe the DNA binding mode of the complex 1. Ethidium bromide (EB) is an intercalator that gives a significant increase in fluorescence emission when bound to DNA and its displacement from DNA results in decrease in fluorescence intensity[35]. Fluorescence titration spectra are shown in Fig. 3. The emission intensity decreased with the increase of the concentration of the complex, which suggests that the complex can replace EB from CT-DNA and intercalate into the DNA double helix.
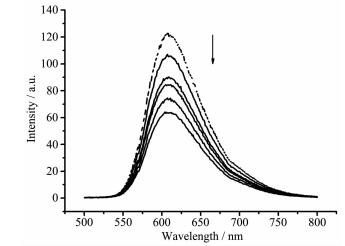 图3
Fluorescence emission spectra of the EB-DNA system in the absence (dotted line) and presence (solid line) of 1
Figure3.
Fluorescence emission spectra of the EB-DNA system in the absence (dotted line) and presence (solid line) of 1
图3
Fluorescence emission spectra of the EB-DNA system in the absence (dotted line) and presence (solid line) of 1
Figure3.
Fluorescence emission spectra of the EB-DNA system in the absence (dotted line) and presence (solid line) of 1
2.4 Cyclic voltammetry
As shown in Fig. 4, the cyclic voltammogram of the ternary complex in absolute chromatographic DMSO solution containing 0.1 mol·L-1 [(n-Bu)4N]ClO4 (Scan speed: 100 mV·s-1) shows the ternary complex is redox-active. The cathodic peak potential (Epc) and the anodic peak potential (Epa) are 1 080 and 186 mV, respectively. The separation of the anodic and cathodic peak potentials (ΔEp) is 894 mV.
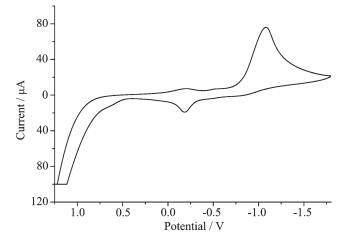 图4
Cyclic voltammogram diagram of the complex 2 in DMSO
Figure4.
Cyclic voltammogram diagram of the complex 2 in DMSO
图4
Cyclic voltammogram diagram of the complex 2 in DMSO
Figure4.
Cyclic voltammogram diagram of the complex 2 in DMSO
-
-
[1]
Chaudhuri P, Wieghardt K. Prog. Inorg. Chem., 1987, 35:329-436 doi: 10.1002/SERIES2229
-
[2]
Bossek U, Hummel H, Weyhermüller T, et al. Angew. Chem. Int. Ed., 1995, 34:2642-2645
-
[3]
Chin J. Acc. Chem. Res., 1991, 24:145-152 doi: 10.1021/ar00005a004
-
[4]
Williams N H, Takasaki B K, Wall M, et al. Acc. Chem. Res., 1999, 32:485-493 doi: 10.1021/ar9500877
-
[5]
Hegg E L, Burstyn J N. Coord. Chem. Rev., 1998, 173:133-165 doi: 10.1016/S0010-8545(98)00157-X
-
[6]
Tolman W B. Acc. Chem. Res., 1997, 30:227-237 doi: 10.1021/ar960052m
-
[7]
Yan H L, Yan S P, Liao D Z, et al. J. Coord. Chem., 2006, 59:493-498 doi: 10.1080/00958970500358524
-
[8]
Chen X Y, Xia J, Zhao B, et al. J. Coord. Chem., 2004, 57:231-237 doi: 10.1080/00958970410001671237
-
[9]
Bim D, Svobodova E, Eigner V, et al. Chem. Eur. J., 2016, 22:10426-10437 doi: 10.1002/chem.201601175
-
[10]
Tjioe L, Joshi T, Forsyth C M, et al. Inorg. Chem., 2012, 51:939-953 doi: 10.1021/ic2019814
-
[11]
Longford D, Campi E, Sawford T, et al. Biotechnol. J., 2015, 10:480-489 doi: 10.1002/biot.v10.3
-
[12]
Deal K A, Hengge A C, Burstyn J N, et al. J. Am. Chem. Soc., 1996, 118:1713-1718 doi: 10.1021/ja952306p
-
[13]
Hirohama T, Arii H, Chikira M, et al. J. Inorg. Biochem., 2004, 98:1778-1786 doi: 10.1016/j.jinorgbio.2004.07.014
-
[14]
Zeng Z, Torriero A A J, Bond A M, et al. Chem Eur. J., 2010, 16:9154-9163 doi: 10.1002/chem.v16:30
-
[15]
Belousoff M J, Duriska M B, Graham B, et al. Inorg. Chem., 2006, 45:3746-3755 doi: 10.1021/ic051983+
-
[16]
Sibbons K F, Shastri K, Watkinson M, et al. Dalton Trans., 2006, 5:645-661
-
[17]
Enomoto M, Aida T, et al. J. Am. Chem. Soc., 1999, 121:874-875 doi: 10.1021/ja982282x
-
[18]
Mahapatra S, Halfen J, Wilkinson A E C, et al. J. Am. Chem. Soc., 1996, 118:11555-11574 doi: 10.1021/ja962305c
-
[19]
Mahapatra S, Halfen J A, Tolman W B, et al. J. Am. Chem. Soc., 1996, 118:11575-11586 doi: 10.1021/ja962304k
-
[20]
Kitajima N, Moro-oka Y, et al. Chem. Rev., 1994, 94:737-758 doi: 10.1021/cr00027a010
-
[21]
Yang Y S, Gu W, Qiang J, et al. J. Coord. Chem., 2007, 60:1681-1690 doi: 10.1080/00958970601108067
-
[22]
Yang Y S, Gu W, Zhang L Z, et al. J. Coord. Chem., 2007, 60:1913-1921 doi: 10.1080/00958970701209880
-
[23]
Yang Y S, Gu W, Zhang L Z, et al. J. Coord. Chem., 2008, 61:571-578 doi: 10.1080/00958970701364842
-
[24]
李秀敏, 杨雨, 张宗尧, 等.无机化学学报, 2017, 33(7):1299-1304 doi: 10.11862/CJIC.2017.144LI Xiu-Min, YANG Yu, ZHANG Zong-Yao, et al. Chinese J. Inorg. Chem., 2017, 33(7):1299-1304 doi: 10.11862/CJIC.2017.144
-
[25]
李庆祥, 向爱华, 孟祥高, 等.无机化学学报, 2013, 29(7):1428-1432 http://www.wjhxxb.cn/wjhxxbcn/ch/reader/view_abstract.aspx?flag=1&file_no=20130714&journal_id=wjhxxbcnLI Qing-Xiang, XIANG Ai-Hua, MENG Xiang-Gao, et al. Chinese J. Inorg. Chem., 2013, 29(7):1428-1432 http://www.wjhxxb.cn/wjhxxbcn/ch/reader/view_abstract.aspx?flag=1&file_no=20130714&journal_id=wjhxxbcn
-
[26]
Richman J E, Atkins T J, et al. J. Am. Chem. Soc., 1974, 96:2268-2271 doi: 10.1021/ja00814a056
-
[27]
Wieghardt K, Hahn M, Swiridoff W, et al. Inorg. Chem., 1984, 23:94-99 doi: 10.1021/ic00169a020
-
[28]
Beissel T, Beatriz S P, Vedova D, et al. Inorg. Chem., 1990, 29:1736-1741 doi: 10.1021/ic00334a029
-
[29]
Sheldrick G M. SADABS, Program for Empirical Absorption Correction of Area Detector Data, University of Göttingen, Germany, 1996.
-
[30]
Sheldrick G M. SHELX-97, Program for the Solution and the Refinement of Crystal Structures, University of Göttingen, Germany, 1997.
-
[31]
Kumar C V, Barton J K, Turro N J, et al. J. Am. Chem. Soc., 1985, 107:5518-5523 doi: 10.1021/ja00305a032
-
[32]
Marmur J. J. Mol. Biol., 1961, 3:208-218 doi: 10.1016/S0022-2836(61)80047-8
-
[33]
Hathaway B J. Struct. Bond., 1984, 57:55-118 doi: 10.1007/BFb0111452
-
[34]
Ballhausen C J. Introduction to Ligand Field Theory. New York:McGraw-Hill, 1962.
-
[35]
Reichmann M E, Rice S A, Thomas C A, et al. J. Am. Chem. Soc., 1954, 76:3047-3053 doi: 10.1021/ja01640a067
-
[1]
-

Figure 1 (a) Molecular structure of complex 1; (b) Molecular structure of complex 2 with thermal ellipsoids at 30% probability level
Hydrogen atoms have been omitted for clarity in (a); Hydrogen atoms, ClO4- and H2O have been omitted for clarity in (b)

Figure 2 UV-Vis absorption spectra of the complex in mixed solution of CH3CN and buffer with increasing concentration of CT-DNA
Buffer=10 mmol·L-1 tris, 1 mmol·L-1 Na2EDTA, pH=7.50; VCH3CN:Vbuffer=1:3; ccomplex=2.0 ×10⁻⁵ mol·L-1, r=cCT-DNA/ccomplex= 0~0.6

Figure 3 Fluorescence emission spectra of the EB-DNA system in the absence (dotted line) and presence (solid line) of 1
λex=526 nm; cEB=2.5×10⁻⁵ mol·L-1, cDNA=1×10⁻⁴ mol·L-1; c1=1×10⁻⁴ mol·L-1, 10 μL per scan
Table 1. Crystal data and structure refinements for 1 and 2
Complex 1 2 Empirical formula C66H76Cl2Cu2N8O12 C54H66Cl2Cu2N6O10 Formula weight 1 371.32 1 157.10 Temperature / K 153(2) 294(2) Crystal system Monoclinic Monoclinic Space group P21/c C2/c a / nm 1.028 41(16) 2.787 5(16) b / nm 3.307 9(3) 1.534 3(7) c / nm 1.116 61(18) 2.967 4(13) β/(°) 113.351(2) 91.978(13) V / nm3 3.487 5(9) 12.684(11) Z 2 8 Dc / (g·cm-3) 1.306 1.218 μ / mm-1 0.75 0.809 Crystal size / mm 0.16×0.14×0.10 0.26×0.18×0.16 θ range / (°) 2.08~27.85 1.52~25.02 Limiting indices -13 ≤ h ≤13, -41 ≤ k ≤42, -11 ≤ l ≤ 14 -33≤h≤ 18, -18 ≤ k ≤ 18, -35 ≤ l ≤ 35 Reflection collected, unique 26 745, 7 536 (Rint=0.018 1) 30 996, 11 052 (Rint=0.136 3) F(000) 1 432 4 832 Goodness-of-fit on F2 1.053 0.946 Final R indices [I>2σ(I)] R1=0.040 2, wR2=0.118 7 R1=0.081 4, wR2=0.256 2 R indices (all data) R1=0.047 7, wR2=0.115 2 R1=0.175 0, wR2=0.199 2 (Δρ)max, (Δρ)min / (e ·nm-3) 866, -640 757, -714  下载: 导出CSV
Table 2. Selected bond lengths (nm) and angles (°) for 1 and 2
1 Cu(1)-O(2) 0.195 9(11) Cu(1)-O(4) 0.204 7(10) Cu(1)-O(1) 0.200 6(3) Cu(1)-N(1) 0.219 17(19) Cu(1)-N(2) 0.201 96(19) Cu(1)-N(3) 0.203 74(19) O(2)-Cu(1)-O(1) 70.69(18) N(2)-Cu(1)-N(1) 86.22(7) O(2)-Cu(1)-N(2) 101.67(17) O(2)-Cu(1)-C(28) 33.9(2) O(1)-Cu(1)-N(2) 168.78(11) O(1)-Cu(1)-C(28) 36.75(15) O(2)-Cu(1)-N(3) 167.2(2) N(2)-Cu(1)-C(28) 135.09(14) O(1)-Cu(1)-N(3) 99.35(11) N(3)-Cu(1)-C(28) 135.56(13) N(2)-Cu(1)-N(3) 86.9O(7) O(4)-Cu(1)-C(28) 47.5(2) O(2)-Cu(1)-O(4) 13.6(2) N(3)-Cu(1)-C(28) 46.8(2) O(1)-Cu(1)-O(4) 84.2(2) N(1)-Cu(1)-C(28) 106.76(13) N(2)-Cu(1)-O(4) 88.48(19) N(2)-Cu(1)-N(1) 86.22(7) N(3)-Cu(1)-O(4) 172.1(3) N(3)-Cu(1)-N(1) 86.33(7) O(2)-Cu(1)-N(1) 103.6(3) O(4)-Cu(1)-N(1) 99.7(3) O(1)-Cu(1)-N(1) 103.38(11) 2 Cu(1)-O(2) 0.196 5(5) Cu(1)-Cu(2) 0.295 7O(15) Cu(1)-O(1) 0.202 1(5) Cu(2)-O(2) 0.195 7(5) Cu(1)-N(3) 0.207 9(6) Cu(2)-O(1) 0.199 3(5) Cu(1)-N(1) 0.211 9(6) Cu(2)-N(4) 0.209 1(6) Cu(1)-N(2) 0.227 5(6) Cu(2)-N(6) 0.208 8(6) Cu(2)-N(5) 0.230 3(6) O(2)-Cu(2)-O(1) 81.3(2) O(2)-Cu(1)-N(3) 168.3(2) O(2)-Cu(2)-N(4) 96.4(2) O(1)-Cu(1)-N(3) 95.O(2) O(1)-Cu(2)-N(4) 174.2(2) O(2)-Cu(1)-N(1) 98.2(2) O(2)-Cu(2)-N(6) 168.O(2) O(1)-Cu(1)-N(1) 169.2(2) O(1)-Cu(2)-N(6) 96.O(2) N(3)-Cu(1)-N(1) 84.4(2) N(4)-Cu(2)-N(6) 85.2(2) O(2)-Cu(1)-N(2) 108.O(2) O(2)-Cu(2)-N(5) 108.5(2) O(1)-Cu(1)-N(2) 107.8(2) O(1)-Cu(2)-N(5) 102.9(2) N(3)-Cu(1)-N(2) 83.7(2) N(4)-Cu(2)-N(5) 82.9(2) N(1)-Cu(1)-N(2) 82.5(2) N(6)-Cu(2)-N(5) 83.5(2) O(2)-Cu(1)-Cu(2) 40.97(15) O(2)-Cu(2)-Cu(1) 41.18(14) O(1)-Cu(1)-Cu(2) 42.2O(15) O(1)-Cu(2)-Cu(1) 42.91(16) N(3)-Cu(1)-Cu(2) 130.78(16) N(4)-Cu(2)-Cu(1) 133.11(16) N(1)-Cu(1)-Cu(2) 132.71(16) N(6)-Cu(2)-Cu(1) 131.84(17)
下载: 导出CSV
-


 扫一扫看文章
计量
- PDF下载量: 3
- 文章访问数: 1629
- HTML全文浏览量: 62
 下载:
下载:
