 图Scheme1
Preparation routes of RE(TPB)3Bath
Scheme1.
Preparation routes of RE(TPB)3Bath
图Scheme1
Preparation routes of RE(TPB)3Bath
Scheme1.
Preparation routes of RE(TPB)3Bath
Citation:
ZHANG Qing-Rui, DENG Rui-Ping, LIU Ying-Bo, ZHOU Liang, ZHANG Hong-Jie. Near Infrared Luminescence Properties of the Complexes of ErxYb1-x(TPB)3Bath (x=0, 0.218, 0.799, 0.896, 0.987, 1)[J]. Chinese Journal of Inorganic Chemistry,
2017, 33(11): 2011-2016.
doi:
10.11862/CJIC.2017.254

ErxYb1-x(TPB)3Bath(x=0,0.218,0.799,0.896,0.987,1)配合物的近红外发光性能
English
Near Infrared Luminescence Properties of the Complexes of ErxYb1-x(TPB)3Bath (x=0, 0.218, 0.799, 0.896, 0.987, 1)
Abstract:
A series of near infrared (NIR) luminescent complexes based on ErxYb1-x(TPB)3Bath (where TPB=4, 4, 4-tri-fluoro-1-phenyl-1, 3-butanedione, Bath=4, 7-diphenyl-1, 10-phenanthroline, x=0, 0.218, 0.799, 0.896, 0.987, 1, respectively) were prepared by selecting TPB and Bath as the first and second ligands, respectively. Luminescence properties of these complexes were investigated in detail. All these complexes exhibit the characteristic emission of the Yb3+ and/or Er3+ ion in the NIR region, and the emission intensity of Er3+ ion can be enhanced by modulating the nEr/nYb, which is related to the energy transfer from Yb3+ to Er3+ ions.
-
Key words:
- rare earth complex
- / near infrared luminescence
- / energy transfer
-
0 Introduction
Rare earth (RE) complexes are the most promising luminescent materials with appealing features, such as large stock shift, sharp emission bands, long lifetimes, and high quantum efficiency, etc., which render them potential applications in the fields of bio-imaging, laser systems, optical amplification, organic light-emitting diodes, and pressure/disorder sensors[1-9], etc. Among rare earth complexes, the near infrared emitting complexes, such as Yb3+, Er3+, Nd3+, Ho3+, Pr3+ complexes, etc., have been intensely studied in the past decades[10-15]. There are two particular driving forces for these researches: one is the rapid development of telecommunication networks; the other is the vivo sensing and imaging in bio-applications[16]. Er3+-based materials play a special role in telecommunication technologies since they emit characteristic emission at ~1.55 μm (0.8 eV), thus covering a spectroscopic window in which glass optical fibers show high transparency (the so-called third-communication window)[17]. The organic erbium complexes have also attracted ever-increasing intention in recent years due to their advantages of easy processing and flexible molecular design, etc., compared with their inorganic glass fibers counterparts[18]. But for practical application in the fields of telecommunication, optical communication systems, or optical amplifiers, the NIR yield and efficiency of the organic RE complexes should still be improved enormously.
Because of their small energy gaps between the emissive states and the ground states, the NIR luminescent Re3+ ions usually suffer the problem of quenching from many phonon-related nonradiative processes, especially the vibrations of the C-H, N-H and O-H bonds in the organic complexes[19-20]. To achieve high yield of NIR emission, one of the strategies is to use heavy atoms to replace the H atom in the ligands, and fluorination is a beneficial method[19-20]. Another drawback of the RE-based NIR emitting complexes is the pervasive energy mismatch between the ligands and the center ions. For most RE complexes, their absorption or excitation bands locate mainly in ultraviolet region, which means that the excited states energy levels of ligands are much higher than the RE NIR emitting levels, thus giving rise to inefficient energy transfer from the ligand to the center ion, and therefore the unsatisfactory NIR quantum efficiency[21]. In the past decade, many groups have devoted to designing and synthesizing novel RE complexes with low exciting energy levels, such as large conjugated systems, heterometallic complexes, etc. Among them, d-f block complexes are feasible choices, in which long-lived 3MLCT states of d-f transition metals (e.g. Ru2+, Re+, Os2+, Au+, Pt2+, Ir3+) can be excited by visible light and transfer efficiently their energy onto the 4fn manifolds, thus providing an efficient pathway for energy migration within heterometallic complexes[7, 21-23]. Mixed RE complexes, which have Re3+/Re3+ couples and possible mutual energy transfer, are another useful approach to enhance the expected NIR yield[24-27]. Yb3+ ion is usually a prime candidate of the sensitizer to be chosen due to its high luminescent efficiency and relatively simple electronic structure of two energy level manifolds: the 2F7/2 ground state and 2F5/2 excited state around at 10 000 cm-1 in the NIR region, especially for the Er3+ complexes. Thanks to the energy match between the 4I11/2 level of Er3+ and the 2F5/2 level of Yb3+, the energy transfer between excited state Yb3+ ion and ground state Er3+ ion can occur resonantly. This process is very efficient since the absorption cross section of Yb3+ (about 10-20 cm2) is one order of magnitude higher than that of Er3+ (about 10-21 cm2)[28]. In this case, the Yb3+ ion functions as the bridge between ligands and Er3+ ion, thus enhancing the emission intensity of Er3+.
Herein we synthesized erbium and ytterbium complexes using fluorinated ligand TPB and large conjugated ligand Bath as the first and the second ligands, respectively. In addition, the mixed complexes ErxYb1-x(TFB)3Bath (x=0.218, 0.799, 0.896, and 0.987, respectively) were also prepared aiming to improve the Er3+ emission intensity. Photoluminescence properties of the as-prepared complexes were investigated in detail, and the experimental results reveal that all the complexes exhibit the characteristic transition of the Er3+ and/or Yb3+ ion. In the Er3+-Yb3+ mixed systems, the emission intensity of Er3+ ion can be enhanced by modulating the nEr/nYb to facilitate the energy transfer from Yb3+ to Er3+ ion.
1 Experimental
1.1 Materials and instruments
Ytterbium(Ⅲ) nitrate pentahydrate (99.9%), and erbium(Ⅲ) nitrate pentahydrate (99.9%), 4, 4, 4-trifluoro-1-phenyl-1, 3-butanedione (99.9%), 4, 7-diphenyl-1, 10-phenanthroline (98%) were obtained commercially from Aladdin company and used as received without further purification. Excitation and emission spectra were measured with an Edinburgh FLSP 920 fluorescence spectrophotometer. The Er3+ and Yb3+ ion contents were measured by Thermo iCAP6300 ICP-OES.
1.2 Preparation of Er(TPB)3Bath
0.648 g (3 mmol) TPB and 0.332 g (1 mmol) Bath were dissolved in 15 mL ethanol, and NaOH aqueous (1 mmol·L-1) was added into it under stirring and heating to adjust the pH value to 6~8. Then, the solution of 0.449 g Er(NO3)3·5H2O (1 mmol) in 10 mL ethanol was dropped into the above solution. A lot of precipitates appeared. The reaction was kept under reflux for 3 h. After that, the precipitates were filtered and washed by de-ionized water and ethanol for several times, respectively. Finally, the precipitates were dried and recrystallized with acetone/ethanol mixed solvent, and the resulted products were dried at 80 ℃ under vacuum. Yield: 0.78 g (68%).
1.3 Preparation of Yb(TPB)3Bath
The same procedure as that of Er(TPB)3Bath. Yield: 76%.
1.4 Preparation of ErxYb1-x(TPB)3Bath
The same procedure as that of Er(TPB)3Bath, but herein the Er(NO3)3/Yb(NO3)3 mixed solution with different nEr/nYb, instead of pure Er(NO3)3 or Yb(NO3)3, was added.
Er0.218Yb0.782(TPB)3Bath: 0.2 mmol Er(NO3)3+0.8 mmol Yb(NO3)3 was added. Yield: 65%. Elemental analysis: Er: 28 540 μg·g-1, Yb: 106 200 μg·g-1.
Er0.896Yb0.104(TPB)3Bath: 0.5 mmol Er(NO3)3+0.5 mmol Yb(NO3)3 was added. Yield: 72%. Elemental analysis: Er: 88 020 μg·g-1, Yb:11 300 μg·g-1.
Er0.799Yb0.201(TPB)3Bath: 0.8 mmol Er(NO3)3+0.2 mmol Yb(NO3)3 was added. Yield: 70%. Elemental analysis: Er: 137 800 μg·g-1, Yb: 2 036 μg·g-1.
Er0.987Yb0.013(TPB)3Bath: 0.9 mmol Er(NO3)3+0.1 mmol Yb(NO3)3 was added. Yield: 66%. Elemental analysis: Er: 155 300 μg·g-1, Yb:11 300 μg·g-1.
2 Results and discussion
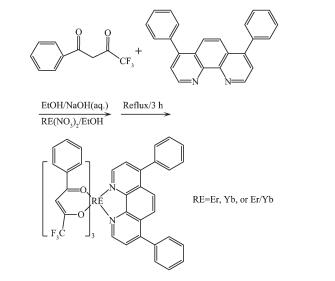
The preparation routes of these complexes are shown in Scheme 1.
图Scheme1
Preparation routes of RE(TPB)3Bath
Scheme1.
Preparation routes of RE(TPB)3Bath
The mixed complexes ErxYb1-x(TPB)3Bath were synthesized by using the Er(NO3)3/Yb(NO3)3 mixed solution with different nEr/nYb as the rare earth sources. The actual Er3+ and Yb3+ content in the as-prepared complexes were detected by means of ICP. And the mixed ErxYb1-x(TPB)3Bath complexes were denoted by the detected results, as shown in Table 1.
 Table 1.
Raw and detected nEr/nYb for the mixed complexes ErxYb1-x(TPB)3Bath
Table 1.
Raw and detected nEr/nYb for the mixed complexes ErxYb1-x(TPB)3Bath
Raw nEr/nYb Detected nEr/nYba Resulted complexes CEr/(μg·g-1) CYb/(μg·g-1) nEr/nYb 2/8 28 540 106 200 0.218/0.782 Er0.218Yb0.782(TPB)3Bath 5/5 88 020 11 300 0.896/0.104 Er0.896Yb0.104(TPB)3Bath 8/2 137 800 35 860 0.799/0.201 Er0.799Yb0.201(TPB)3Bath 9/1 155 300 2 036 0.987/0.013 Er0.987Yb0.013(TPB)3Bath aDetected nEr/nYb is resulted from: (CEr/MEr)/(CYb/MYb), where CEr and CEr denote the detected contents of Er3+ and Yb3+ ion, MEr and MYb is the atomic weight of the Er3+ and Yb3+ ion, respectively. The photoluminescence properties of the Er(TPB)3Bath and Yb(TPB)3Bath were investigated firstly. Fig. 1 shows the excitation and emission spectra of Er(TPB)3Bath and Yb(TPB)3Bath. There are three obvious bands in the excitation spectrum of Er(TPB)3Bath, locating at 374, 463 and 520 nm, respectively. The strongest one at 374 nm can be ascribed to the π-π* transition of the ligands. And the band at 463 nm can be ascribed to the additive contribution from the ligands and the transition of 4I15/2→4H7/2 from Er3+ ion[26]. The sharp peak at 520 nm can be contributed to the transition of 4I15/2→2H11/2[26, 29]. As depicted in its emission spectrum, the Er(TPB)3Bath complex emit its characteristic emission peaked at 1 530 nm, which is originated from the 4I13/2→4I15/2 transition of Er3+ ion.
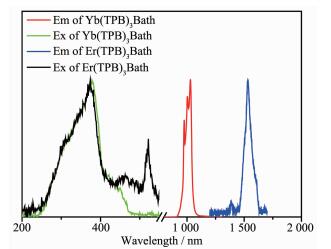 图1
Excitation (Ex) and emission (Em) spectra of Er(TPB)3Bath and Yb(TPB)3Bath
Figure1.
Excitation (Ex) and emission (Em) spectra of Er(TPB)3Bath and Yb(TPB)3Bath
图1
Excitation (Ex) and emission (Em) spectra of Er(TPB)3Bath and Yb(TPB)3Bath
Figure1.
Excitation (Ex) and emission (Em) spectra of Er(TPB)3Bath and Yb(TPB)3Bath
The Yb(TPB)3Bath exhibit similar excitation spectrum with that of Er(TPB)3Bath, locating mainly at 378 nm with a shoulder band at about 445 nm, which can be ascribed to the contribution of ligands. However, the transition of the Yb3+ ion is not observed in the excitation spectrum, which is rational because the Yb3+ ion owns only one possible transition between its ground state and excited state locates in the NIR transition. As shown in Fig. 1, the Yb(TPB)3Bath complex shows a emission band in NIR region, split into three peaks at 976, 1 005 and 1 031 nm, respectively, which is related with the coordination field effect of the ligands[30-32].
To enhance the emission yield of the Er3+ ion, we prepared a series of mixed ErxYb1-x(TPB)3Bath (x=0.218, 0.799, 0.896, and 0.987, respectively) complexes because the presence of Yb3+ was expected to facilitate the energy transfer from ligands to Er3+ ions. The photoluminescence properties of these complexes were investigated. For better comparison, all the emission spectra were measured under the same conditions. Firstly, we investigate the effect of excitation source (374 or 378 nm) on the emission spectra, and the experimental results show that 378 nm excitation source causes slightly higher emission intensities of both Yb3+ and Er3+ ions than that from 374 nm source. Fig. 2 compares the emission spectra of complexes Er0.896Yb0.104(TPB)3Bath and Er0.218Yb0.782(TPB)3Bath under the excitation of 374 and 378 nm, respectively.
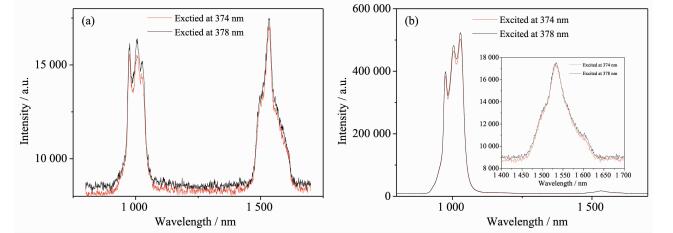 图2
Emission spectra of (a) Er0.896Yb0.104(TPB)3Bath and (b) Er0.218Yb0.782(TPB)3Bath
Figure2.
Emission spectra of (a) Er0.896Yb0.104(TPB)3Bath and (b) Er0.218Yb0.782(TPB)3Bath
图2
Emission spectra of (a) Er0.896Yb0.104(TPB)3Bath and (b) Er0.218Yb0.782(TPB)3Bath
Figure2.
Emission spectra of (a) Er0.896Yb0.104(TPB)3Bath and (b) Er0.218Yb0.782(TPB)3Bath
What should be noted is the possible energy transfer from Yb3+ to Er3+ ion. As mentioned above, the 378 nm excitation source corresponds to the maximum excitation of the obtained Yb3+ complex. Compared with Er3+ ion, the Yb3+ ion possesses wider absorption cross section, which is helpful in harvesting the energy from ligands. In this case, part excited energy of Yb3+ ion would be transferred to the Er3+ ion, thus enhancing the emission of Er3+ ion. So, the enhanced Er3+ emission can be interpreted as the improved energy transfer from Yb3+ to Er3+ ion.
The energy transfer between Yb3+/Er3+ ions and the enhancement of Er3+ emission were found to be more obvious by comparing the emission spectra of the mixed ErxYb1-x(TPB)3Bath (x=0.218, 0.799, 0.896, and 0.987, respectively) complexes with that of the pure Er(TPB)3Bath complex. Under excitation at 378 nm, the emission intensity of the ErxYb1-x(TPB)3Bath varied with different nEr/nYb (Fig. 3). Fig. 3a depicts the emission spectra of the ErxYb1-x(TPB)3Bath (x=0.218, 0.799, 0.896, and 0.987, respectively) complexes and Er(TPB)3Bath. It could be found that the emission intensity of Yb3+ ion (Em-Yb) is dominated in the cases of x=0.218 and 0.799, while Em-Yb and the emission intensity of Er3+ ion (Em-Er) is comparable when x=0.896 (Fig. 2a).
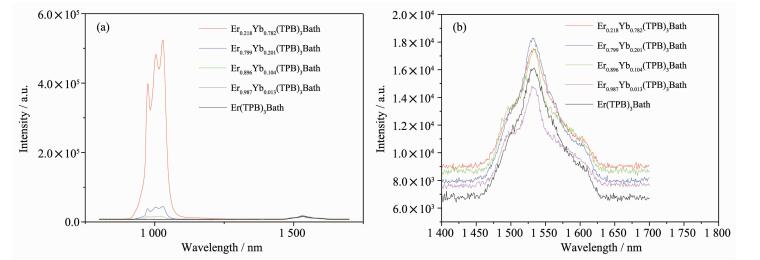 图3
Emission spectra of the ErxYb1-x(TPB)3Bath (x=0.218, 0.799, 0.896, 0.987, 1, respectively) excited at 378 nm (a) whole emission spectra and (b) emission spectra of the Er3+ ion
Figure3.
Emission spectra of the ErxYb1-x(TPB)3Bath (x=0.218, 0.799, 0.896, 0.987, 1, respectively) excited at 378 nm (a) whole emission spectra and (b) emission spectra of the Er3+ ion
图3
Emission spectra of the ErxYb1-x(TPB)3Bath (x=0.218, 0.799, 0.896, 0.987, 1, respectively) excited at 378 nm (a) whole emission spectra and (b) emission spectra of the Er3+ ion
Figure3.
Emission spectra of the ErxYb1-x(TPB)3Bath (x=0.218, 0.799, 0.896, 0.987, 1, respectively) excited at 378 nm (a) whole emission spectra and (b) emission spectra of the Er3+ ion
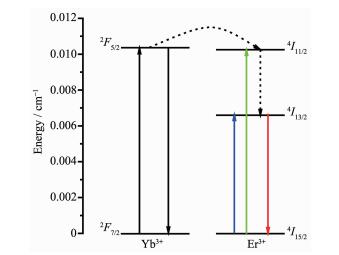
As far as the Em-Er is concerned, it varies with the nEr/nYb also, but the variation should be distinguished carefully. As shown in Fig. 3b, the intensity order of the Em-Er of the mixed complexes is Er0.799Yb0.201(TPB)3Bath > Er0.896Yb0.104(TPB)3Bath=Er0.218Yb0.782(TPB)3Bath >Er(TPB)3Bath > Er0.987Yb0.013(TPB)3Bath. With the increasing ratio of Er3+ ion from x=0.218 to 0.896, the mixed complexes show enhanced Em-Er, which is higher than that of Er(TPB)3Bath. This result confirm the presence of energy transfer from Yb3+ ion to Er3+ ion in these cases. Based on theory and experimental results, the energy processes involved in these mixed complexes was analyzed and depicted in Scheme 2. It is found that there is an optimal nEr/nYb for the mixed complexes. The Em-Er is most desirable when x=0.799, but further increasing x to 0.896, it decreased to the level as that of the case of x=0.218, and further increasing x to 0.987 causes the rapid decrease of Em-Er to even lower than that of the Er(TPB)3Bath complex. In this case, back energy transfer from Er3+ to Yb3+ ion was suggested to responsible for this phenomenon[26]. Further investigation about this phenomenon should be performed in future.
 图Scheme2
Energy transfer between Yb3+/Er3+ ion, here the higher energy levels of Er3+ ion are omitted
Scheme2.
Energy transfer between Yb3+/Er3+ ion, here the higher energy levels of Er3+ ion are omitted
图Scheme2
Energy transfer between Yb3+/Er3+ ion, here the higher energy levels of Er3+ ion are omitted
Scheme2.
Energy transfer between Yb3+/Er3+ ion, here the higher energy levels of Er3+ ion are omitted
3 Conclusions
In summary, a series of complexes based on ErxYb1-x(TPB)3Bath (x=0, 0.218, 0.799, 0.896, 0.987, and 1, respectively) with TPB and Bath as the first and second ligands, respectively, were prepared. Their luminescence properties of these obtained complexes were investigated experimentally. All the mixed complexes exhibit the characteristic emission of Yb3+ and Er3+ ion. Interestingly, the emission intensity of Er3+ ion can be enhanced by appropriately modulating the nEr/nYb. When x=0.799, the correspond mixed complexes realize the highest emission intensity of Er3+ ion attributed to the energy transfer from Yb3+ to Er3+ ion.
-
-
[1]
Chen X Y, Yang X, Holliday B. J. Am. Chem. Soc., 2008, 130:1546-1547 doi: 10.1021/ja077626a
-
[2]
Xin H, Li F Y, Shi M, et al. J. Am. Chem. Soc., 2003, 125: 7166-7167 doi: 10.1021/ja034087a
-
[3]
Deng R P, Yu J B, Zhang H J, et al. Chem. Phys. Lett., 2007, 443:258-263 doi: 10.1016/j.cplett.2007.06.080
-
[4]
Harbuzaru B, Corma A, Rey F, et al. Angew. Chem. Int. Ed., 2009, 48:6476-6479 doi: 10.1002/anie.v48:35
-
[5]
Harbuzaru B, Corma A, Rey F, et al. Angew. Chem. Int. Ed., 2008, 47:1080-1083 doi: 10.1002/(ISSN)1521-3773
-
[6]
Bünzli J G. Chem. Rev., 2010, 110:2729-2755 doi: 10.1021/cr900362e
-
[7]
Eliseeva S, Bünzli J G. Chem. Soc. Rev., 2010, 39:189-227 doi: 10.1039/B905604C
-
[8]
Stachowicz M, Kozanecki A, Lin J Y, et al. Opt. Mater., 2014, 36:1730-1733 doi: 10.1016/j.optmat.2014.02.013
-
[9]
Chen B T, Dong B, Wang J, et al. Nanoscale, 2013, 5:8541-8549 doi: 10.1039/c3nr02670a
-
[10]
Stacey O, Ward B, Amoroso A, et al. Dalton Trans., 2016, 45:6674-6681 doi: 10.1039/C5DT04351D
-
[11]
Gai Y L, Xiong K C, Chen L, et al. Inorg. Chem., 2012, 51: 13128-13137 doi: 10.1021/ic301261g
-
[12]
Moore B F, Kumar G A, Tan M C, et al. J. Am. Chem. Soc., 2011, 133:373-378 doi: 10.1021/ja1069322
-
[13]
Pawlak N, Oczko G, Starynowicz P, et al. Polyhedron, 2015, 101:152-159 doi: 10.1016/j.poly.2015.08.037
-
[14]
仇衍楠, 孙丽宁, 刘涛, 等.中国稀土学报, 2012, 30(2):129-145 http://kns.cnki.net/KCMS/detail/detail.aspx?filename=xtxb201202002&dbname=CJFD&dbcode=CJFQQIU Yan-Nan, SUN Li-Ning, LIU Tao, et al. J. Chin. Soc. Rare Earths, 2012, 30(2):129-145 http://kns.cnki.net/KCMS/detail/detail.aspx?filename=xtxb201202002&dbname=CJFD&dbcode=CJFQ
-
[15]
Mitra S, Jana S. J. Fluoresc., 2015, 25:541-549 doi: 10.1007/s10895-015-1526-0
-
[16]
Sun Q Y, Yan P F, Niu W Y, et al. RSC Adv., 2015, 5: 65856-65861 doi: 10.1039/C5RA12954K
-
[17]
Artizzu F, Mercuri M L, Serpe A, et al. Coord. Chem. Rev., 2011, 255:2514-2529 doi: 10.1016/j.ccr.2011.01.013
-
[18]
ZHOU Shi-Feng(周时凤). Thesis for the Doctorate of Zhejiang University(浙江大学博士论文). 2008. http://cdmd.cnki.com.cn/Article/CDMD-10335-2009020785.htm
-
[19]
Glover P B, Bassett A P, Nockemann P, et al. Chem. Eur. J., 2007, 13:6308-6320 doi: 10.1002/(ISSN)1521-3765
-
[20]
Bünzli J G. Coord. Chem. Rev., 2015, 293-294:19-47 doi: 10.1016/j.ccr.2014.10.013
-
[21]
Chen F F, Chen Z Q, Bian Z Q, et al. Coord. Chem. Rev., 2010, 254:991-1010 doi: 10.1016/j.ccr.2009.12.028
-
[22]
Lü Q, Feng W X, Hui Y N, et al. Eur. J. Inorg. Chem., 2010:2714-2722 doi: 10.1002/ejic.201000100/full
-
[23]
禹钢, 卞祖强, 刘志伟, 等.中国科学:化学, 2014, 44: 267-276 http://kns.cnki.net/KCMS/detail/detail.aspx?filename=jbxk201402011&dbname=CJFD&dbcode=CJFQYU Gang, BIAN Zu-Qiang, LIU Zhi-Wei, et al. Sci. China Chem., 2014, 44: 267-276 http://kns.cnki.net/KCMS/detail/detail.aspx?filename=jbxk201402011&dbname=CJFD&dbcode=CJFQ
-
[24]
Yang T H, Fu L S, Rute A S. Eur. J. Inorg. Chem., 2015: 4861-4868 doi: 10.1002/ejic.201500611/full
-
[25]
Faulkner S, Pope S. J. Am. Chem. Soc., 2003, 125:10526-10527 doi: 10.1021/ja035634v
-
[26]
Rodríquez V D, Tikhomirov V K, Méndez-Ramos J, et al. Sol. Energy Mater. Sol. Cells, 2010, 94:1612-1617 doi: 10.1016/j.solmat.2010.04.081
-
[27]
Tikhomirov V K, Rodríguez V D, Méndez-Ramos J, et al. Sol. Energy Mater. Sol. Cells, 2012, 100:209-215 doi: 10.1016/j.solmat.2012.01.019
-
[28]
Miritello M, Cardile P, Savio R, et al. Opt. Express, 2011, 19:20761-20772 doi: 10.1364/OE.19.020761
-
[29]
Johnson N J, He S, Diao S, et al. J. Am. Chem. Soc., 2017, 139:3275-3282 doi: 10.1021/jacs.7b00223
-
[30]
Li W Z, Li J Y, Li H F, et al. J. Lumin., 2014, 146:205-210 doi: 10.1016/j.jlumin.2013.09.009
-
[31]
Kang T S, Harrison B S, Bouguettaya M, et al. Adv. Funct. Mater., 2003, 13:205-210 doi: 10.1002/adfm.200390031
-
[32]
Shu Y B, Liu W S. Sci. Chin. Chem., 2016, 59:436-441
-
[1]
-

Figure 2 Emission spectra of (a) Er0.896Yb0.104(TPB)3Bath and (b) Er0.218Yb0.782(TPB)3Bath

Figure 3 Emission spectra of the ErxYb1-x(TPB)3Bath (x=0.218, 0.799, 0.896, 0.987, 1, respectively) excited at 378 nm (a) whole emission spectra and (b) emission spectra of the Er3+ ion

Scheme2 Energy transfer between Yb3+/Er3+ ion, here the higher energy levels of Er3+ ion are omitted
Table 1. Raw and detected nEr/nYb for the mixed complexes ErxYb1-x(TPB)3Bath
Raw nEr/nYb Detected nEr/nYba Resulted complexes CEr/(μg·g-1) CYb/(μg·g-1) nEr/nYb 2/8 28 540 106 200 0.218/0.782 Er0.218Yb0.782(TPB)3Bath 5/5 88 020 11 300 0.896/0.104 Er0.896Yb0.104(TPB)3Bath 8/2 137 800 35 860 0.799/0.201 Er0.799Yb0.201(TPB)3Bath 9/1 155 300 2 036 0.987/0.013 Er0.987Yb0.013(TPB)3Bath aDetected nEr/nYb is resulted from: (CEr/MEr)/(CYb/MYb), where CEr and CEr denote the detected contents of Er3+ and Yb3+ ion, MEr and MYb is the atomic weight of the Er3+ and Yb3+ ion, respectively.  下载: 导出CSV
-


 扫一扫看文章
计量
- PDF下载量: 2
- 文章访问数: 594
- HTML全文浏览量: 96
 下载:
下载:
